El-Refaie Kenawy, Abdel-Baset M. Shokr, M. Serag
Polymer Research Group, Chemistry Department, Faculty of Science, Tanta University, Tanta, Egypt
Correspondence to: El-Refaie Kenawy, Polymer Research Group, Chemistry Department, Faculty of Science, Tanta University, Tanta, Egypt.
| Email: |  |
Copyright © 2016 Scientific & Academic Publishing. All Rights Reserved.
This work is licensed under the Creative Commons Attribution International License (CC BY).
http://creativecommons.org/licenses/by/4.0/

Abstract
Novel modification of ethylene- vinyl alcohol copolymers were carried out. The modifications of series of the copolymers were carried out by reacting them with chloroacetyle chloride followed by amination with ethylene diamine which used for many applications, such as water sterilization, drugs, soil sterilization, biomedical-device sterilization, and prevention of the microbial contamination of shipboard, water compensated, and hydration fuel tanks. The structure of the resulting materials was characterized with Fourier transform infrared-spectroscopy, TGA analysis and elemental analysis. The antimicrobial activity of the polymers against variety of test microorganisms was examined by the cut plug and viable cell counting methods. It was found that the immobilized polymers exhibited antimicrobial activity against the Gram negative bacteria (Escherichia coli ATCC 8739), Gram-positive bacteria (Staphylococcus aureus ATCC 6633), fungi (Candida albicans and Aspergillus niger. The growth inhibition of the test microorganisms (ratio of surviving cell number, M/C) varied according to the composition of the active group in the polymer and the test organism. It increased by increasing the concentration of the modified copolymers.
Keywords:
(Ethylene-vinyl alcohol) copolymer, Antimicrobial polymers and polymer modifications
Cite this paper: El-Refaie Kenawy, Abdel-Baset M. Shokr, M. Serag, Biocidal Polymers by Chemical Modification of (Ethylene-vinyl Alcohol) Copolymers, International Journal of Materials and Chemistry, Vol. 6 No. 2, 2016, pp. 28-39. doi: 10.5923/j.ijmc.20160602.02.
1. Introduction
In the last few years, much attention has been paid to the problems of health and environmental pollution. Infection by pathogenic microorganisms is of great concern in many fields, particularly in medical devices, drugs, health care products and hygienic applications, food packaging, water purification systems, hospital and hospital furniture, dental surgery equipment, textiles, food storage, etc. [1, 2]. Antimicrobial agents are used for many applications, such as water sterilization, drugs, soil sterilization, biomedical-device sterilization, and prevention of the microbial contamination of shipboard, water compensated, and hydration fuel tanks [3]. They are also in common use in the areas of health care and hygienic applications such as sterile bandages and clothing (e.g., antimicrobial surgical gowns and antifungal athletic socks). Furthermore, antimicrobial agents are commonly used in coating of surfaces such as ship hulls, shower walls, and many kinds of tubing to minimize the problems of bio-fouling. The use of antimicrobial polymers offers promise for enhancing the efficacy of some existing antimicrobial agents and minimizing the environmental problems accompanying conventional antimicrobial agents by reducing the residual toxicity of the agents, increasing their efficiency and selectivity, and increasing duration of the antimicrobial agents. Also, polymeric antimicrobial agents do not permeate through skin; they are nonvolatile and chemically stable. For these reasons, they reduce losses associated with volatilization, photolytic decomposition, and transportation. In the field of biomedical polymers, infections associated with biomaterials represent a significant challenge to the more widespread application of medical implants [1]. Functional polymers have the potential advantages over small analogous molecules. Their usefulness is related to both the functional groups and to their polymeric nature whose characteristic properties depend on the extraordinarily large size of the molecules [4].Ethylene vinyl alcohol copolymer (EVOH) is a semi-crystalline copolymer of ethylene and vinyl alcohol monomer units [5]. The repeating unit of EVOH copolymer has the following chemical structure: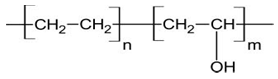 Copolymerization is widely used to provide an opportunity to adjust properties of the resulting resins to meet specific needs in utility of polymers that would otherwise be of limited use. As mentioned earlier, EVOH copolymer, one of the monomer units in EVOH, has exceptional gas barrier properties, but it is water soluble and difficult to process. PE, the other parent monomer, has good water resistance, but also has one of the poorest gas barrier properties. Copolymerization of monomer units based on PVOH and PE results in EVOH copolymers which have improved properties in terms of gas barrier, processability, and sensitivity to moisture. In this work, EVOH copolymer was modified to introduce certain functional groups.
2. Experimental
2.1. Reaction of Ethylene-vinyl alcohol (EVOH) Copolymers with Chloroacetyl Chloride
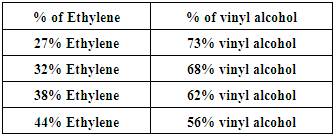
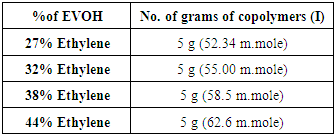
The procedure was as follows:This reaction was carried out for EVOH copolymer with various ratios shown in table 1. EVOH copolymer 10 g was dissolved in DMSO at 120°C, the mixture was stirred at 120°C until clear solution was obtained and cooled to room temperature, then dry pyridine was added, the mixture was stirred for one hr., chloroacetyle chloride was added drop wise under dry condition to the mixture during 5 hrs. The mixture was stirred for 4 days at room temperature to give copolymers (I).Table (1). EVOH copolymer various ratios
 |
| |
|
The copolymers (I) was filtrated as dark yellowish brown material, then was washed by dilute hydrochloric acid (10%) many times until pyridine odor disappeared then washed with distilled water several times. The product was dried under vacuum at 30°C in the presence of CaCl2 anhydrous until constant weight was reached.
2.2. Reaction of Copolymers (I) with Ethylenediamine
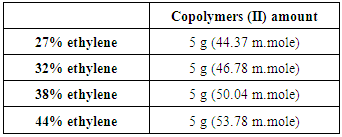
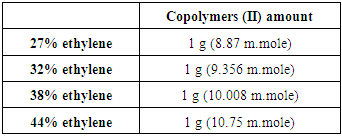
This reaction was carried out for copolymers (I) with various copolymer ratios as shown in table 2. Following procedures are typically for different ratios, the copolymers (I) 5g was dissolved in ethylenediamine 25 ml at 90°C, the mixture was stirred at 90°C for 6 hr., then was left under stirring for another day at room temperature to obtain copolymers (II). Table (2). Various copolymers (I) used for reaction with ethylenediamine
 |
| |
|
The copolymers (II) was filtrated as reddish brown material, then was washed with distilled water many times until amine odor disappeared then was washed with acetone several times, the product was dried under vacuum at 30°C in the presence of CaCl2 anhydrous until constant weight was reached.
2.3. Quternization of Copolymers (II) (reaction of Copolymers (II) with methyl iodide)
Two methods were used for Quternization of Copolymers (II):a. First method (without NaOH) The quternization for copolymers (II) was carried out with various ratios of copolymer as shown in table 3. Methyl iodide 30 ml was added to the copolymers (II) 5g in 5ml benzene, the reaction mixture was refluxed at 120°C for 12 hrs. Then was filtrated and washed with acetone several times and dried under vacuum.Table (3). Various copolymers used for quaternization with methyl iodide to copolymers (II) by first method
 |
| |
|
b. Second method (with NaOH)The quternization for copolymers (II) was carried out with various copolymer ratios as shown in table 4. Methyl iodide 30 ml was added to the copolymers (II) 5g in 20ml of NaOH (l0%) then refluxed at 120°C for 12 hrs., the product was filtrated and washed by acetone until constant weight was reached.Table (4). Various copolymers used for quaternization with methyl iodide to copolymers (II) by second method
 |
| |
|
3. Biocidal Activities of the Modified Copolymers
3.1. Tested Microorganisms
The microbial strains were obtained from Bacteriological lab, Microbiology section, Botany Department, Faculty of Science, Tanta University: The Gram-negative bacteria (Escherichia coli ATCC 8739), Gram-positive bacteria (Staphylococcus aureus ATCC 6633), fungi (Candida albicans and Aspergillus niger) were used to examine the antimicrobial activity of the polymers The bacterial strains were maintained on nutrient agar (3 g peptone, 5 g NaCl, 5 g beef extract, 20 g agar per liter, pH=7.4).
3.2. Cut Plug Method for Screening of Antimicrobial Activity for Tested Copolymers
Cut plug method was employed to determine the antimicrobial activity of the chosen products as follows: Freshly prepared spore suspension of different test microorganisms (0.5 ml of about 106 cells/ml) was mixed with 9.5 ml of melting sterile Sabouraud's dextrose medium (for fungi) or nutrient agar medium (for bacteria) at 45°C, poured on sterile Petri dishes, and left to solidify at r.t. Regular wells were made in the inoculated agar plates by a sterile cork borer of 0.70 mm diameter. Each well was filled with 20 mg of each tested powder. Three replicas were made for each test, and all plates were incubated at 27°C for 3 days for fungi, and at 32°C for 24 h for bacteria. Then the average diameters of inhibition zones were recorded in centimeters, and compared for all plates [6].
3.3. Minimal Inhibitory Concentrations (MICs)
The most antimicrobial active copolymers were chosen to determine their MIC values against the most sensitive microorganism by tube dilution assay.
3.4. Tube Dilution Assay
Nutrient broth was used for the tube dilution to determine MICs of tested bacteria. The MIC value of tested compounds was determined using two-fold broth micro-dilution. One millimeter of sterile media was added to 1 ml of different compound concentrations (100, 50, 25, 12.5, 6.3, 3.2 and 1.6, 0.8, 0.4 and 0.2 mg/1 ml). The tubes were then inoculated with a drop of microbial suspension (25 μl) and incubated at 37°C for 24 h. Tetracycline (100-0.0031 mg/ml) was used as standards antimicrobial drug (positive control). DMSO was used as the negative control. After incubation, certain amount of each tube was spreeded on agar plates and then incubated for 24 hrs. And then the numbers of colonies were counted. The MIC endpoints were detected as the lowest concentration of tested copolymers at which the growth of the tested microorganisms was inhibited. The minimum bactericidal concentration (MBC) endpoints are defined as the lowest concentration of antimicrobial agent that kills > 99.9% of the initial bacterial population and detected when no visible growth of bacteria was observed on the agar plates [7].
3.5. Statistical Analysis
All experiments and analytical determinations were replicated at least three times and mean value was calculated.
3.6. Physiological Measurements
For studying the effect of antimicrobial agents on the physiological parameters of microbial cells, tested microorganism was cultured on the appropriate liquid nutrition medium to get a cell suspension of 5x10⁶ cells/ml, and then mixed with the tested antimicrobial agent of the previously recorded MIC. All the mixture was incubated overnight on a shaking incubator of 60 rpm at the appropriate temperature. Then treated mixture was centrifuged at 3000 rpm for 20 min., washed with sterile distilled water, re-centrifuged to collect the cell pellet in a clean Eppendorf tube; cells were broken for extraction of intracellular content by grinding with glass beads in 1 mL distilled. H2O, filtered, and supernatants were collected, and stored at 4°C for further analysis.
3.6.1. Estimation of Total Soluble Cell Proteins Concentration
Comassie brilliant blue G-250 dye of 100 mg was dissolved in 50 ml of 95% ethanol + 100 ml of 85% phosphoric acid, diluted to 1 L. distilled, water, then filtered. 0.1 mL of previously treated cell extract was mixed with 5 mL of Comassie dye, shake well for 5 min., light absorbance of mixture was recorded at λ=595 nm. Records of absorbance indicate the conc. of total soluble cell proteins in tested supernatants using a previously drawn standard curve of light absorbance of known concentrations of bovine serum albumin as a standard protein stained and measured in the same way as the unknown sample [8, 9].
3.6.2. Estimation of Total Cell Ionic Content
All minerals and ionic components of the treated cells were released in the previously treated, and stored extract of broken cells. Each tested suspension was diluted to 10 ml with dist. water, then the electrode of EC-meter (Sensorex CS200TC lab conductivity sensor, USA) was immersed in the suspension, and the potential of electric current was recorded. The concentration of total ions present in the tested suspension was indicated by the records of electric current potential, that can be read from a previously prepared standard curve of electric conductivity of known conc. of known electrolyte [8].
4. Results and Discussion
4.1. Reaction of Ethylene-vinyl alcohol (EVOH) Copolymers with Chloroacetyl Chloride
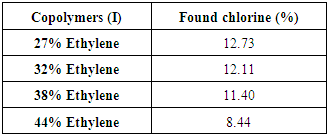
Reaction of poly(ethylene co vinyl alcohol)l (EVOH) with chloroacetyl chloride is occurred and yielded copolymers (I) as shown in scheme (1) which elucidated its structure by FT-IR spectra as shown in figure (1), % of chlorine in copolymers (I) formed are determined by using elemental analysis as shown in table (5).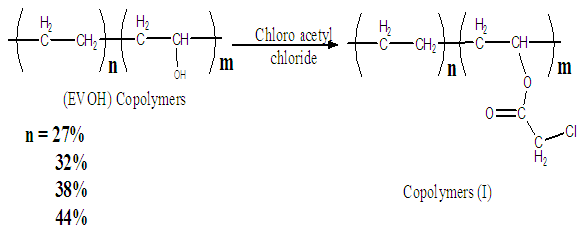 | Scheme (1). Reaction of Ethylene-vinyl alcohol (EVOH) Copolymers with chloroacetyl chloride |
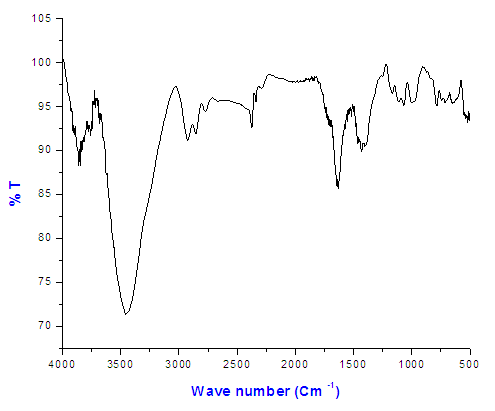 | Figure (1). The FT-IR spectrum of Copolymer (I) 27% ethylene |
Table (5). Elemental analyses results Show % chlorine in Copolymers (I)
 |
| |
|
The FT-IR spectrum of Copolymer (I) 27% ethylene indicated the presence of peaks at 785 cm-1 (C-Cl) and at 1750 cm-1 which confirmed the formation of ester bond as shown in Figure (1).
4.2. Reaction of Copolymers (I) with Ethylenediamine
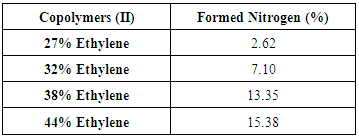
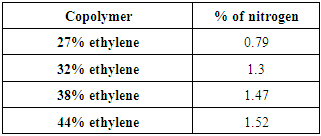
Reaction of Copolymers (I) with Ethylenediamine was carried out and yielded copolymers (II) as shown in scheme (2). The structure of the modified copolymer (II) was elucidated by FT-IR spectra as shown in figure (2), % of Nitrogen in copolymers (II) formed are indicated by using elemental analysis as shown in table (6).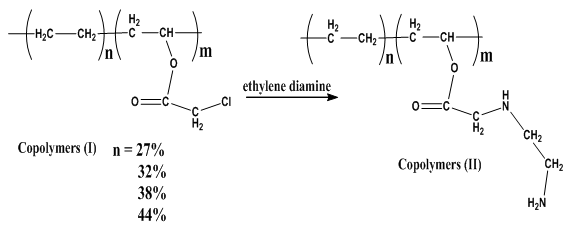 | Scheme (2). Reaction of copolymers (I) with Ethylene diamine |
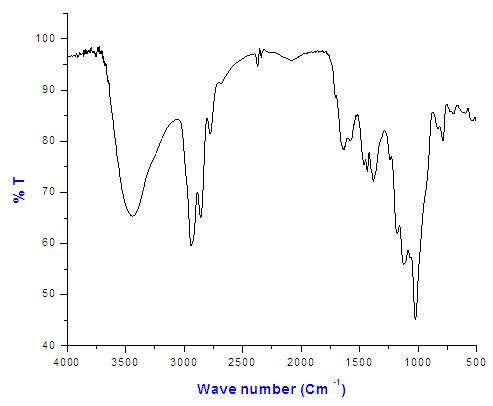 | Figure (2). The FT-IR spectrum of Copolymer (II) 27% ethylene |
Table (6). Elemental analyses results Show % Nitrogen in Copolymers (II)
 |
| |
|
The FT-IR spectrum of Copolymer (II) 27% ethylene indicated the presence of peaks at 3409cm-1 (NH2 group) and at 3333cm-1 (NH group) as shown in Figure (2).
4.2.1. Thermo Gravimetric Analysis (TGA)
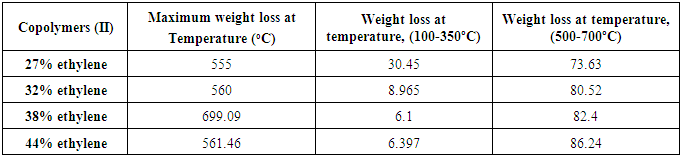
TGA has been used extensively in the study of polymeric systems. This analytical technique used to determine materials thermal stability and its fraction of volatile components by monitoring the weight loss of the sample in Copolymers (II) as a function of temperature. Figure (3) shows the TGA experimental results of Copolymers (II), all the detail results are presented in Table (7). The TGA curves of are shifted in order to see the changes of the weight loss clearly. The samples were measured in the temperature range from 30oC to 800oC with a constant rate of 20ºC/min under nitrogen atmosphere. Figure (3) show that the weight loss of the sample increases as the temperature increases. This shows that degradation of the sample occurred in the system. The TGA curves show that sample exhibited three distinct weight loss stages. The first stage presents the loss of water while second stage exhibits the decomposition of side chain of Copolymers (II) while the third stage shows the decomposition of main chain of Copolymers (II). It can be seen that the major weight loss are observed at about 70-90 wt% in the range of 500-700ºC which correspond to the structural decomposition of Copolymers (II). A typical weight loss occurred at about 100-200ºC due to moisture escape during the melting [9], reported that the mass loss from 100-200ºC to the onset decomposition temperature is related to the loss of water. At about 500-700ºC the graph shows complete decomposed of the sample. The weight loss of the sample increases as the increase of % ethylene in the copolymer (II) increases which indicate that it has a higher thermal stability. The second and third stages of TGA curves reveal the temperature at which the maximum decrease of mass occurs. The TGA data clearly shows that the side chains of Copolymers (II) are readily decomposed prior to the main chains [10]. The maximum weight loss of the Copolymer (II) 27% ethylene shifted to a lower temperature compared to the Copolymer (II) 44% ethylene [11]. Table (7). Shows the TGA experimental results of Copolymers (II)
 |
| |
|
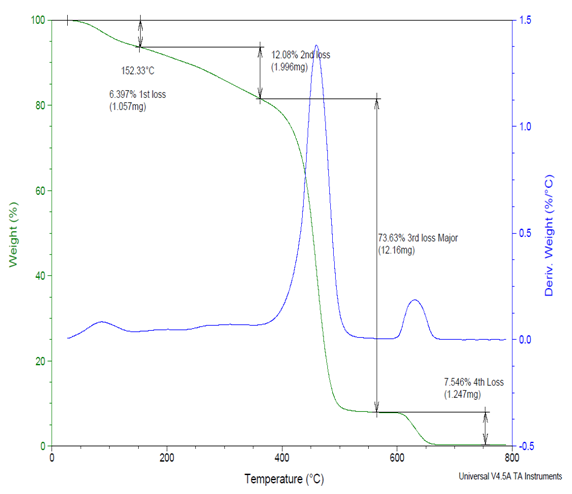 | Figure (3). Show the TGA experimental results of Copolymer (II) 27% Ethylene |
4.3. Quternization of Copolymers (II): (reaction of Copolymers (II) with methyl iodide)
There are two methods for Quternization of Copolymers (II):
4.3.1. First Method (without NaOH)
Reaction of Copolymers (II) with methyl iodide without addition NaOH is carried out and yielded copolymers (III) as shown in scheme (3) which elucidated its structure by FT-IR spectra as shown in figure (4), % of Nitrogen in copolymers (III) formed are determined by using elemental analysis as shown in table (8).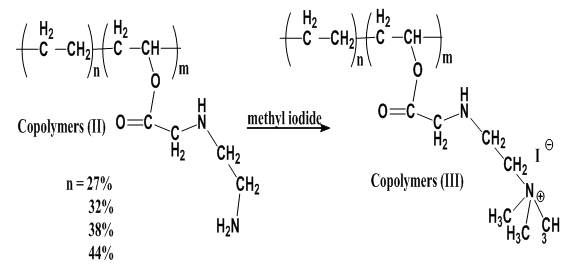 | Scheme (3). Quternization of Copolymers (II) without (NaOH) |
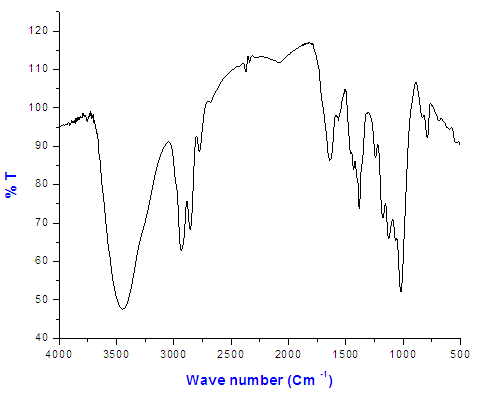 | Figure (4). The FT-IR spectrum of Copolymer (III) 27% ethylene by first method |
Table (8). Elemental analyses results Show % Nitrogen in Copolymers (III) without (NaOH)
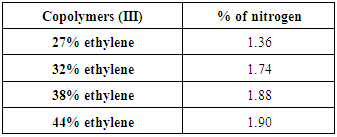 |
| |
|
The FT-IR spectrum of Copolymer (III) 27% ethylene by first method and indicate the presence of peak at 3200cm-1 which is assigned for (ammonium ions). Figure (4)
4.3.2. Second Method (with NaOH)
Reaction of Copolymers (II) with methyl iodide and addition of NaOH is occurred and yield copolymers (III) as shown in scheme (4) which elucidated its structure by FT-IR spectra as shown in figure (5), % of Nitrogen in copolymers (III) formed are determined by using elemental analysis as shown in table (9). 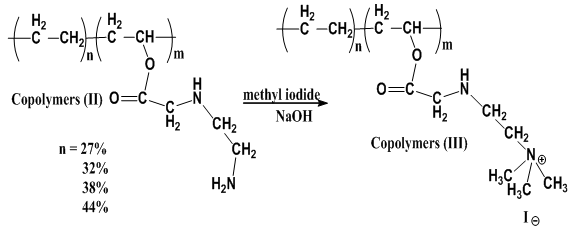 | Scheme (4). Quternization of Copolymers (II) with (NaOH) |
Table (9). Elemental analyses results of Copolymers (III) with (NaOH)
 |
| |
|
Copolymer (III) (27% ethylene) by second method was investigated by the FT-IR spectrum Figure (5): determined the presence of peak at 3100cm-1 which is assigned to (ammonium ions).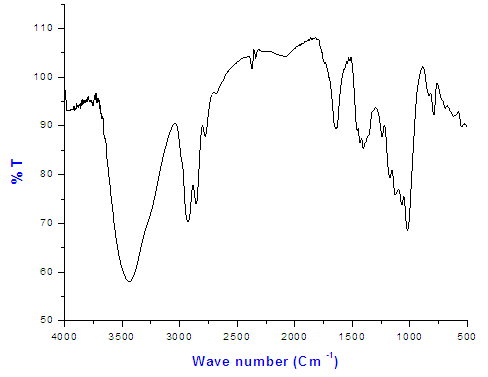 | Figure (5). The FT-IR spectrum of Copolymer (III) 27% ethylene by second method |
4.3.3. Thermo Gravimetric Analysis (TGA)
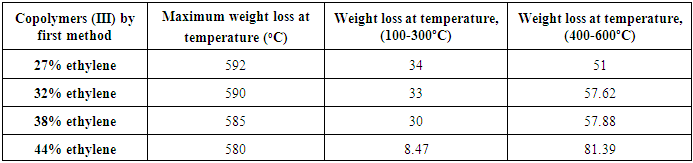
The major weight loss are observed at about 70-90 wt% in the range of 500-600ºC which correspond to the structural decomposition of Copolymers (III) by first method. A typical weight loss occurred at about 100-200°C due to moisture escape during the melting [9], reported that the mass loss from 100-200°C to the onset decomposition temperature is related to the loss of water, at about 500-600°C the graph shows complete decomposed of the sample. The second and third stages of TGA curves as shown in Figure (6) reveal the temperature at which the maximum decrease of mass occur.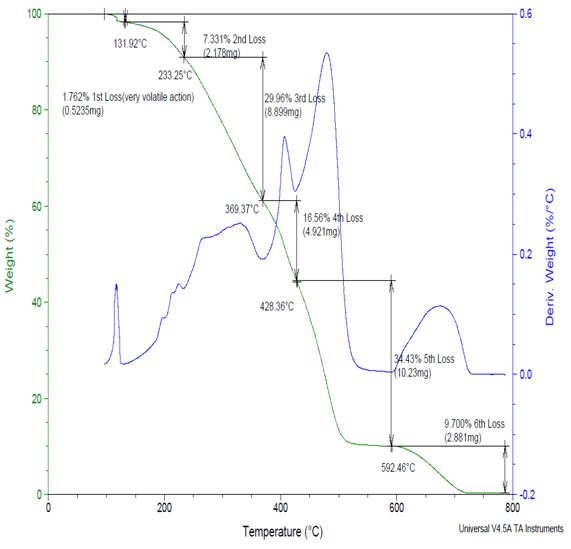 | Figure (6). Shows the TGA experimental results of Copolymer (III) 27% Ethylene by first method |
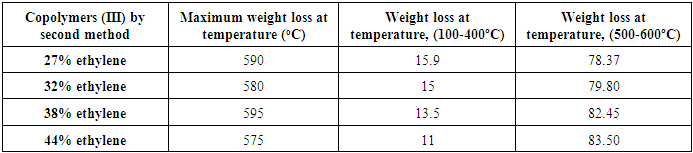
The TGA data clearly shows that the side chains of Copolymers (III) by first method are readily decomposed prior to the main chains [10].The maximum weight loss of the Copolymers (II) different from Copolymers (III)by first method and that may because the additional of thee methyl group to the Copolymers (II) main chain which decrease the thermal stability of the copolymers (III) by first method, also it was interested to notice that the reaction by second method show increase in the thermal stability of the copolymers (III) by second method that may be due to higher loading of methyl group on the Nitrogen atom than when NaOH is presence as shown in figure (7).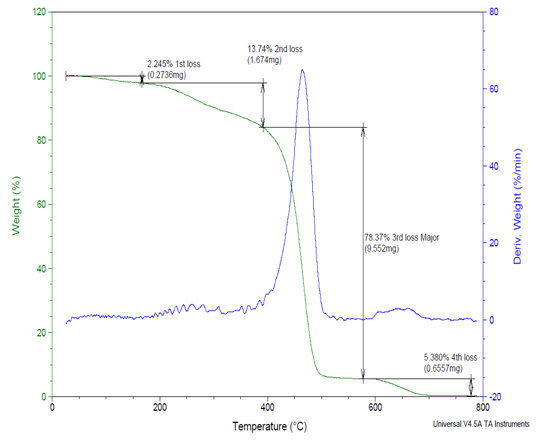 | Figure (7). Shows the TGA experimental results of Copolymer (III) 27% Ethylene by second method |
Table (10) show that the weight loss of the copolymers (III) by first method increases as the increase of % ethylene in the copolymers (III) by first method. Table (11) shows that the weight loss of the copolymers (III) by second method increases as the increase of % ethylene in the copolymers (III) by second method.Table (10). Shows the TGA experimental results of Copolymers (III) by first method
 |
| |
|
Table (11). Shows the TGA experimental results of Copolymers (III) by second method
 |
| |
|
4.4. Antimicrobial Activity
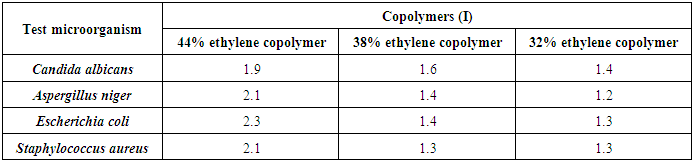
The antimicrobial activities of the modified copolymers were investigated: Copolymers (I) possessed a highly observable antimicrobial activity against all the tested fungi and bacteria for all the prepared concentrations, as it ranged from inhibition zone diameters of 1.2 cm for the concentration of 32% ethylene against A. niger to inhibition zone diameters of 2.3 cm for the concentration of 44% ethylene against E. coli, as represented in table (12), photo (1) [12].Table (12). Inhibition of linear growth of the selected pathogenic fungi and bacteria by different Copolymers (I) (diameter of inhibition zone = cm)
 |
| |
|
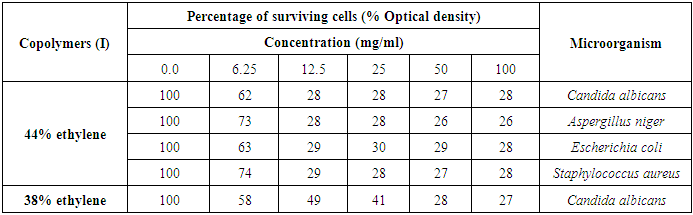
Thes was confirmed by a very effective MIC value at 12.5 mg/ml for the Copolymer (I) 44% ethylene against C. albicans, A. niger, E. coli, and S. aureus isolates, as represented in table (13) and figure (8).Table (13). Minimum inhibitory concentration of the Copolymers (I) against various microorganisms
 |
| |
|
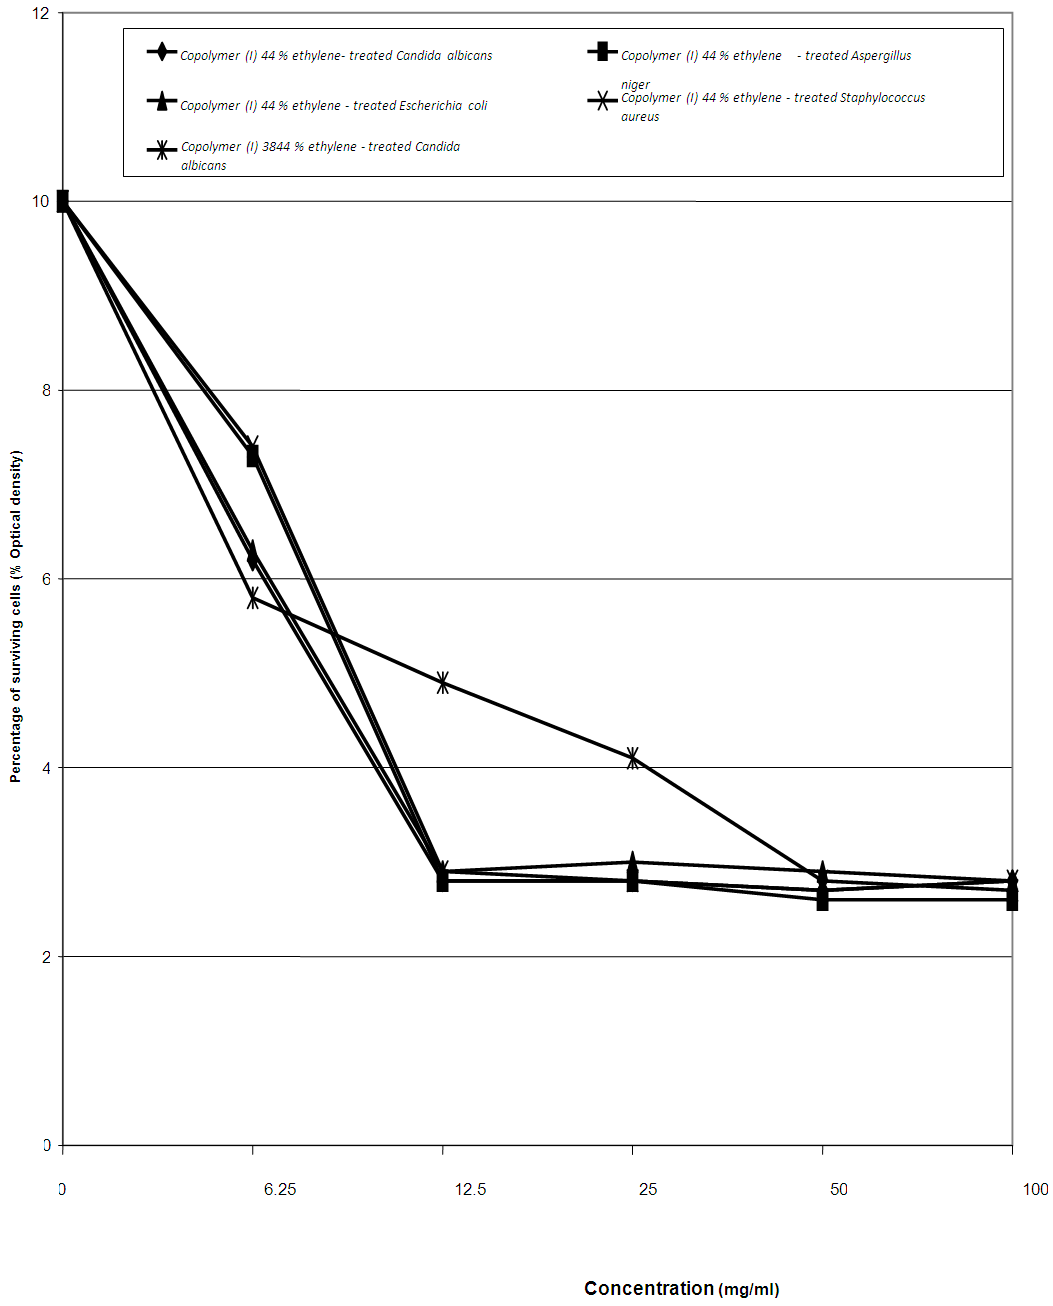 | Figure (8). MIC of the tested Copolymers (I) against the most susceptible microorganisms |
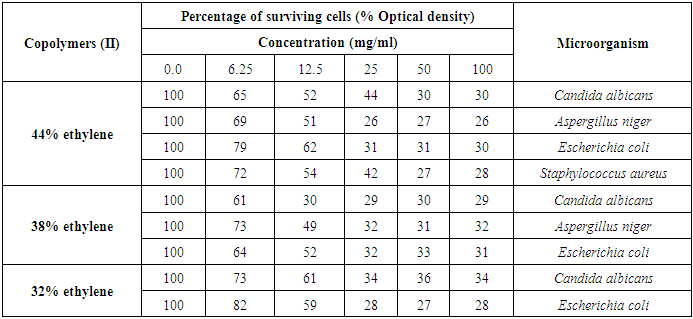
Copolymers (II) possessed the highest observed antimicrobial activity in the present study against all the tested fungi and bacteria for all the prepared concentrations, as it was noticeable that the activity was directly proportional with the prepared concentration. Inhibition zone diameters varied from 1.2 cm for the concentration of 32% ethylene against S. aureus to 2.2 cm for the concentration of 44% ethylene against E. coli, as shown in table (14) and photo (1) [13].Table (14). Inhibition growth of the selected pathogenic fungi and bacteria by different Copolymers (II) (diameter of inhibition zone in cm)
 |
| |
|
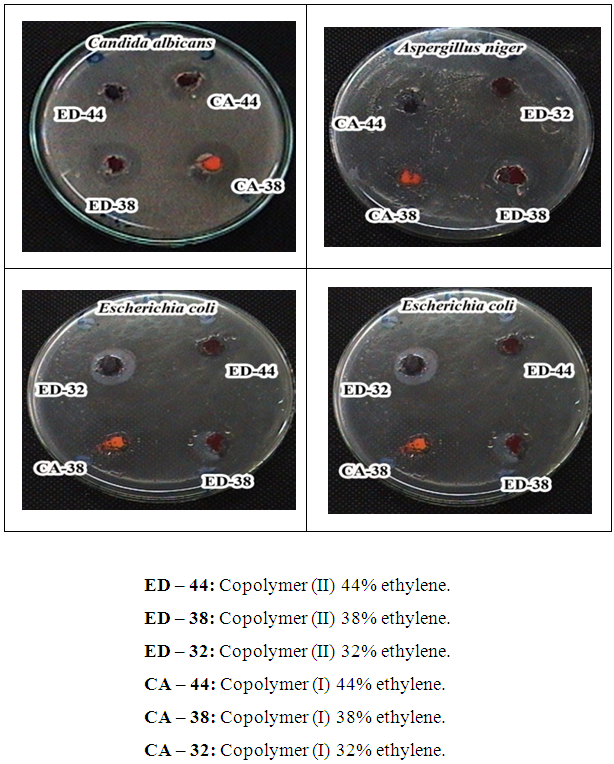 | Photo (1). Representative examples for the Inhibition of linear growth of the most susceptible microorganisms against different Copolymers (II) and Copolymers (I) |
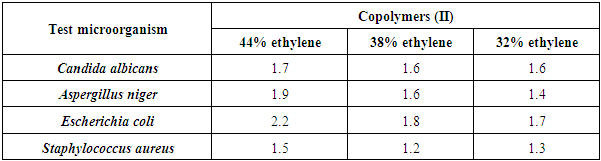
These observations were confirmed by the best MIC value of 12.5 mg/ml for the concentration of Copolymer (II) 38% ethylene against C. albicans, and MIC value of 25 mg/ml for the concentration of 44% ethylene against both Aspergillus niger, E. coli, and S. aureus, as represented in table (15) and figures (9 and 10).Table (15). Minimum inhibitory concentration of the tested Copolymers (II) against the most susceptible microorganisms
 |
| |
|
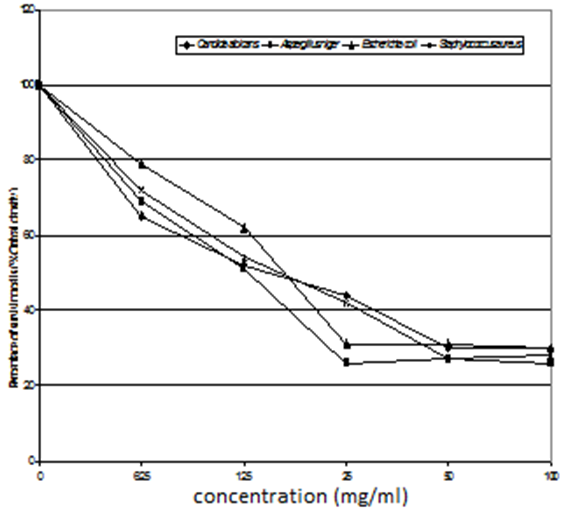 | Figure (9). MIC of the tested copolymer (II) 44% ethylene against the most susceptible microorganisms |
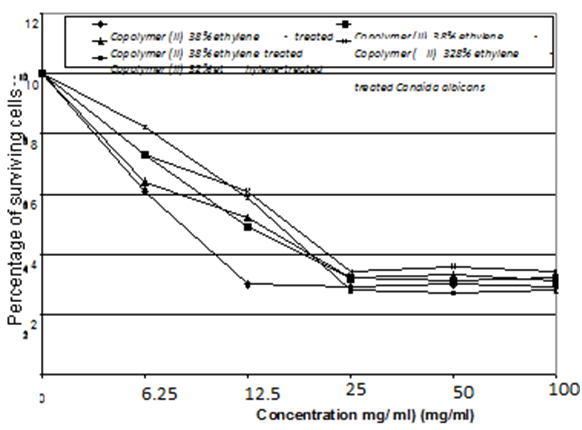 | Figure (10). MIC of the tested Copolymer (II) 38 % and 32% ethylene against the most susceptible microorganisms |
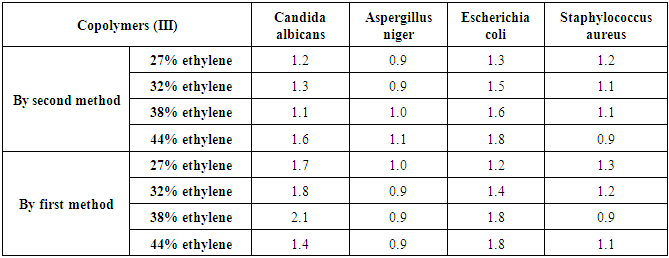
Linear growth of C. albicans can be affected in a higher range by copolymers (III) by first method (inhibition zone diameters of 1.7 cm, 1.8 cm, and 2.1 cm against concentrations of 27% ethylene, 32% ethylene, and 38% ethylene, respectively). The same results were obtained for the linear growth of E. coli against copolymers (III) by second method (inhibition zone diameters of 1.8 cm for both concentrations of 38% ethylene and 44% ethylene), as shown in table (16) and photo (2) [14].Table (16). Inhibition of linear growth of the selected pathogenic fungi and bacteria by different Copolymers (III) (diameter of inhibition zone = cm)
 |
| |
|
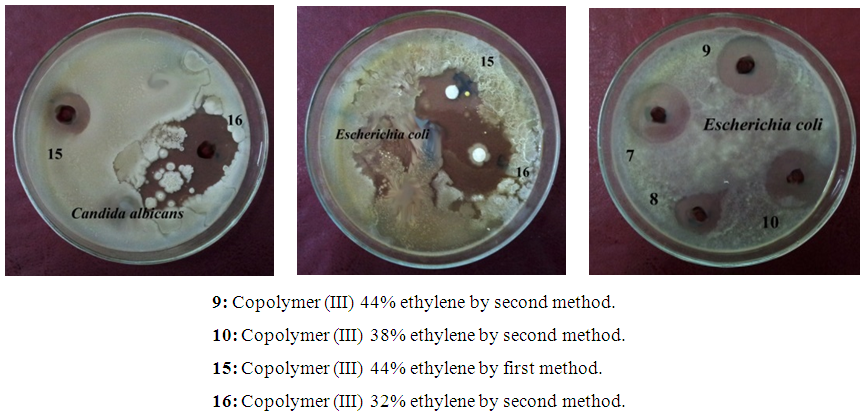 | Photo (2). Representative examples for the Inhibition of linear growth of the most susceptible microorganisms against different Copolymers (III) |
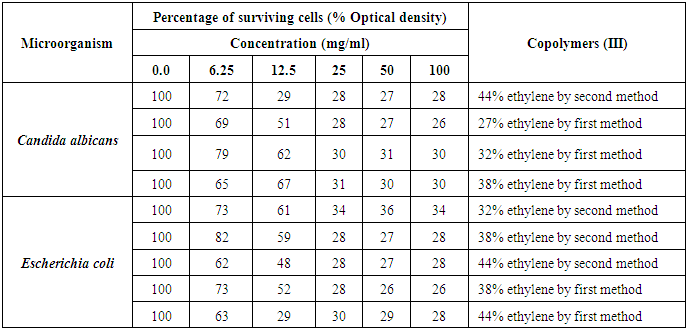
These findings can be confirmed by MIC records for C. albicans, as it possessed 25 mg/ml of MIC against the concentration of 27% ethylene, 32% ethylene, and 38% ethylene of the copolymers (III) by first method. Also, E. coli recorded MIC values of 25 mg/ml against both 38% ethylene and 44% [15, 16] ethylene concentrations for the copolymers (III) by second method, as represented in table (17) and figures (11 and 12).Table (17). Minimum inhibitory concentration of the tested Copolymers (III) against the most susceptible microorganisms
 |
| |
|
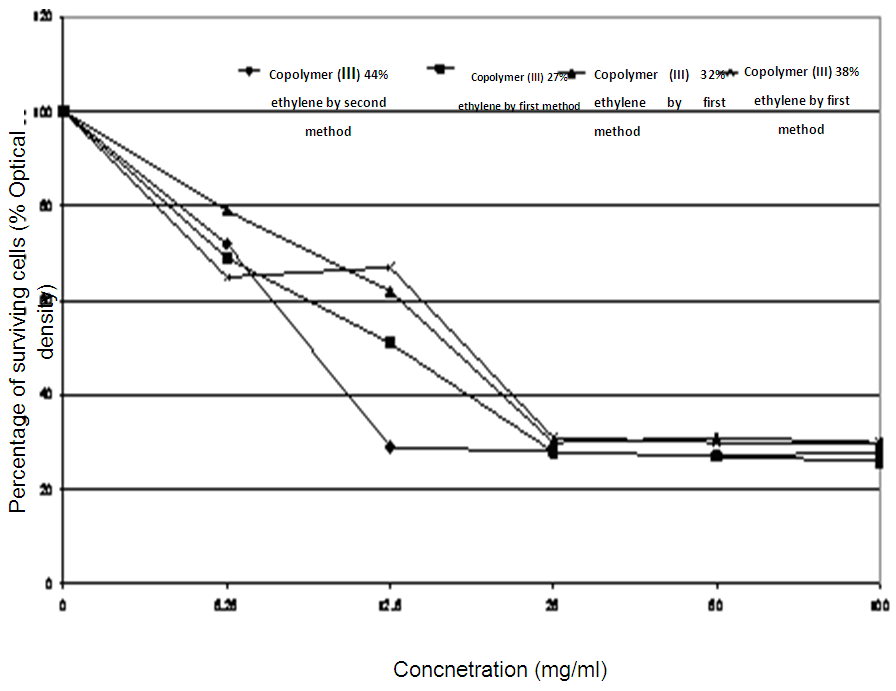 | Figure (11). MIC of the tested Copolymer (III) quaternized aminated derivatives against Candida albicans |
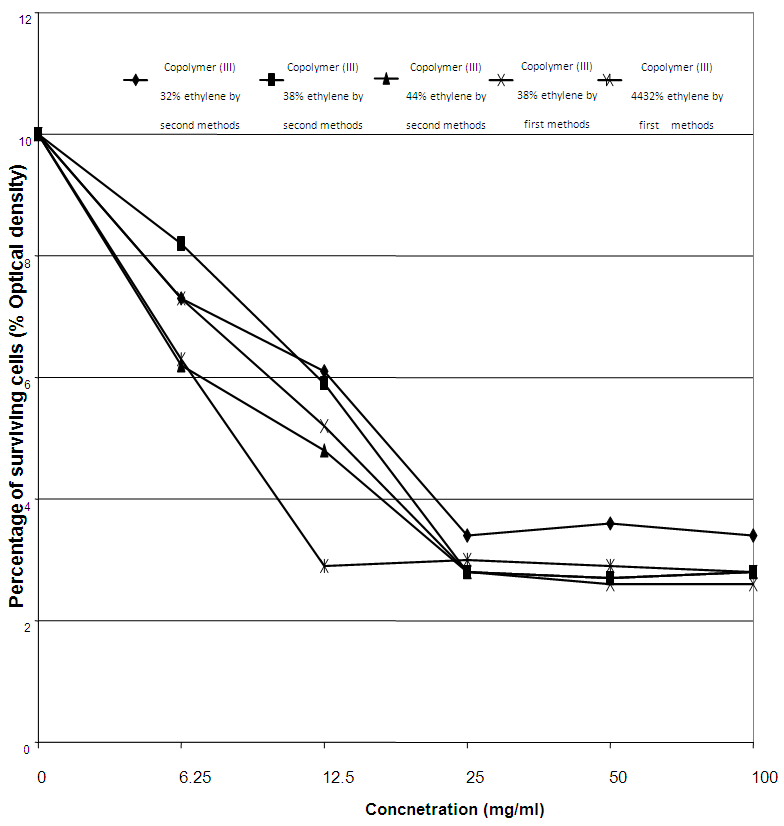 | Figure (12). MIC of the tested Copolymer (III) against Escherichia coli |
5. Conclusions
The modification of series of the copolymers was carried out by reacting them with chloroacetyle chloride followed by amination with ethylene diamine which used for Anti-microbial activity. Also Quternization of Copolymers (II) was obtained. Copolymers (I) possessed a highly observable antimicrobial activity against all the tested fungi and bacteria for all the prepared concentrations, as it ranged from inhibition zone diameters of 1.2 cm for the concentration of 32% ethylene against A. niger to inhibition zone diameters of 2.3 cm for the concentration of 44% ethylene against E. coli, Copolymers (II) possessed the highest observed antimicrobial activity in the present study against all the tested fungi and bacteria. Linear growth of C. albicans can be affected in a higher range by copolymers (III).
References
| [1] | Kenawy E., El-Newehy M. H., Abdel-Hay F. I., El-Shanshoury A. R. Synthesis and biocidal activity of modified poly (vinyl alcohol). Arab. J. Chem. 2014, 7, 355–361. |
| [2] | Kenawy E., Al-Deyab S.S., Shaker N.O., El-Sadek B.M., Khattab A.B., Synthesis and antimicrobial activity of metronidazole containing polymer and copolymers. J. Appl. Polym. Sci. 2009,113, 818-826. |
| [3] | Kenawy R., El-Shanshoury A.R., Shaker N.O., El-Sadek B., Khattab B., Badr E.B., Biocidal polymers: Synthesis, antimicrobial activity and possible toxicity of Poly (hydroxystyrene- co-methylmethacrylate) derivatives. J. Appl. Polym. Sci. 2011, 120, 2734-2742. |
| [4] | El-Newehy M.H., Alamri A. Al-Deyab S.S. Optimization of amine-terminated polyacrylonitrile: synthesis and characterization. Arabian J. Chem. 2012, 6, 111. |
| [5] | Mokwena K. K., Tang J., Ethylene Vinyl Alcohol: A Review of Barrier Properties for Packaging Shelf Stable Foods. Crit. Rev. Food. Sci. Nutr. 2012, 52:640–650. |
| [6] | Minimum Biofilm Inhibitory Concentration) Value for Different Antibiotics against E. coli. Int. J. Curr. Microbiol. App. Sci. 2015, 4(2), 198-224. |
| [7] | Kenawy R., Novel Aminated Chitosan-Aromatic Aldehydes Schiff Bases: Synthesis, Characterization and Bio-evaluation. Int. J. Adv. Res. 2015, 3(2), 563-572. |
| [8] | Kissinger, P. Laboratory Techniques in Electroanalytical Chemistry (2nd ed.), Harcourt Brace College Publishers, 1996. |
| [9] | Kim G-M., Asran A. S., Michler G. H., Simon P., and Kim J-S. Electrospun PVA/Hapnanocompositesnanofibers: biomimetics of mineralized hard tissues at a lower levelof complexity. Bioinspiration & Biomimetics. 2008, 3, 146-150. |
| [10] | William J. O., Geoffrey A. R., Nobes, Gregory M., Glenn, Gregory M. G., Syed I., and Chiou B-S. Blends of starch with ethylene vinyl alcohol copolymers: effect of water,glycerol and amino acids as plasticizers. Polymer Advanced Technology. 2007, 18(8), 629-635. |
| [11] | Jiang W., Qiao X., & Sun K. Mechanical and thermal properties of thermoplasticacetylated starch/polyethylene- co-vinyl alcohol) blends. Carbohydrate Polymers. 2006, 65, 139-143. |
| [12] | Usman M.S., ezzat M., Shameli Z.K., Salama N.Z., Ibrahim N.A. Synthesis characterization and antimicrobial properties of copper nanoparticles. I. J. Nanomed. 2013, 17, 4467-4479. |
| [13] | Ahmad M.B, Lim J.J, Tay M.Y., Shameli K., Ibrahim N.A. Synthesis of silver nanoparticles in chitosan, gelatin and chitosan/gelatin bionanocomposites by a chemical reducing agent and their characterizations. Mol. 2011, 16, 7237-7248. |
| [14] | Zhong Z., Aotegen B., Xu H. The influence of the different inductivity of acetyl phenyl-thiosemicarbazone-chitosan on antimicrobial activities. Int. J. Biol. Macromol. 2011, 48, 713–719. |
| [15] | Zhong Z., Aotegen B., Xu H., Zhao S. The influence of chemical structure on the antimicrobial activities of thiosemicarbazone-chitosan. Cell. 2014, 21, 105–114. |
| [16] | Je J.Y., Kim S. K. Chitosan derivatives killed bacteria by disrupting the outer and inner membrane. J. Agric Food Chem. 2006, 54, 6629–6633. |

 Abstract
 Reference
 Full-Text PDF
 Full-text HTML