-
Paper Information
- Paper Submission
-
Journal Information
- About This Journal
- Editorial Board
- Current Issue
- Archive
- Author Guidelines
- Contact Us
International Journal of Materials and Chemistry
p-ISSN: 2166-5346 e-ISSN: 2166-5354
2015; 5(6): 127-139
doi:10.5923/j.ijmc.20150506.02

In-Situ Synthesis of Mullite Fibers Reinforced Zircon-Zirconia Refractory Ceramic Composite from Clay Based Materials
 Abstract
 Reference
 Full-Text PDF
 Full-text HTML
F. O. Aramide1, 2, K. K. Alaneme1, 2, P. A. Olubambi3, J. O. Borode1, 2
1Department of Metallurgical and Materials Engineering, Federal University of Technology, Akure, Nigeria
2African Materials Science and Engineering Network, (AMSEN) a Subsidiary of Regional Initiative for Science Education (RISE)
3Applied Microscopy and Triboelectrochemical Research Laboratory, Department of Chemical and Metallurgical Engineering, Tshwane University of Technology, Pretoria, South Africa
Correspondence to: F. O. Aramide, Department of Metallurgical and Materials Engineering, Federal University of Technology, Akure, Nigeria.
| Email: |  |
Copyright © 2015 Scientific & Academic Publishing. All Rights Reserved.
This work is licensed under the Creative Commons Attribution International License (CC BY).
http://creativecommons.org/licenses/by/4.0/

Understanding the phase transformations/developments that result due to varying the production parameter of engineering materials is vital to development of new materials. The effects of yttria and niobium oxide on the phase changes and mechanical properties of mullite fiber reinforced zircon-zirconia ceramic composites produced by in-situ sintering of raw materials was investigated. Varied amounts of powder zirconia, yttria and niobium oxide were mixed in a turbula mixer with a fixed composition of clay (70% volume) of known mineralogical composition and mechanically milled in a planetary ball mill. The blended powders/clay were compacted into standard sample dimensions, and finally fired at 1400°C and held at varied time of one, two and three hours. The fired samples were characterized using ultra-high resolution field emission scanning electron microscope (UHR-FEGSEM) equipped with energy dispersive spectroscopy (EDX), and X-ray diffractometry (XRD). Various mechanical properties of the sintered samples were also investigated. It was observed that the investigated mechanical properties (with the exception of shrinkages) improved with the amount of raw zirconia initially used in the samples. It was also observed that addition of niobium oxide favours the formation polymignite phase, while the presence of both yttria and niobium oxide in the raw materials resulted in the formation of fergusonite phase in the samples. Both additives favour the phase transformation of zirconia from monoclinic to tetragonal and cubic phases even at temperature as low as 1400°C. It was concluded that the improved mechanical properties of the samples was due to strengthening by both mullite fibers reinforcement and phase transformation strengthening.
Keywords: Mullite, Zircon, Zirconia, Phase Transformation Strengthening, Ceramic Composite, Clay Based Materials, Oxides Additives
Cite this paper: F. O. Aramide, K. K. Alaneme, P. A. Olubambi, J. O. Borode, In-Situ Synthesis of Mullite Fibers Reinforced Zircon-Zirconia Refractory Ceramic Composite from Clay Based Materials, International Journal of Materials and Chemistry, Vol. 5 No. 6, 2015, pp. 127-139. doi: 10.5923/j.ijmc.20150506.02.
Article Outline
1. Introduction
- Refractories are high temperature resistant ceramics used in applications involving high temperatures and/or corrosive environment. They are critically important for the optimum performance of high temperature manufacturing processes among which are iron and steel making, glass and cement [1].Refractory materials development is instrumental to all the present day technological developments, without which all the innovations will be practically impossible [2, 3].Ceramic composite has been developed with the intention of improving on the mechanical properties the ceramic body. For instance, unreinforced ceramic fails catastrophically when subjected to around 0.1% tensile strain [4] but fiber reinforced ceramic (composites) could withstand more than 0.5% tensile strain.Furthermore, most ceramics (unreinforced) are characterized with low intrinsic fracture toughness which limit their roles in structural applications [5], for this reason ceramic are subjected to toughening processes in order to improve on their fracture toughness. The toughening of ceramic could be carried out either by phase-transformation toughening or by fiber synthesis (incorporation) within the ceramic matrix [6, 7].Monolithic ceramics have the disadvantage of being brittle. A reinforcing phase can improve the toughness of these materials, while still taking advantage of the matrix’s other properties such as wear resistance, hardness, corrosion resistance, and temperature resistance [8].Several researchers have worked elaborately on mullite-zirconia composites due to their superior thermo-mechanical properties [9-11]. The right choice of a matrix phase, incorporation of zirconia and the choice of optimum sintering parameter (i.e. sintering temperature, holding time and the amount of sintering additives) to form refractory ceramic composites with better strength and toughness has became widely recognized as a method for producing materials for engineering applications [12-16]. For instance ZrO2 in Al2O3, Si3N4, Mullite and MgAl2O4 have been reported to form composite systems that are effective in strengthening and toughening the ceramic matrix [17]. Fortunately, mullite and zirconia ceramics have high melting points and excellent resistance to acid and alkali, a large amount of them are now used as refractory for furnaces linings [18]. In order to improve the mechanical strength of these refractory ceramic materials many researchers have investigated the fabrication of (i) dense ceramics and/or (ii) composites with other materials [18].Mullite-zirconia composites can be manufactured via various methods such as sintering of mullite and zirconia, reaction sintering of alumina and zircon and reaction sintering of alumina, silica and zirconia. Some researchers also prepared mullite-zirconia by sol-gel and co-precipitation methods. This research work aims at synthesis and characterization of zircon-mullite-zirconia refractory ceramic composite from clay locally available in southwestern part of Nigeria.
2. Materials and Methods
2.1. Materials
- Clay Samples used in this work were sourced from Ipetumodu, Osun State in the south western part of Nigeria. High purity oxides such as zirconia and yttria were supplied by F.J. BODMANN & CO, L.L.C. (The Thermal Spray Materials and Technologies Source). Oakmere Business Park, 2072 Sussex Street, Harvey, LA 70058.
2.2. Raw Clay Preparation
- The clay samples were first soaked in water for three days to dissolve the deleterious materials in them and at the same time to form slurry. The slurries were then sieved to remove deleterious materials and other foreign substances. The sieved slurries were then allowed to settle down for three days after which the clear floating water was decanted. The dispersed fine clays in water (clay slurries) were then poured into plaster of Paris (P.O.P) moulds and left undisturbed for three days in order to allow the remaining water present to drain out completely. The resulting plastic clay masses were sun dried and subsequently dried in a laboratory oven at 110°C for 24 hours. The resulting dried clay samples were crushed and milled in a Rawwley Sussex grinder to an average particle size of 300µm.
2.3. Chemical and Mineralogical Composition of Raw Clay Samples
- The compounds present in the samples were determined by x-ray fluorescence (XRF). The results obtained are presented in Table 3. The mineralogical phases present in the samples were also determined using x-ray diffractometry (XRD). The phases present are reported in Figure 1 and Table 4. The chemical composition of the clay samples were determined using atomic absorption spectroscopy (AAS). The results obtained are presented in Table 5. Ultra-high resolution field emission scanning electron microscope (UHR-FEGSEM) equipped with energy dispersive spectroscopy (EDS) was used to examine the microstructure of the clay samples. The observed microstructures are presented in Figures 2 and 3.
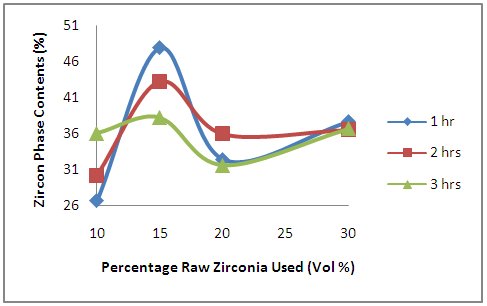 | Figure 1. Effects of Initial Raw Zirconia used on the amount of Zircon Phase in the Samples |
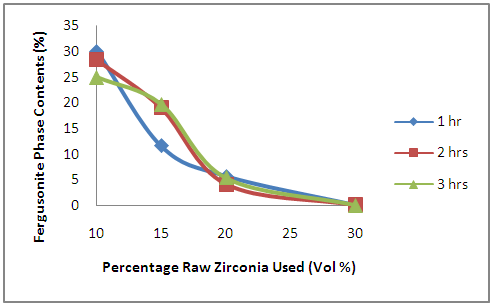 | Figure 2. Effects of Initial Raw Zirconia used on the amount of Fergusonite Phase in the Samples |
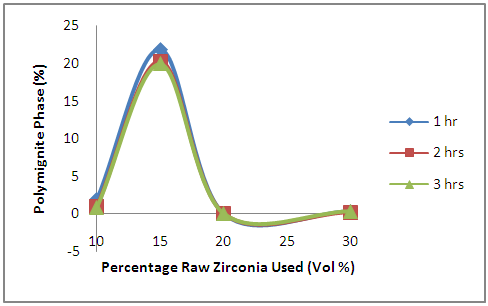 | Figure 3. Effects of Initial Raw Zirconia used on the amount of Polymignite Phase in the Samples |
2.4. Powder Blending
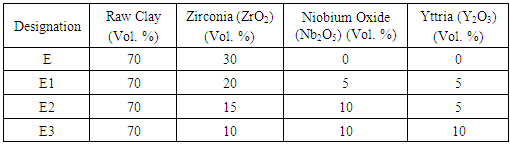
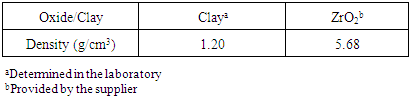
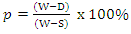
- The mass percent of the composition below was computed using Equations (1) and (2) using the densities in Table 2 and the individual powders volume fraction in each composition. The powders were weighed per batch of 50.00 g on a sensitive electronic weighing balance to five (5) decimal places. The individual (batch) composition was thoroughly mixed in a Turbula Mixer for 18 hours at a speed of 72 rev/min. The compositions of the blended samples were shown in Table 1.
|
 | (1) |
 | (2) |
|
2.5. Testing
2.5.1. Apparent Porosity
- Test samples from each of the ceramic composites were dried for 12 hours at 110°C. The dry weight of each fired sample was taken and recorded as D. Each sample was immersed in water for 6 hrs to soak and weighed while been suspended in air. The weight was recorded as W. Finally, the specimen was weighed when immersed in water. This was recorded as S. The apparent porosity was then calculated from the expression:
 | (3) |
2.5.2. Cold Compression Strength, Modulus of Elasticity and Absorbed Energy
- Cold compression strength test is to determine the compression strength to failure of each sample, an indication of its probable performance under load. The standard ceramic samples were dried in an oven at a temperature of 110°C, allowed to cool. The cold compression strength tests were performed on INSTRON 1195 at a fixed crosshead speed of 10mm min-1. Samples were prepared according to ASTM C133-97 (ASTM C133-97, 2003) and cold crushing strength, modulus of elasticity and absorbed energy of standard and conditioned samples were calculated from the equation:
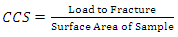 | (4) |
2.5.3. Bulk Density and Density
- The test specimens were dried at 110°C for 12 hours to ensure total water loss. Their dry weights were measured and recorded. The dimensions of the cold dried sintered samples were measured using Vernier calipers. From the measured dimensions, the volume (v) of the samples was computed. They were allowed to cool and then immersed in a beaker of water. Bubbles were observed as the pores in the specimens were filled with water. Their soaked weights were measured and recorded. They were then suspended in a beaker one after the other using a sling and their respective suspended weights were measured and recorded. Bulk densities of the samples were calculated using the formula below:
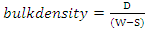 | (5) |
 | (6) |
2.6. Analysis
2.6.1. Qualitative and Quantitative XRD
- The samples were prepared for XRD analysis using a back loading preparation method. They were analysed using a PANalyticalX’Pert Pro powder diffractometer with X’Celerator detector and variable divergence- and receiving slits with Fe filtered Co-Kα radiation. The phases were identified using X’PertHighscore plus software. Graphical representations of the qualitative result follow below.The relative phase amounts (weight %) was estimated using the Rietveld method (Autoquan Program). Amorphous phases, if present were not taken into consideration in the quantification.
2.6.2. Scanning Electron Microscopy
- Morphology and microanalysis of the clay and composite samples were determined using ultra-high resolution field emission scanning electron microscope (UHR-FEGSEM) equipped with energy dispersive spectroscopy (EDS). The pulverized clay samples/sintered ceramic composite samples were previously gold coated. The samples were studied using ultra-high resolution field emission scanning electron microscope (UHR-FEGSEM) equipped with energy dispersive spectroscopy (EDS). Particle images were obtained with a secondary electron detector.
2.6.3. Chemical Analysis
2.6.3.1. X-Ray Fluorescence (XRF)
- The major elements were determined by X-ray fluorescence with an ARL® 9800 XP spectrometer. The pulverized clay samples were mixed with lithium tetraborate for chemical analysis. The ignition loss was measured by calcinations at 1000°C.
2.6.3.2. Atomic Absorption Spectroscopy (AAS)
- The chemical analysis of the clay samples was also carried out using atomic absorption spectrometry (AAS) method with Spectra AA 220 FS Machine.
3. Results and Discussion
3.1. Effects of Oxides Additives on the Phase Developments in the Sintered Ceramic Composite
- The results of the evolution of phases in the samples as a result of various percentages of oxides additives incorporated in the samples determined by XRD are presented in Figures 1 to 8. From these, it is observed that the increment in the amount of the oxides additives improved on the fusion temperatures of the samples. It is also observed that mullite fibers begin to develop in the samples at 1400°C which could not develop at lower temperature. It is also observed that phase transformation in the zirconia phases (at 1400°C) lead to the development of tetragonal (t-ZrO2) and cubic (c-ZrO2) zirconia phases in the samples.
3.1.1. Effects of Oxides Additives on the Development of Zircon Phase in the Ceramic Composite
- It is observed from Figure 1 that for all the samples considered, the amount of zircon formed initially increased with increased amount of zirconia used in preparing the sample. The zircon contents later reduced as the initial zirconia increased from 15% to 20%. With further increase in the initial zirconia, the amount of zircon formed slightly increased. This is because the silica content of the clay undergoes solid state reaction with the zirconia to form zircon as reported by Aramide et al. [19]. This solid state reaction takes place as long as there are silica phase in the clay content to react with the zirconia to form zircon. This explains why the amount of zircon formed increase with the amount of zirconia added to prepare the samples. It also explains why the zircon formed latter decrease as the zirconia used increased from 15% to 20% and latter 30%; it is because at this particular point, all the silica content of the samples have been consumed in the solid state reaction.
3.1.2. Effects of Oxides Additives on the Development of Fergusonite Phase in the Ceramic Composite
- Moreover, it is observed from Figure 2 that the amount of fergusonite phase formed decrease with increased amount of initial zirconia used in preparing the samples. Table 1 shows the percentage content of various component used in producing the samples. Comparing the Table 1 with Figure 2, it is observed that the amount of fergusonite in the sample reduces as the amount of niobium oxide and yttria used in producing the sample increase it can be postulated that the presence of niobium oxide and yttria aids the formation of fergusonite phase in the ceramic composite.
3.1.3. Effects of Oxides Additives on the Development of Polymignite Phase in the Ceramic Composite
- The effects of the oxides additives on the amount of the polymignite phase formed is revealed in Figure 3. From the figure, it is observed that the amount of polymignite formed initially increased as the amount of initial zirconia increased from 10% to 15%. Further increase in the amount of initial zirconia used in preparing the samples resulted into sharp reduction in the amount of polymignite formed in the samples. Comparing this Figure 3 with Table 1, it is observed that polymignite phase in the sample was negligible when there was none other additive in the sample except clay and zirconia. Reducing the zirconia component in the raw materials used in producing the samples to 20% while replacing it with 5% niobium oxide and 5 % yttria, the polymignite phase produced in the sample after sintering was still negligible. But increasing the niobium oxide component to 15% and at the same time reducing the zirconia component to 15% while holding the amount of other components constant (i.e, yttria at 5% and clay at 70%), the amount of polymignite phase produced in the sample after sintering increased sharply. Furthermore, increasing the amount of yttria to 10% while reducing the amount of zirconia component to 10% and niobium oxide to 10% (while clay remains at 70%), the amount of polymignite phase produced in the sample after sintering reduced sharply to less than 1%. It can be inferred that the addition of niobium oxide favours the formation of polymignite, while both niobium oxide and yttria favour the formation of fergusonite.
3.1.4. Effects of Oxides Additives on the Development of Monoclinic Zirconia Phase in the Ceramic Composite
- Figure 4 shows the effects of the oxides additives on the amount of monoclinic zirconia phase remaining in the samples. It is observed that the amount of the monoclinic zirconia in the samples initially reduced with increased initial zirconia used in preparing the samples. Further increase in the initial raw zirconia used in preparing the samples lead to sharp increase in the remnant monoclinic zirconia.
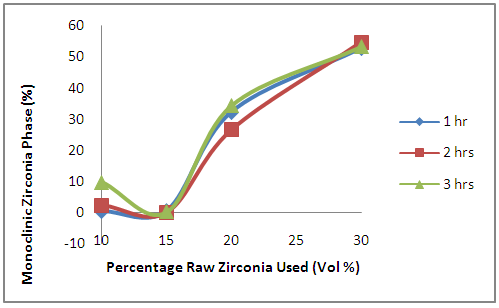 | Figure 4. Effects of Initial Raw Zirconia used on the amount of Monoclinic Zirconia Phase in the Samples |
3.1.5. Effects of Oxides Additives on the Development of Hematite Phase in the Ceramic Composite
- The effects of oxides additives on the hematite phase content of the sample is revealed in Figure 5. From the figure, it is observed that the hematite content of the samples (with the exception of the samples held for 1 hour) initially increased with increased initial zirconia used in preparing the samples. Further increase in the initial raw zirconia used in preparing the samples leads to progressive decrease in the hematite content in samples held for 3 hours. But for samples held for 1 hour, the hematite content reduced to 0% at 15% and 20% raw zirconia contents before increasing with further increase in the initial raw zirconia. While for the samples held for 2 hours, the hematite content reduced to 0% at 20% raw zirconia content before increasing with further increase in the initial raw zirconia. Generally, it could be inferred that the hematite content reduced with increased amount of zirconia. This could be explained from the fact that for the formation of mullite phase it has been stated the presence of Fe3+ is necessary [20]. This Fe3+ is seen in hematite which is being consume as the mullite is formed. This explain the reason for trend observed.
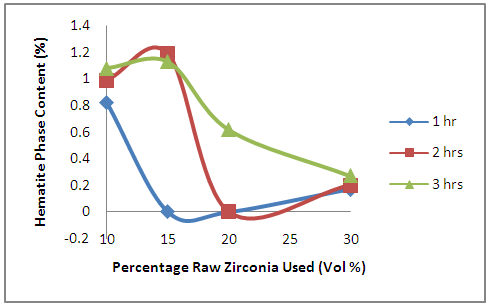 | Figure 5. Effects of Initial Raw Zirconia used on the amount of Hematite Phase in the Samples |
3.1.6. Effects of Oxides Additives on the Development of Mullite Phase in the Ceramic Composite
- The effects of oxides additives on the development of mullite phase in the ceramic samples is clearly depicted in Figure 6. From the figure, it is observed generally that the amount of mullite phase increases with the increased initial zirconia used in preparing the samples. From Table 1, it is observed that the samples contain 70% volume of Ipetumodu clay while the balance is the various oxide additives.
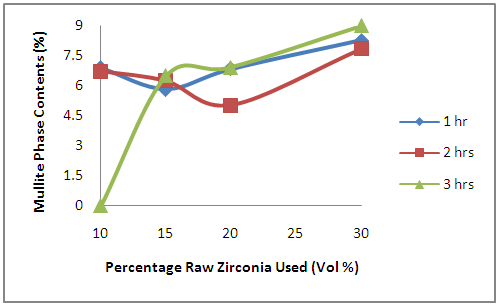 | Figure 6. Effects of Initial Raw Zirconia used on the amount of Mullite Phase in the Samples |
3.1.7. Effects of Oxides Additives on the Development of Cubic and Tetragonal Zirconia Phase in the Ceramic Composite
- Figures 7 and 8 show the effects of oxides additives on the stabilization of high temperature phases of zirconia in the ceramic samples. Figure 7 showed that the tetragonal zirconia initially increased with the increased initial zirconia used in preparing the samples. It reached its peak at 20% initial zirconia used in preparing the samples, thereafter reduced with further increase in initial zirconia used in preparing the samples. Comparing this Figure 7 with Table 1, it will be noted that reducing the amount of yttria used in the samples by 5% and replacing it with an increment of 5% in the amount of zirconia used (i.e. increasing the zirconia used to 15% from 10%) leads to increment in the amount of tetragonal zirconia developed in the samples. Further increasing the amount of initial raw zirconia used in preparing the samples to 20% and reducing the amount of niobium oxide used to 5% leads to further increase in the amount of tetragonal zirconia developed in the samples which reach its peak at 20% raw zirconia used to prepare the samples. Further increased in the amount of initial raw zirconia used to prepare the samples leads to sharp reduction in the amount of tetragonal zirconia developed in the samples to less than 1%.
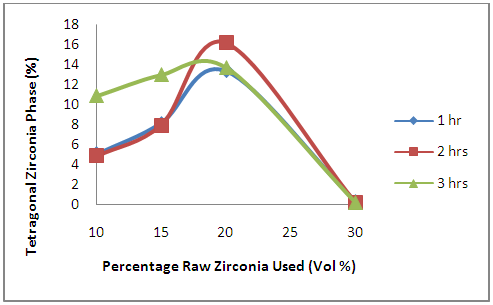 | Figure 7. Effects of Initial Raw Zirconia used on the amount of Tetragonal Zirconia Phase in the Samples |
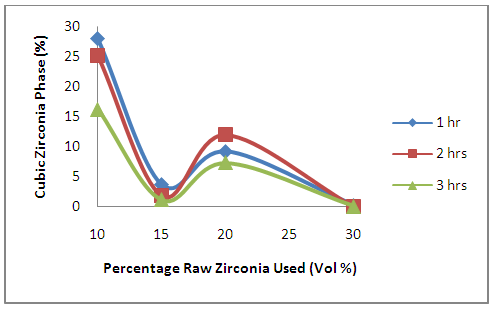 | Figure 8. Effects of Initial Raw Zirconia used on the amount of Cubic Zirconia Phase in the Samples |
3.2. Effects of Soaking Time on the Phase Developments in the Sintered Ceramic Samples
- In Figures 1 to 8, the legends in each of the figures depict the effects of soaking time at the sintering temperature on the phase development in the various ceramic samples. The effects of soaking time on the phase developments follow the same trend in all the figures. It is observed that varied soaking time at the sintering temperature does not show much/significant effects on the phase development in the ceramic samples.
3.3. Effects of Oxides Additives on the Physical and Mechanical Properties of the Sintered Ceramic Composite
- Figures 9 to 14 show the effects of the oxides additives on various physical and mechanical properties of the sintered ceramic composites
3.3.1. Effects of Oxides Additives on the Percentage Shrinkages of the Sintered Ceramic Composites
- It is observed from Figure 9 that the shrinkage of the samples increased with increase in the amount of raw zirconia used in preparing the sample. This is because as the amount of the initial raw zirconia used in preparing the samples increases, the amount of other oxide additives (i.e yttria and niobium oxide) used reduce which could help to stabilize the higher temperature phases (t-ZrO2 and c-ZrO2). The volumetric changes on cooling associated with transformation are substantial enough to make the pure material unsuitable for applications requiring an intact solid structure: c→t approximately 2.31% [27]; t→m approximately 3-5% [28]. This is the reason for the observed increase in the shrinkage as the amount of zirconia used in the prepari8ng the samples increased. From the figure, the effect of sintering temperature on the shrinkage in the samples is also observed. It could be stated generally that the shrinkage reduce with soaking time at the sintering temperature.
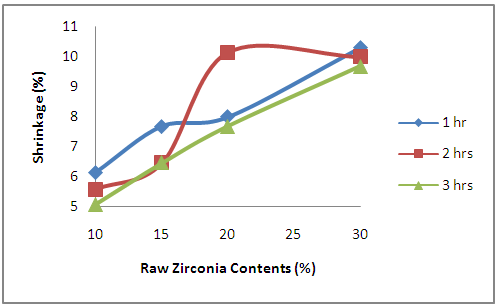 | Figure 9. Effects of Zirconia Contents on the Percentage Shrinkage |
3.3.2. Effects of Oxides Additives on the Density of the Sintered Ceramic Composites
- From Figure 10, it is observed that for samples soaked for 1 hour at the sintering temperature the density of the sample initially decreased with increased raw zirconia content with the minimum point being at 20% raw zirconia content, further increase in the raw zirconia content lead to increased density. While for the other two soaking time, the density of the samples increased with increased raw zirconia content. Moreover, the effect of soaking time at the sintering temperature is clearly depicted. From the figure it is observed for the samples with 30% that the density increases with increase in soaking time. This implies increased soaking time allows the sample to densify further at the sintering temperature resulting in the increase in the density. For other samples, it is observed that the densities of the samples increased as the soaking time at the sintering temperature increased from 1 hour to 2 hour. Further increase in the soaking time to 3 hour resulted into decrease in the densities of the samples. Considering Table 1, it is observed that the sample at 30% zirconia contents have no other additive, while others contain other additives (yttria and niobium oxide).
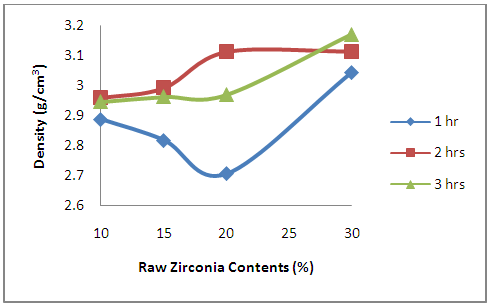 | Figure 10. Effects of Zirconia Contents on the Density of the Sintered Samples |
3.3.3. Effects of Oxides Additives on the Cold Crushing Strength of the Sintered Ceramic Composites
- Figure 11 depicts the effects of oxides additives on the cold crushing strength (ccs) of the sintered ceramic composite samples. From the figure, it is observed broadly that the ccs of the samples increased with the increased in the amount of initial zirconia used in producing the samples. This could be attributed to the phases developed in the samples as result of the oxide additives in the samples. From Table 1 and Figures 2 and 3, it is observed that the amounts of other additives like yttria and niobium oxides reduced with increase in the amount of initial zirconia used to prepare the samples; this leads to the development of some other highly brittle phases like fergusonite and polymignite. Figure 2 showed that the amount of fergusonite in the samples reduced with increased amount of initial zirconia used in producing the samples. It will be observed that these phases (fergusonite and polymignite) are only present in traces in the sample produced with 30% initial zirconia. Moreover, the amount of mullite developed in the samples is observed to increase with increased initial zirconia (Figure 6).
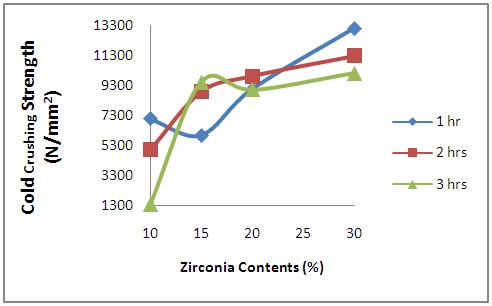 | Figure 11. Effects of Zirconia Contents on the Cold Crushing Strength of the Sintered Samples |
3.3.4. Effects of Oxides Additives on the Young’s Modulus of the Sintered Ceramic Composites
- Figure 12 depicts the effects of oxides additives on the Young’s Modulus (E) of the sintered ceramic composite samples. From the figure, it is observed broadly that the Young’s Modulus of the samples increased with the increase in the raw zirconia used in preparing the samples. This implies that the stiffness or resistance to deformation under elastic load of the samples increased with increase in the amount of raw zirconia used in preparing the samples. This because Young’s Modulus of a material is a measure of its stiffness; resistance to deform elastically under load [21, 33, 34], Moreover, for samples with 10% raw zirconia (10% niobium oxide and 10% yttria) it is observed that the Young’s Modulus reduced with increase in the soaking time. While on the other hand, for the samples with 15% raw zirconia (10% niobium oxide and 5% yttria) it is observed that the Young’s Modulus of the samples increased with soaking time.
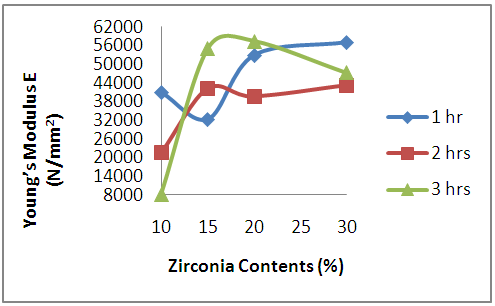 | Figure 12. Effects of Zirconia Contents on the Young's Modulus of the Sintered Samples |
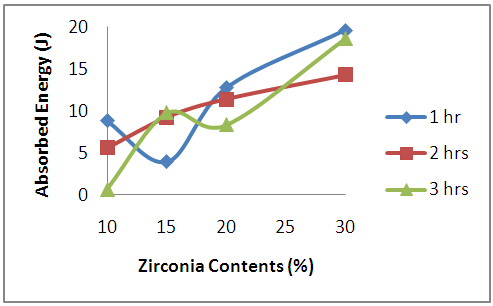 | Figure13. Effects of Zirconia Contents on the Absorbed Energy of the Sintered Samples |
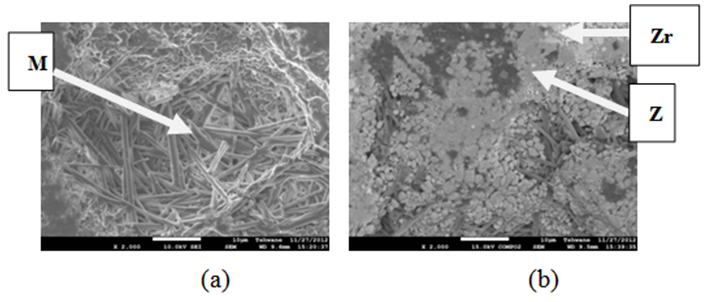
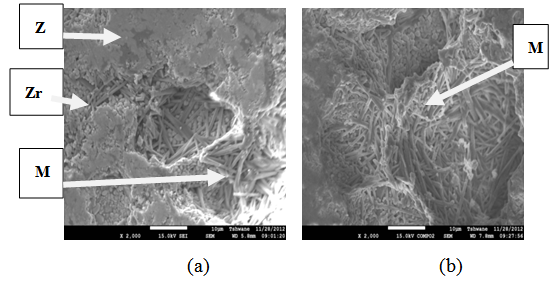 | Figure 14. Showing the Secondary Electron Image of Sample E sintered at 1400°C and held for 1 hour: (a) SEM Image, (b) Back Scatter Image. Z = Zircon phase, Zr = Zirconia phase, M = Mullite phase |
 | Figure 15. Showing the Secondary Electron Image of Sample E sintered at 1400°C and held for 2 hours: (a) SEM Image, (b) Back Scatter Image. Z = Zircon phase, Zr = Zirconia phase, M = Mullite phase |
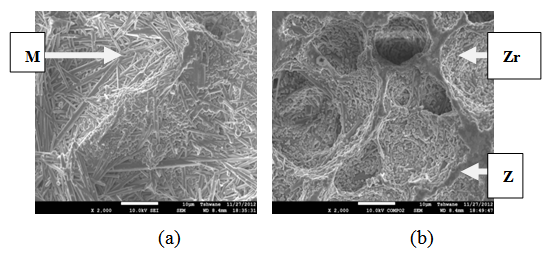
 | Figure 16. Showing the Secondary Electron Image of Sample E sintered at 1400°C and held for 3 hours: (a) SEM Image, (b) Back Scatter Image. Z = Zircon phase, Zr = Zirconia phase, M = Mullite phase |
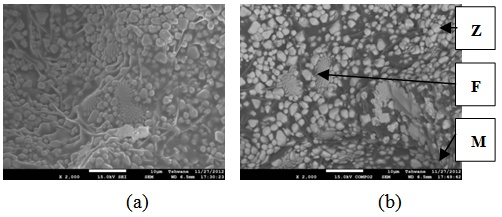
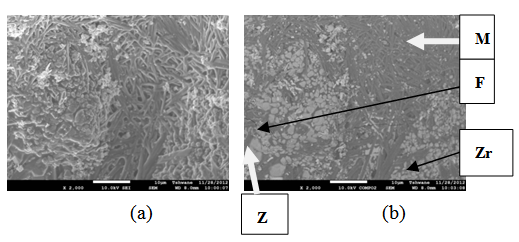 | Figure 17. Showing the Secondary Electron Image of Sample E1 sintered at 1400°C and held for 1 hour: (a) SEM Image, (b) Back Scatter Image. Z = Zircon phase, Zr = Zirconia phase, M = Mullite phase, F = Fergusonite |
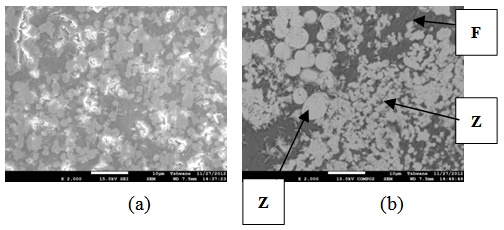
 | Figure 18. Showing the Secondary Electron Image of Sample E1 sintered at 1400°C and held for 2 hours: (a) SEM Image, (b) Back Scatter Image. Z = Zircon phase, Zr = Zirconia phase, M = Mullite phase, F = Fergusonite |
 | Figure 19. Showing the Secondary Electron Image of Sample E1 sintered at 1400°C and held for 3 hours: (a) SEM Image, (b) Back Scatter Image. Z = Zircon phase, Zr = Zirconia phase, M = Mullite phase, F = Fergusonite |
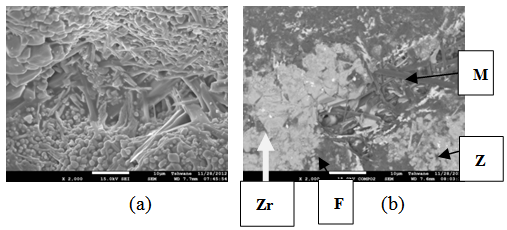
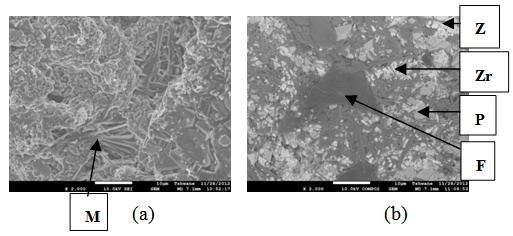 | Figure 20. Showing the Secondary Electron Image of Sample E2T3-1: (a) SEM Image, (b) Back Scatter Image. Z = Zircon phase, Zr = Zirconia phase, M = Mullite phase, F = Fergusonite, P = Polymignite |
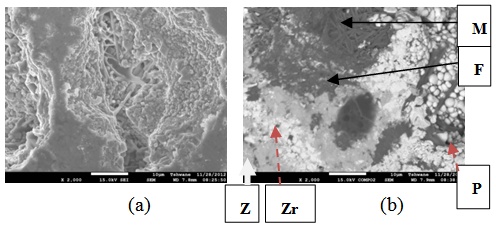 | Figure 21. Showing the Secondary Electron Image of Sample E2 sintered at 1400°C and held for 2 hours: (a) SEM Image, (b) Back Scatter Image. Z = Zircon phase, Zr = Zirconia phase, M = Mullite phase, F = Fergusonite, P = Polymignite |
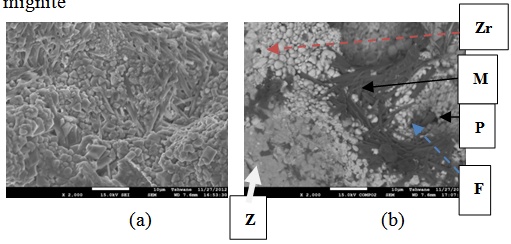 | Figure 22. Showing the Secondary Electron Image of Sample E2 sintered at 1400°C and held for 3 hours: (a) SEM Image, (b) Back Scatter Image. Z = Zircon phase, Zr = Zirconia phase, M = Mullite phase, F = Fergusonite, P = Polymignite |
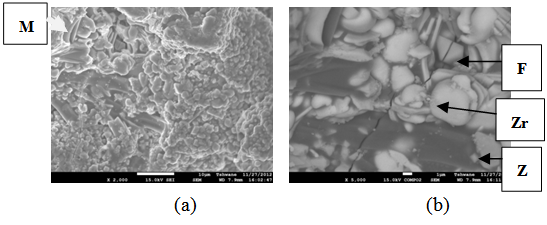
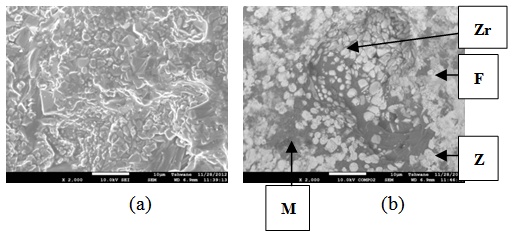 | Figure 23. Showing the Secondary Electron Image of Sample E3 sintered at 1400°C and held for 1 hour: (a) SEM Image, (b) Back Scatter Image.Z = Zircon phase, Zr = Zirconia phase, M = Mullite phase, F = Fergusonite |
 | Figure 24. Showing the Secondary Electron Image of Sample E3 sintered at 1400°C and held for 2 hours: (a) SEM Image, (b) Back Scatter Image. Zr = Zirconia phase, M = Mullite phase, F = Fergusonite |
 | Figure 25. Showing the Secondary Electron Image of Sample E3 sintered at 1400°C and held for 3 hours: (a) SEM Image, (b) Back Scatter Image.Z = Zircon phase, Zr = Zirconia phase, F = Fergusonite |
4. Conclusions
- From the discussion above it is concluded that the;• addition of zirconia aids the solid state reaction between zirconia and silica at high temperature to form zircon;• addition of yttria and niobium oxide aids the formation of fergusonite phase in the sample;• addition of niobium oxide favours the formation of polymignite phase while the addition of yttria suppressed its formation;• addition of zirconia aids the formation of mullite phase in the ceramic composite sample;• addition of yttria stabilizes the high temperature phases of zirconia while excess niobium oxide suppresses the formation of these high temperature phases;• density, shrinkage, cold crushing strength, Young’s modulus of elasticity and absorbed energy of the samples increased with the amount of raw zirconia used content;• the sample with 30% zirconia, 70% Ipetumodu clay is deemed to posses the best physical and mechanical property.
ACKNOWLEDGEMENTS
- The authors wish to acknowledge the following organizations for their support. They are; Regional Initiative in Science Education (RISE), Science Initiative Group (SIG) and African Materials Science and Engineering Network (AMSEN).