-
Paper Information
- Next Paper
- Paper Submission
-
Journal Information
- About This Journal
- Editorial Board
- Current Issue
- Archive
- Author Guidelines
- Contact Us
International Journal of Materials and Chemistry
p-ISSN: 2166-5346 e-ISSN: 2166-5354
2014; 4(4): 88-91
doi:10.5923/j.ijmc.20140404.02
Analyzing 2D Structure Images of Piezoelectric Ceramics Using ImageJ
 Abstract
 Reference
 Full-Text PDF
 Full-text HTML
Dang Anh Tuan, Vo Thanh Tung, Le Van Phuong
Hue University’s College of Sciences, Hue city, Vietnam
Correspondence to: Dang Anh Tuan, Hue University’s College of Sciences, Hue city, Vietnam.
| Email: |  |
Copyright © 2014 Scientific & Academic Publishing. All Rights Reserved.
An image analysis processing method for the measurement of structure of piezoelectric ceramics from 2D SEM images using ImageJ program is studied. Lots of parameter of structure was mentioned in ImageJ, however in this study, we concentrate on studying the particle size distribution and shape analyzing. The results show that the developed method can be used as a practical tool to estimate the physic structure of materials.
Keywords: ImageJ, Piezoelctric ceramics, 2D structure
Cite this paper: Dang Anh Tuan, Vo Thanh Tung, Le Van Phuong, Analyzing 2D Structure Images of Piezoelectric Ceramics Using ImageJ, International Journal of Materials and Chemistry, Vol. 4 No. 4, 2014, pp. 88-91. doi: 10.5923/j.ijmc.20140404.02.
Article Outline
1. Introduction
- After discovered at 1950, lead zirconate titanate [Pb(Zr,Ti)O3; PZT] ceramics have enormously been studied because of their excellent piezoelectric properties. To date lots new piezoelectric materials are researched and widely used for various applications such as actuators, sensors, sonar transducers, accelerometers, resonator, frequency control devices, filters [1-5] and etc.In order to analyze and evaluate the preeminent properties of the new materials, some parameters of the structure of the materials are proposed for research. The particle size and measuring particle size distributions is one of the most important structural characteristics relating to process efficiency, and material quality. In addition, measuring particle size distributions and understanding how they affect the properties of materials can be critical to the success of many manufacturing businesses. However, the extremely small boundary between the particles and random orientation make the measurement of their size very difficult. Last decade has seen the development of major microscopic techniques such as electron microscopy, scanning probe microscopes and etc. in structure research of materials. These techniques enable a better resolution but also permit to obtain true data [6-9]. Parallel to this process, numerous commercial software exist such as Amira, Comsol Multiphysiscs, LINCE etc. allow performing the 2D structure images and providing the processing and analysis features [10-13, 16]. However the programming is not possible in an easy way as well as its copyright.The present paper describes an investigation of the 2D structure analyzing from SEM image using ImageJ program [14, 15]. Depending on the requisition of research, some or lots of parameters of materials could be studied, e.g. surface area, particle size, etc. However, in this study, we concentrate on two of the most significant properties and necessary in measuring - particle size distribution and shape analyzing. The type of piezoelectric materials chosen for research was Pb-free piezoelectric materials (Ba0.7Ca0.3)TiO3-0.48Ba(Zr0.2Ti0.8)O3 (48BZT-BCT).
2. Sample Description and Image Analysis Processing with ImageJ
- A conventional ceramics fabrication technique was used to prepare Pb-free ceramics (Ba0.7Ca0.3)TiO3-0.48Ba(Zr0.2Ti0.8)O3. The raw materials with high purity (> 99%) of BaCO3, CaCO3, ZrO2, TiO2 were weighed and mixed in a centrifugal mill, as well as wet-homogenized with ethanol for 20h. The obtained powders were dried in an oven and then calcined at 1250℃ for 3h. The mixtures were ball-milled in ethanol for 20h, then dried. After the second milling, the obtained powders were pressed into disks specimens with a diameter of 12mm and a thickness of 1.2 mm only by uniaxial pressing with a pressure of 100MPa. Sintering was carried out at the temperature of 1450℃ for 4h. Sintered samples after chemically-etching were cleaned by ultrasonic cleaner. Surface microstructure was observed by scanning electron microscopy (SEM, JSM-5610LV, JEOL, Japan) (Fig. 2(a)).Figure 1 shows a flow chart of the image analysis process developed within ImageJ. The analysis was carried out in two steps. In the first step, the measure scale is set that is suitable with the 2D SEM image. Furthermore the detail and required measurements are set up in this step. In the second step, the boundaries of each grain on the image were detected. The boundary can easily be detected from binary images or other types, which were obtained from the thresholded SEM images. However the particle boundaries at particle-to-particle cross-over area are difficult to be identified from the SEM image. So the other thresholding methods in the analyzing tool of ImageJ are applied for separating easily the each particle boundary at the particle-to-particle cross-over areas.
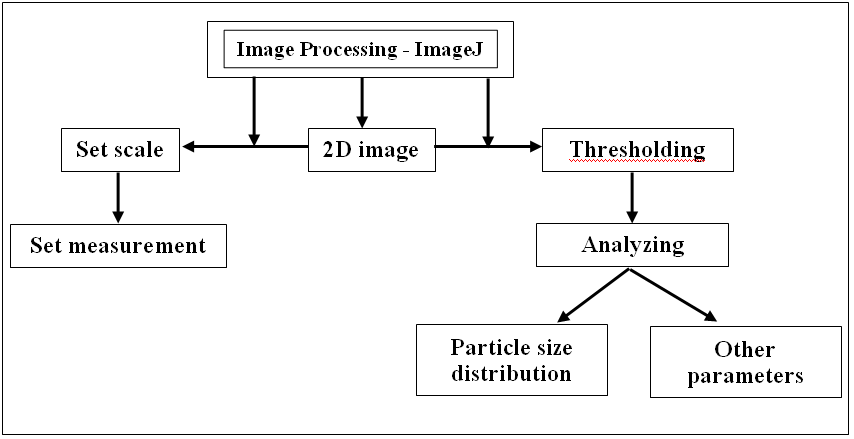 | Figure 1. Flowchart of the image process |
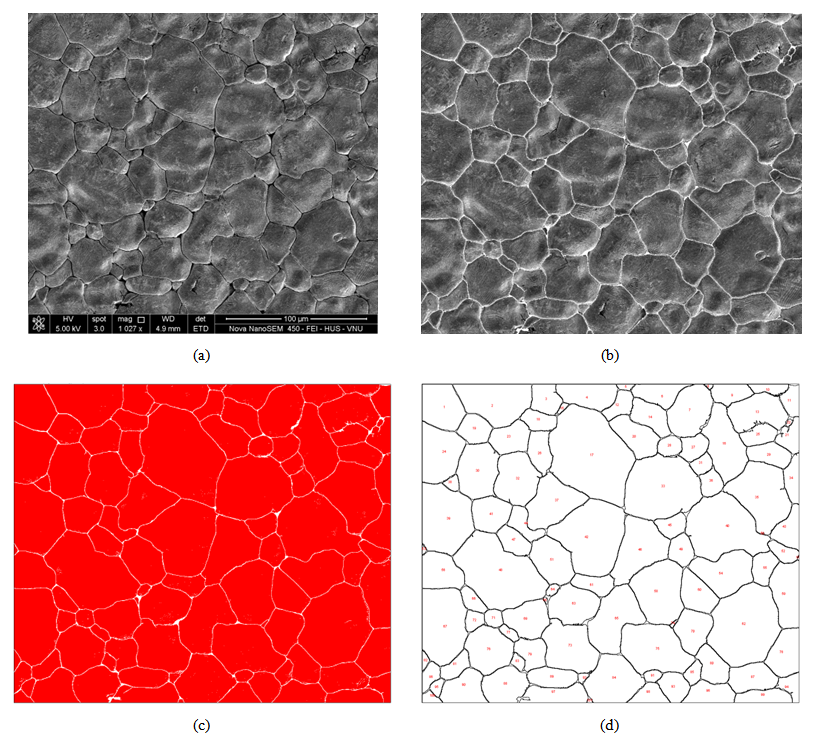 | Figure 2. Processed images by the image analysis (using ImageJ) (a) origin image – SEM image (b) processing and threshold image (c) threshold color image after eliminated noise (d) result of particle distribution (using Analyze tool in ImageJ) |
- By using the Analyze particle tool, it will automatically identify and count the number of particles in the image (Fig. 2(d)). Furthermore the results of ImageJ analyzing were then compared to the other software (such as Lince program [16]) and estimated a percent difference.
3. Results and Discussion
- Some of the most important features of simulation is that it allows several structural characteristics such as diameter, area etc. of particles to be defined using algorithms in ImageJ. However, in this study, four parameters including area, perimeter, Feret’s diameter and shape descriptors (circularity) are interested for estimating the structure of materials. Note that, Feret’s diameter is the longest distance between any two points along the selection boundary; circularity is a value to indicate a perfect circle of particles: a value of 1.0 indicates a perfect circle, the value approaches 0, it indicates an increasingly elongated shape. Furthermore the processing results present the calculated probability density of particles according to these parameters.Figure 3 (a, b) show the results of area and perimeter distribution and Gauss fitting plots of the defined particles from Fig. 2(d). Using the simulation tools in ImageJ, there can be up to high accuracy resulting in all measurement in calculating area and perimeter of grains of 2D structure images. Furthermore, from these results, grain surface area and perimeter distributions in analyzing 2D structure image are shown in Fig. 3 (a, b).
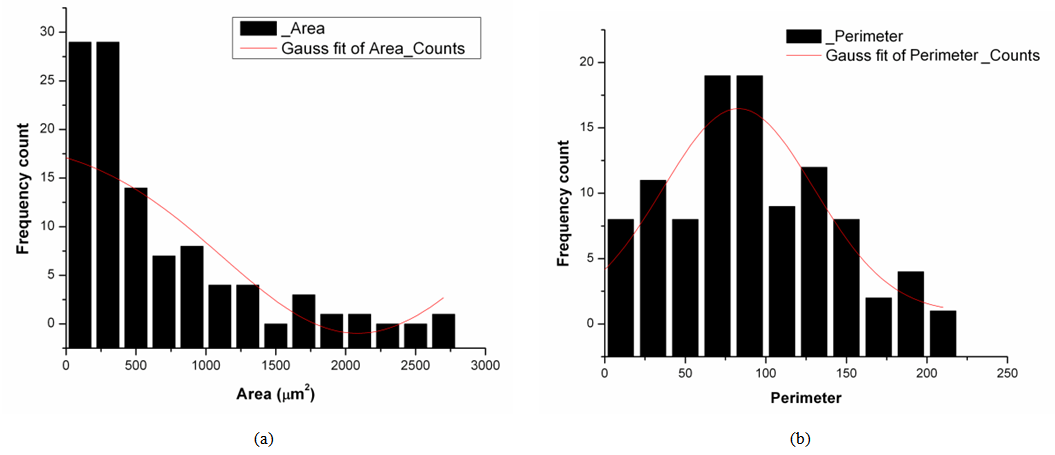 | Figure 3. Distribution of (a) area and (b) perimeter abtained by ImageJ program |
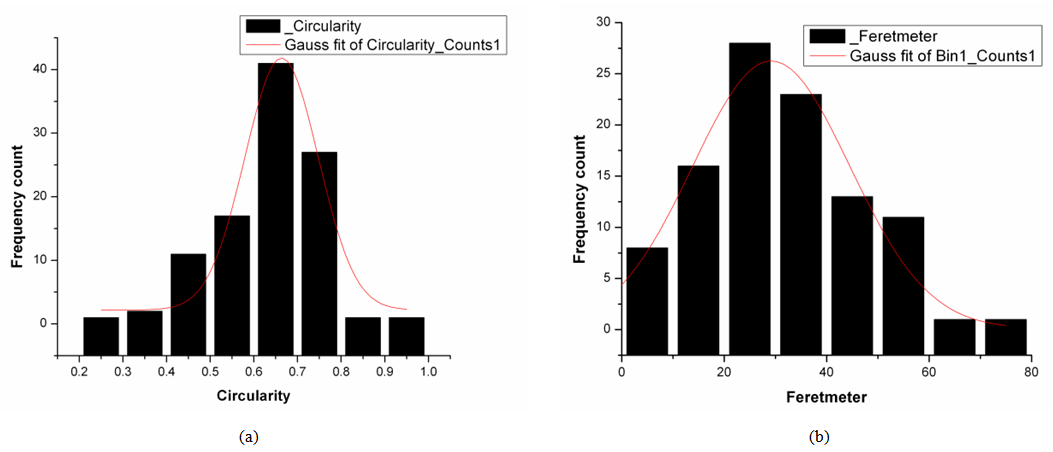 | Figure 4. Distribution of (a) circularity and (b) Feret’s diameter obtained by ImageJ program |
|
4. Conclusions
- In summary, the studied method for analyzing 2D structure image using ImageJ program was successfully developed. The results show the effectiveness of this method for structural characteristics measurement, such as area, diameter, diameter distribution etc. The method is automated, accurate, and much faster than other before method and has the capability of estimating simultaneously lots of parameters. Furthermore, it asserts that the studied method by ImageJ program can be used as a practical tool to estimate the physics structure of piezoelectric materials.
ACKNOWLEDGEMENTS
- The work was carried out in the frame of the “Basic Project of Hue University 2013-2015”.