-
Paper Information
- Paper Submission
-
Journal Information
- About This Journal
- Editorial Board
- Current Issue
- Archive
- Author Guidelines
- Contact Us
International Journal of Materials and Chemistry
p-ISSN: 2166-5346 e-ISSN: 2166-5354
2014; 4(2): 15-26
doi:10.5923/j.ijmc.20140402.01
Influence of Amount of Silver on the Structural and Optical Properties of TiO2 Powder Obtained by Sol-Gel Method
 Abstract
 Reference
 Full-Text PDF
 Full-text HTML
Agnieszka Hreniak , Andrzej Sikora , Agnieszka Iwan
Electrotechnical Institute, Division of Electrotechnology and Materials Science, M. Sklodowskiej-Curie 55/61 Street, 50-369 Wroclaw, Poland
Correspondence to: Agnieszka Iwan , Electrotechnical Institute, Division of Electrotechnology and Materials Science, M. Sklodowskiej-Curie 55/61 Street, 50-369 Wroclaw, Poland.
| Email: |  |
Copyright © 2012 Scientific & Academic Publishing. All Rights Reserved.
In this paper five TiO2 powders prepared by sol-gel technique were analyzed being into consideration the modification of method of synthesis applied. As a precursors titanium (IV) buthoxide (TBOT) or titanium (IV) isopropoxide (TIPO) were used. The size of obtained pure TiO2 particles (called in paper TiO2-1 ÷ TiO2-5) was in the range 80-300 nm as it was confirmed by XRD, SEM and AFM techniques. Ag doped TiO2 (abbreviated herein as TiO2-2-Ag-y) was obtained using two methods of synthesis, where different amount of silver was added (1, 5 or 10% w/w). Additionally, the influence of method of the synthesis applied and amount of silver on the UV-vis properties of TiO2 was analyzed.
Keywords: TiO2, Nanoparticles, Ag doped TiO2
Cite this paper: Agnieszka Hreniak , Andrzej Sikora , Agnieszka Iwan , Influence of Amount of Silver on the Structural and Optical Properties of TiO2 Powder Obtained by Sol-Gel Method, International Journal of Materials and Chemistry, Vol. 4 No. 2, 2014, pp. 15-26. doi: 10.5923/j.ijmc.20140402.01.
Article Outline
1. Introduction
- Titanium dioxide (TiO2), an example of metal-oxide type semiconductors, has been broadly studied and widely used in different applications such as a photocatalytic material for self-cleaning coatings, environmental purifiers, antifogging mirrors and many others [1, 2]. Being into consideration practical application of TiO2, a lot of work is also dedicated obtained titania with different ions [1, 3-9]. As the sub-micrometer size TiO2 powders are promising materials, further investigations are desired, with the tools providing reliable and complex high-resolution information about observed objects. Therefore, atomic force microscopy (AFM) along with scanning electron microscopy (SEM) [10-12] and transmission electron microscopy (TEM) [13-15] becomes an important diagnostic instrument allowing obtain the information about electrical, magnetic and thermal properties of such a small objects [16-19]. It should be underlined, that due to wide range of measurement conditions such as: temperature, environment, magnetic field in connection to very simple preparation procedure [20-21] AFM has become very popular among researches worldwide. As it provides quantitative topography information, one can extract the particle size data, however the influence of the shape of the scanning tip should be taken into account [22, 23]. Moreover, the shape of the grains may be a source of useful information. Additionally, direct tip-sample contact in both: contact and intermittent contact modes as well as various derived techniques, may be used in determination and mapping of the mechanical properties of investigated material [24-26]. The main goal of this work was investigation influence of amount of silver on the structural and optical properties of TiO2 powder via XRD, SEM, AFM and UV-vis methods. A special emphasize was put to investigated obtained titania powders via AFM technique.
2. Materials and Methods
2.1. Materials
- Titanium(IV) buthoxide (TBOT) (99+%) and titanium(IV) isopropoxide (TIPO) (99+%) were purchased from Alfa Aesar. Ethanol (96%), isopropyl alcohol, silver nitrate AgNO3 was purchased from POCh Gliwice.
2.2. TiO2 Powder Synthesis
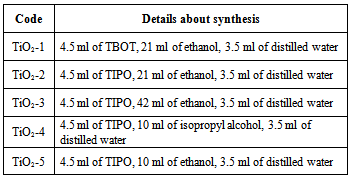
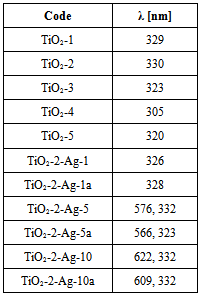
- TiO2 powders were prepared by sol-gel method using as titanium precursor titanium(IV) buthoxide (TBOT) or titanium(IV) isopropoxide (TIPO). Titanium precursor was dissolved in ethanol (or isopropyl alcohol) mixed with 3.5 ml of distilled water yielding a titania sol. The solution was stirred in a plastic flask at room temperature for 4 h. During the stirring the titania powder was formed and after filtering was dried at room temperature. The TiO2 powder was heated at 500℃ for one hour. Details about synthesis of TiO2 are presented in Table 1.
|
2.3. Ag Doped TiO2 Powder
- Titania doped with silver were obtained by using two methods of synthesis: TiO2-Ag-y and TiO2-Ag-ya. In both cases such components as TIPO, ethanol, and distilled water were applied and stirred during 4 hours. Differences in both methods of synthesis were in the time and order to added AgNO3 to the mixture. To obtain TiO2-Ag-y AgNO3 was stirred four hours along with other components, while in the case of TiO2-Ag-ya AgNO3 was added to sol mixture and stirred only 2 hours. Details of the titania-silver synthesis are presented below. TiO2-2-Ag-y: TiO2-2-Ag powder was prepared by sol-gel method using as titanium precursor titanium(IV) isopropoxide (TIPO). Titanium precursor was dissolved in ethanol. Briefly, 4.5 ml of TIPO and 21 ml of ethanol were mixed with 3.5 ml of distilled water and addition of silver nitrate AgNO3 to the obtaining sol with the molar ratio Ag/TIPO equal 1%, 5%, 10% (abbreviated herein as TiO2-2-Ag-1, TiO2-2-Ag-5, TiO2-2-Ag-10). The solution was stirred in a plastic flask at room temperature for 4 h. During the stirring the titania powder was formed and after filtering was dried at room temperature. The TiO2-2-Ag powder was heated at 500℃ for one hour.TiO2-2-Ag-ya: TiO2: Ag-ya powder was prepared by sol-gel method using as titanium precursor titanium(IV) isopropoxide (TIPO). Titanium precursor was dissolved in ethanol. Briefly, 4.5 ml of TIPO and 21 ml of ethanol were mixed with 3.5 ml of distilled water yielding a titania sol. The solution was stirred in a plastic flask at room temperature for 2 h. Next addition of silver nitrate AgNO3 to the obtaining sol with the molar ratio Ag/TIPO equal 1%, 5%, 10% (abbreviated herein as TiO2-2-Ag-1a, TiO2-2-Ag-5a, TiO2-2-Ag-10a) and mixed for 2h. During the stirring the titania powder was formed and after filtering was dried at room temperature. The TiO2 -2-Ag- ya powder was heated at 500℃ for one hour.
2.4. Preparation TiO2 Samples on the Glass Substrate
- In order to perform the AFM measurements of the TiO2 powders, the microscope glass was used as the substrate. The surface of the glass was covered with cyanoacrylate glue and left for few second for preliminary cure. A small quantity of the powder was carefully placed on the surface of the substrate and left for few minutes to cure the glue. Afterwards, the weakly attached grains of the powder were removed using pressured air, in order to avoid them to stick to the scanning tip. Such an approach allows obtain small agglomerates and single grains on the surface.
2.5. Methods
- X-ray diffraction patterns were recorded using powder on a Pulveraceous diffractometer Dron – 2. Co radiation filtrated by Fe was applied. Scanning electron microscopy (SEM) studies were performed with a tungsten cathode Vega II SBH (TESCAN) to examine the morphology of the TiO2. UV-vis spectra were recorded as films from chloroform solution casted on the glass substrate by using Jasco V670 spectrophotometer. Atomic force microscopy (AFM) measurements were performed with Innova system from Bruker (formerly Veeco) in air, at temperature 23℃ and humidity 35% RH. Two modes were used: intermittent contact (IC-AFM) with phase imaging (PI) feature and force modulation mode (FMM). Both modes deliver morphological information about the surface of the sample. The phase feature imaging allows create a map of the tip-sample energy dissipation as the distance between them changes periodically. The energy dissipation is a complex response and may contain various components related to the surface stiffness, adhesion, presence of electrostatic field and others [27-31]. In order to provide more reliable information source, the force modulation mode derived from contact technique was used. It allows create the stiffness map of the surface[32,33]. The intermittent contact mode measurements were performed using standard MPP-11120 probes from Bruker (k=40 n/m, fres=300 kHz, rtip=8 nm), FMM mode measurements on the other hand were performed using MPP-31100 probes from Bruker (k=0.9 N/m, fres=20 kHz, rtip=8 nm). The scanning speed in both modes was applied at the level 0.2 Hz, providing good surface tracking with minimized risk of the particles attachment to the tip. The data was processed with SPIP software from Image Metrology. In order to provide better readability of the topography images, the Sobel transform data was additionally presented, as it reveals presence of fine structures and was successfully utilized in other papers [34-36].Zeta potentials of nanoparticles were determined using analyzer Zetasizer Nano ZS Malvern Instruments. In 20 ml H2O 0.01 g TiO2 was put. The pH of suspensions was adjusted using 0.1 M HCl or 0.1 M NaOH.
3. Results and Discussion
3.1. Characteristic of TiO2
3.1.1. X-ray diffraction, SEM and UV-vis
- X-ray diffraction and scanning electron microscopy (SEM) were used to analyze the titania. The X-ray spectra of the both TiO2 powders (TiO2-1 ÷ TiO2-5) annealed at 500℃ shows the same diffraction pattern characteristic to anatase crystalline phase (see Fig. 1a). A major peak corresponding to (101) reflections of the anatase phase of TiO2 was apparent at the angle of 29.45°. Our X-ray results are in good agreement with other works dedicated TiO2 [e.g. 37]. Moreover, for the titania powders TiO2-3 ÷ TiO2-5 traces of rutile crystalline phase was found at the angle of 32.00° (see Fig. 1b).Pure TiO2-1 ÷ TiO2-5 powders were investigated by SEM technique. Morphologies of TiO2-1 and TiO2-2, as an examples revealed by SEM micrographs are shown in Fig. 2. TiO2-1 ÷ TiO2-5 samples appeared as agglomerations of smaller particles. The TiO2 powder in all cases presented aggregates consisting of smaller particles (from 80 nm for TiO2-4, to 200 nm for TiO2-1) to larger particles (from 100 nm for TiO2-4, to ~300 nm for TiO2-1).The grains size shape depends on the synthetic conditions and precursors used. The smallest grain sizes were observed for the reactions with TIPO. The important parameter controlling the particle formation and aggregation was the water/precursor molar ratio (see Experimental part).
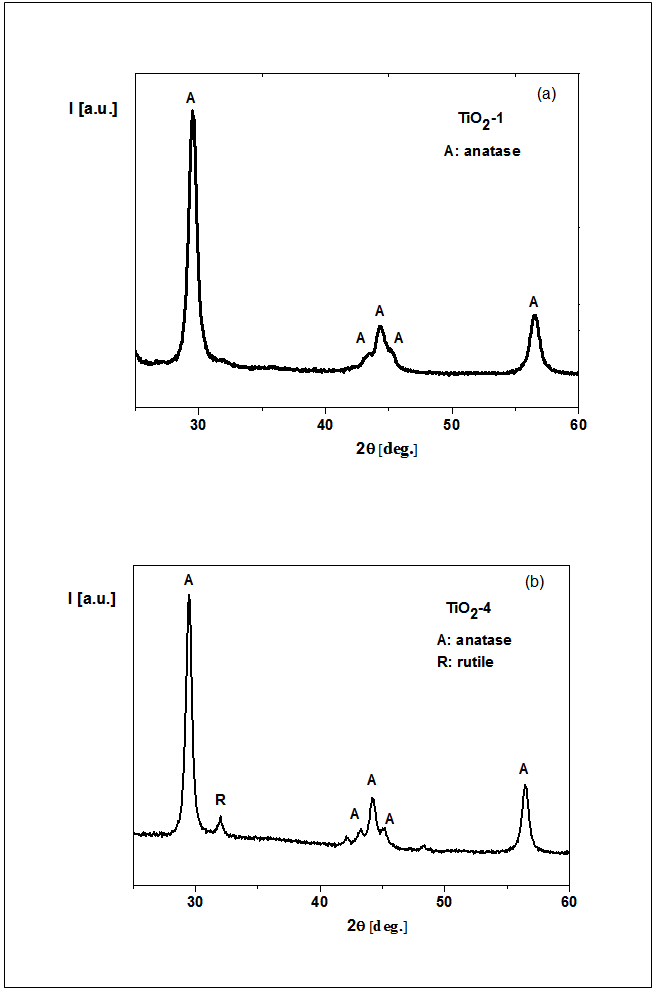 | Figure 1. X-ray pattern of TiO2-1 powder annealed at 500℃ (a), TiO2-4 powder annealed at 500℃ (b) |
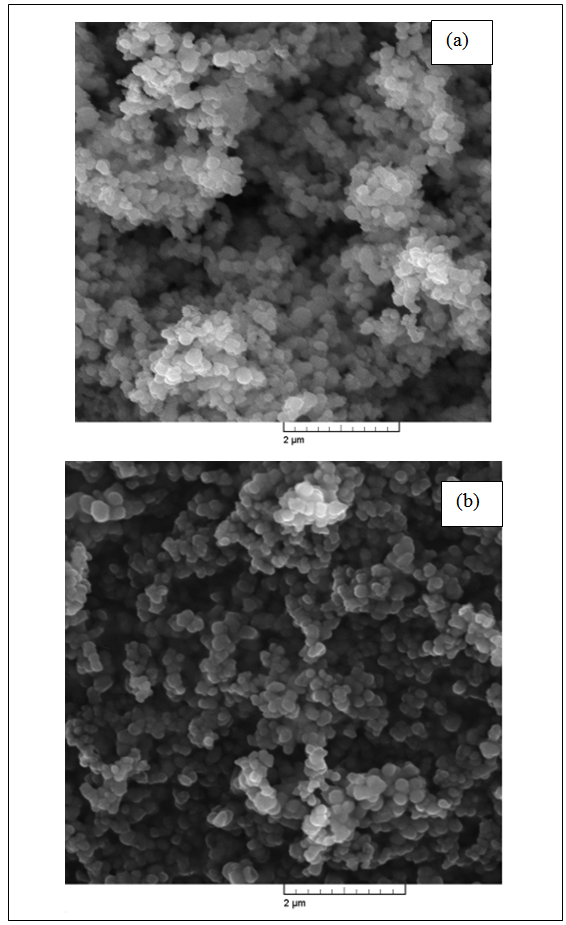 | Figure 2. SEM micrographs of titania powders: (a): TiO2-1 and (b) TiO2-2 |
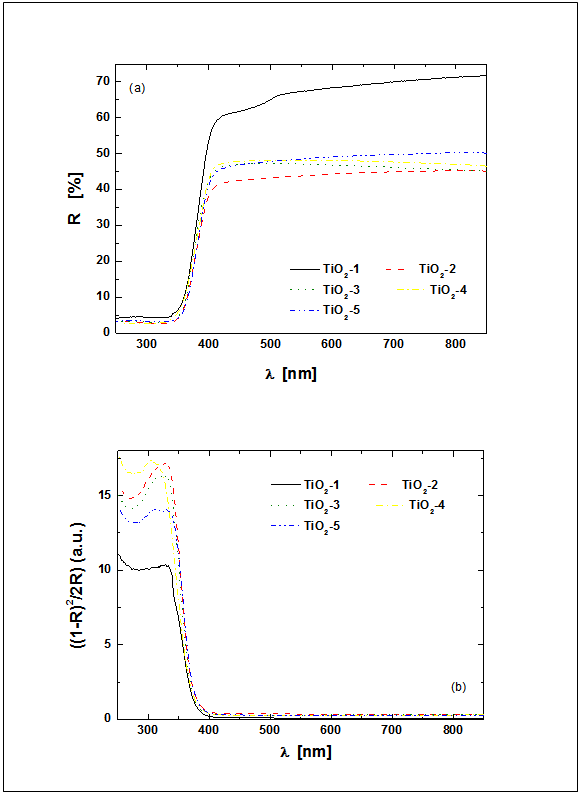 | Figure 3. Diffuse reflective UV–vis spectra of TiO2-1 ÷ TiO2-5 (a) and Kubelka–Munk function at different wavelengths of TiO2-1 ÷ TiO2-5 (b) |
|
3.1.2. AFM Study
- The AFM measurements of the TiO2 samples were performed in intermittent contact mode. Several measurements have been taken in order to provide statistically significant data. As the powder easily agglomerates, the optical camera view was used to place the scanning tip in areas covered with smallest visible objects, allowing to assume, that desired quality data will be collected with minimum risk of the tip contamination. Obtained result allowed to determine the diameter of the grains by analyzing the profile of the surface. The readouts were done in case of grains with clearly imaged both opposite edges. It should be underlined, that the impact of the shape of the scanning tip could be neglected in case of observed structures. The data obtained with AFM and SEM are consistent. The grains have regular, round and smooth shape. The example of acquired topography with its Sobel transform for TiO2-2 is presented in Fig. 4.In our work we investigated the influence of two titanium precursors on the structural and optical properties of synthesized TiO2. As precursors we used TBOT (TiO2-1) or TIPO (TiO2-2). For details of synthesis see Table 1. Being into consideration kind of precursor used, we can conclude that the average grain size was smaller for the titania obtained from TIPO (TiO2-2) than from TBOT. On the other hand, kind of precursor applied to obtain TiO2 not influence on the absorption UV-vis properties and kind of crystalline phase of titania (see Table 2).Moreover, we investigated influence of kind and amount of the solvent on the structural and optical properties of the synthesized titania. As a solvent we used ethanol or isopropyl alcohol (see Table 1). Being into consideration kind of the alcohol applied we can conclude that the average grain size was smaller for the titania obtained from isopropyl alcohol (TiO2-4) than from ethanol (TiO2-5). It is interesting that we observed big differences in the absorption UV-vis properties of these two materials. Along with change isopropyl alcohol (TiO2-4) into ethanol 15 nm red shift was found in absorption UV-vis properties of TiO2 (see Table 2). We not observed changes in the crystalline form of titania along with change isopropyl alcohol (TiO2-4) to ethanol (TiO2-5).Additionally, we investigated influence of amount of ethanol (10, 21 and 42 ml) on the structural and optical properties of titania. Along with increase the amount of ethanol decrease of average grain size was found, clearly seen for the compounds TiO2-2 (21 ml of C2H5OH) and TiO2-3 (42 ml of C2H5OH). No big differences in absorption UV-vis properties were observed for these compounds, however along with increase the amount of ethanol from 10 ml (TiO2-5) to 21 ml (TiO2-2) 10 nm red shift was found (see Table 2). Moreover, along with increase the amount of ethanol from 10 ml (TiO2-5) to 21 ml (TiO2-2) crystalline phases of titania change from anatase and rutyl to pure anatase form.
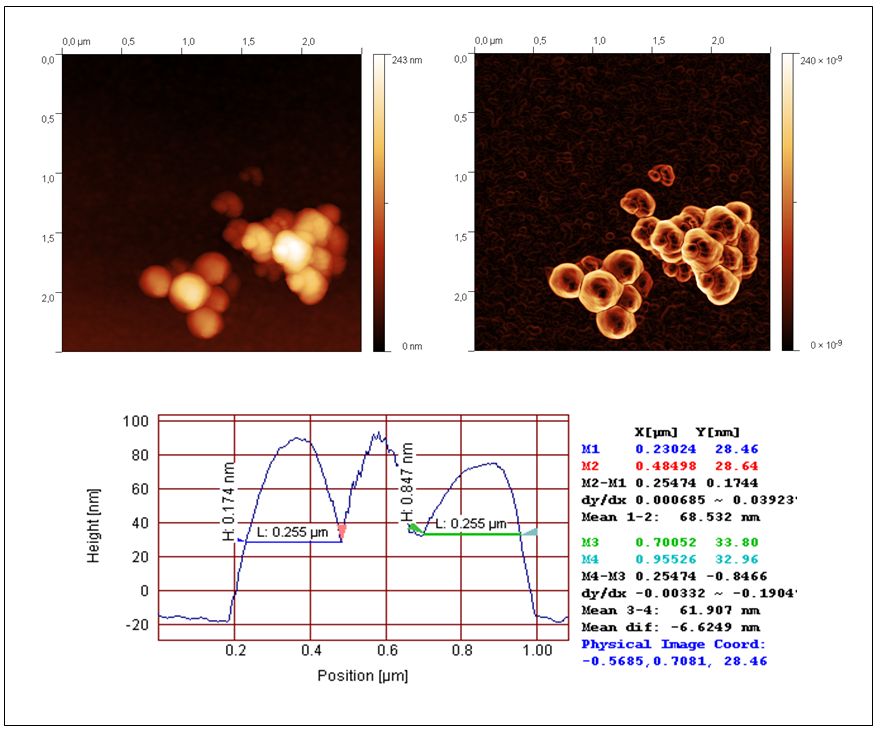 | Figure 4. AFM topography of TiO2-2 (left) Sobel transform of the topography (right), and the profile with markers used for determination of the grain radius |
3.2. Characteristic of Ag Doped TiO2
3.2.1. X-ray Diffraction and EDS and UV-vis
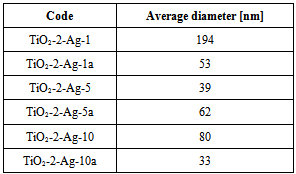
- For the silver doped titania, X-ray diffraction and scanning electron microscopy (SEM) along with EDS were used. The size of crystallite (D) of Ag doped TiO2, as was detected by X-ray, was about 130 Ǻ. For all the samples independ on the amount of Ag the same diffraction pattern characteristic to anatase crystalline phase was detected. A major peak corresponding to (101) reflections of the anatase phase of Ag doped TiO2 was apparent at the angle 29.47-29.75° depend on the method of synthesis used and amount of silver in titania. Small diffraction peak at the angle 52.08° coming from Ag in TiO2 was only observed in the case of samples with 10% w/w of Ag in titania (see Fig. 5).Moreover, higher amount of Ag in titania was detected by X-ray in the sample TiO2-2-Ag-10 in comparison with the sample TiO2-2-Ag-10a. The size of crystallite (D) of Ag in TiO2, as was detected by X-ray, was about 145 and 128 Ǻ, respectively for TiO2-2-Ag-10 and TiO2-2-Ag-10a powders.
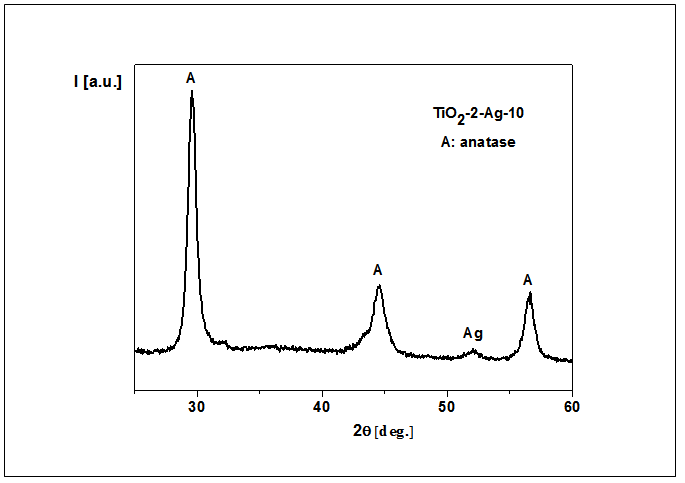 | Figure 5. X-ray pattern of TiO2-2-Ag-10, as an example |
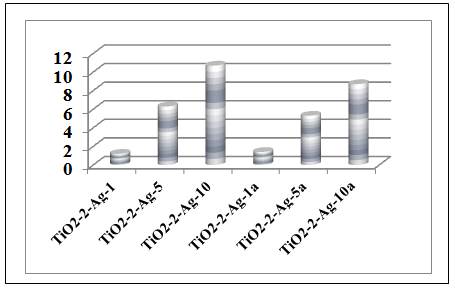 | Figure 6. Ag weight content analysis performed with EDS |
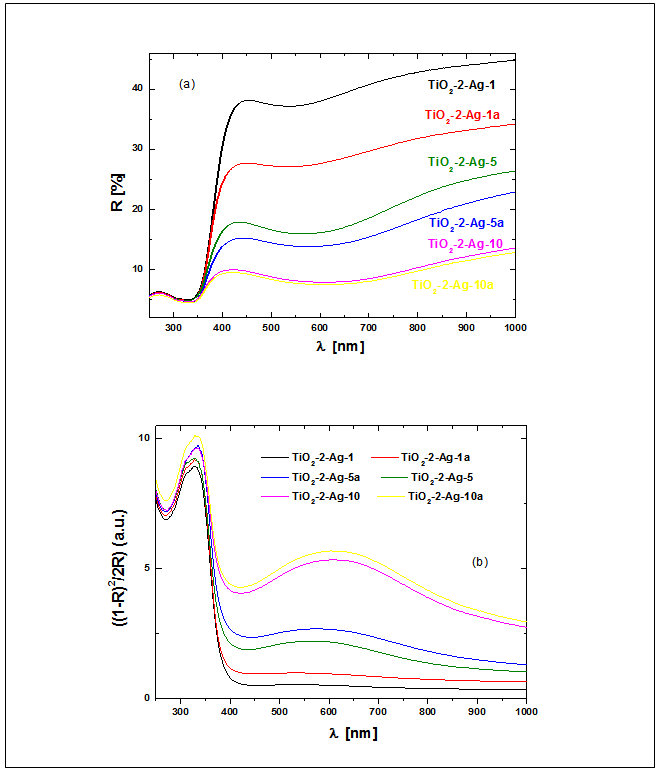 | Figure 7. Diffuse reflective UV–vis spectra of TiO2-2-Ag-y and TiO2-2-Ag-ya (a) and Kubelka–Munk function at different wavelengths of doped with Ag titania (b) |
3.2.2. AFM study
- The samples were measured with intermittent contact mode and additionally available phase imaging feature. The example of TiO2-2-Ag-1AFM image is presented in Fig. 8.
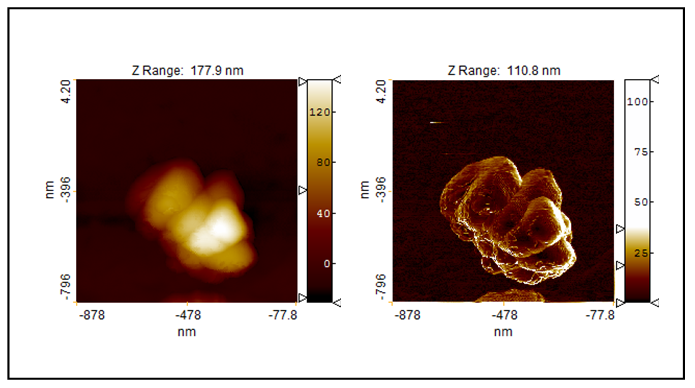 | Figure 8. The topography (left) and Sobel transform of the topography of measured TiO2-2-Ag-1 sample |
|
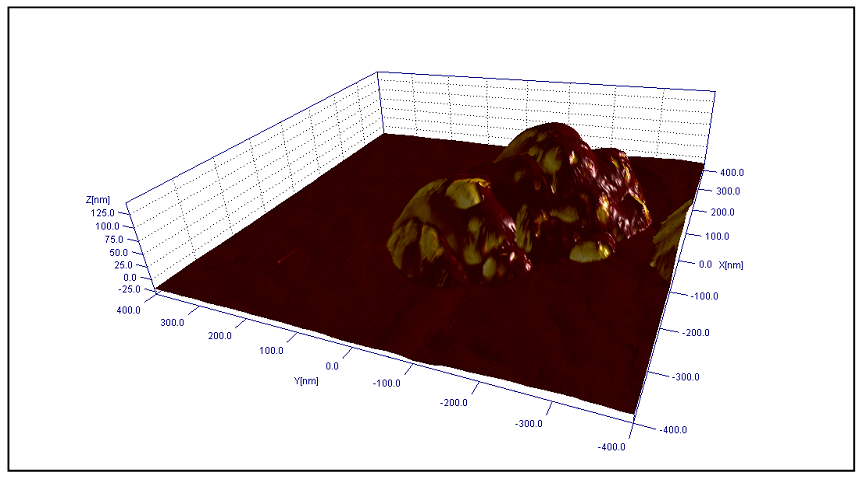 | Figure 9. The 3D topography image of the TiO2-2-Ag-1 with phase imaging data presented with the colors |
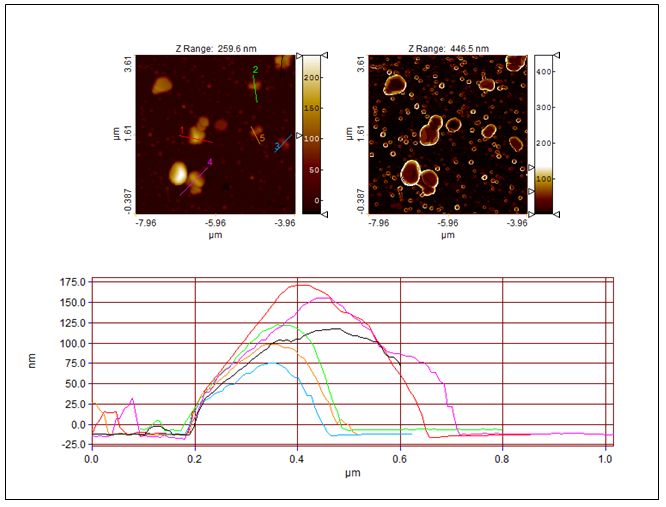 | Figure 10. Topography (left) and Sobel transform of the topography (right) as well as the profiles of investigated TiO2-2-Ag-1 sample |
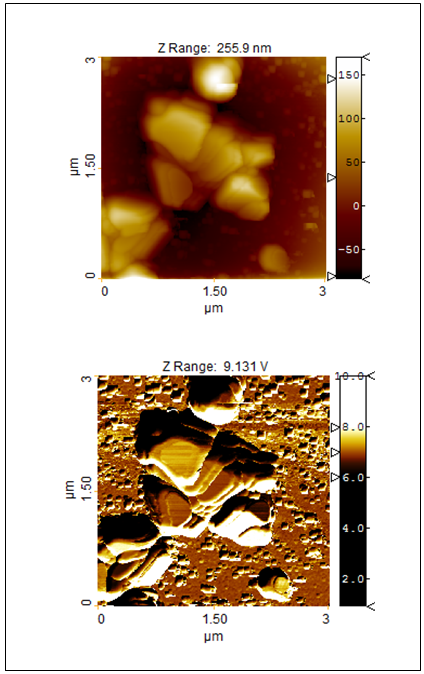 | Figure 11. Topography (top) and the amplitude response of the force modulation mode (bottom) of investigated TiO2-2-Ag-1 sample |
4. Conclusions
- In this work we presented the results of the investigation of the morphological and optical properties of the TiO2 and Ag doped TiO2 powder. Utilized techniques such as AFM, SEM, EDS, XRD and UV-vis allowed acquire essential information about developed materials. Both: AFM and SEM provided the diameter of the grains. Obtained values are coherent. Specific features of the grains, such as the shape related to the material’s form, could be on the other hand observed using only AFM technique, which provides accurate 3D surface imaging. Such ability allowed verify that the anatase form was obtained, which was also detected with XPS. It was also shown, that the expected Ag content in grains was verified with EDS analysis. Additionally, the presence of silver spots on the surface of grains was detected using phase imaging technique. Utilization of the force modulation mode provided the information about the stiffness of the substrate and the material. It should be underlined however, that obtained data is qualitative; therefore no real value of the mechanical properties may be determined using this method. Performed UV-vis measurements allowed to learn that the increase of the silver content significantly reduces the light transmission for wavelength above 400 nm.
ACKNOWLEDGEMENTS
- The authors thank dr J. Warycha for SEM and EDS measurements, dr. M. Palewicz for UV-vis measurements, Mss K. Gryzlo for zeta potential experiments and prof. W. Mielcarek for X-ray measurements.