Nguyen Dinh Tung Luan1, Le Dai Vuong2, Bui Cong Chanh1
1Departerment of Fundamental Science College of Industry Hue City, Viet Nam
2Department of Physics, College of Sciences, Hue University, 77 Nguyen Hue street, Hue city, Vietnam
Correspondence to: Le Dai Vuong, Department of Physics, College of Sciences, Hue University, 77 Nguyen Hue street, Hue city, Vietnam.
| Email: |  |
Copyright © 2012 Scientific & Academic Publishing. All Rights Reserved.
Abstract
In this paper, in order to achieve a type of material with mixing “soft” and “hard” properties for piezoelectric transformer applications, polycrystalline ceramics of PbZrO3 – PbTiO3 – Pb[(Mn1/3Nb2/3)x(Sb1/2Nb1/2)1-x]O3 (PZT-PMnSbN), x = 0.4; 0.5; 0.6; 0.7; 0.8; 0.9; 1.0, having a rhombohedral perovskite structure have been synthesized by the Columbite precursor method. Scanning electron micrograph (SEM) shows the compactness of the sample and the average grain size was found about ~ 1.89 µm. The electromechanical coupling factor (kp), piezoelectric constant (d31), mechanical quality factor (Qm) of PZT-PMnSbN composition ceramics with x = 0.7 showed the optimal value of 0.6, 180 pC/N, and 1895, respectively, and spontaneous polarization Pr ≈ 49.2µC/cm2 were observed at room temperature. These values indicated that the newly developed composition may be suitable for piezoelectric transformer applications.
Keywords:
Dielectrics, Piezoelectrics, Piezoelectric Transformer, PZT-PMnSbN, Columbite Precursor Method
Cite this paper: Nguyen Dinh Tung Luan, Le Dai Vuong, Bui Cong Chanh, Microstructure, Ferroelectric and Piezoelectric Properties of PZT-PMnSbN Ceramics, International Journal of Materials and Chemistry, Vol. 3 No. 3, 2013, pp. 51-58. doi: 10.5923/j.ijmc.20130303.02.
1. Introduction
Single and multilayer-type piezoelectric transformers (PTs) for LCD backlights have been intensively studied in order to increase the set-up ratio and output power[1]. These PTs, however, were not applicable to fluorescent lamps. Namely, when conventional fluorescent lamps are lit, their equivalent resistance is smaller at a few hundreds and thousands ohms than that of cold cathode fluorescent lamps (CCFL). In order to achieve a PT with high output current, its output capacitance must be high. Therefore, composition ceramics for high power PTs must have a high dielectric constant. Moreover, to achieve the piezoelectric transformer transferring high power, it is necessary to increase its strength by producing fine grains and to have a high mechanical quality factor (Qm) because the piezoelectric transformer operated at its resonant frequency under a high input voltage leads to the temperature rise and the deterioration of piezoelectric properties with the increase of its vibration velocity[1,2,3,4,5]. The properties of these materials should combine a high mechanical quality factor (Qm) with high electromechanical coupling factor (kp) and low dielectric loss (tan δ) simultaneously because the piezoelectric transformer operated at its resonant frequency in transformation between electrical and mechanical energy[6]. Satoh et al. investigated Pb(Zr,Ti)O3 – Pb(Sb1/2Nb1/2)O3 ceramics[7] with compositions close to the morphotropic phase boundary (MPB) and pointed out that these ceramics have large electromechanical coupling factors kp and dielectric constant. However, the small mechanical quality factor Qm constrained their use to high power piezoelectric devices such as multilayer piezoelectric transformers and piezoelectric motors. It is necessary to optimize the piezoelectric properties of the ceramics for high power device applications.Pb(Zr,Ti)O3 – Pb(Mn1/3Nb2/3)O3 ceramics are a type of hard piezoelectric ceramic with very high mechanical quality factor Qm, but dielectric constant and radial coupling coefficient kp, are relative low[7,8].With purposing to establish a material suitable for the production of piezoelectric transformers and other high power devices, in this paper, PMnN and PSbN were added to the PZT-PMnSbN compositions near morphotropic phase boundary to form a piezoelectric ceramic with the optimal values of Qm and kp.
2. Experimental Procedure
2.1. Sample Preparation
The general formula of the material studied was:0.9Pb(Zr0.53Ti0.47)O3-0.1Pb[(Mn1/3Nb2/3)x(Sb1/2Nb1/2)1-x]3where x is 0.4; 0.5; 0.6; 0.7; 0.8; 0.9; 1.0. and are denoted by M1; M2; M3; M4; M5; M6; M7, respesively.Step 1: Synthezise MnNb2O6 and Sb2Nb2O8MnCO3 and Nb2O5; Sb2O3 and Nb2O5 were mixed and acetone- milled for 20hr in a zirconia ball mill (the PM 400/2 milling machine) and then calcined at 1200℃ for 2hr to form MnNb2O6 and Sb2Nb2O8. The material was acetone-ground for 10hr in the mill and dried again.Step 2: Synthezise PZT – PMnSbNReagent grades PbO, ZrO2, TiO2 were mixed with MnNb2O6 and Sb2Nb2O8 powders by ball mill for 20hr in acetone. Powders were calcined at 850℃ for 2 h, then milled again for 20h. The ground materials were pressed into disk 12mm in diameter and 1.5mm in thick under 100 MPa. The samples were sintered in a sealed alumina crucible with PbZrO3 coated powder at temperature 1150℃ for 2h.The sintered samples were ground and cut to 1mm in thick. A silver electrode was fired at 680℃ for 10 minutes on the major surfaces of samples. Poling was done in the direction of thickness in a silicon oil bath under 30kV/cm for 15 minutes at 120℃.
2.2. Measurements
The bulk densities of sintered specimens were measured by Archimedes technique. The crystalline phase was analyzed using an X-ray diffactometer (XRD). The microstructure of the sintered bodies was examined using a scanning electron microscope (SEM). The grain size was measured by using the line intercept method. The dielectric permittivity and dielectric dissipation of samples were measured by the highly automatized RLC HIOKI 3532 at 1 kHz.The electromechanical coupling factor, kp, mechanical quality factor, Qm, and several other piezoelectric constants were calculated by a resonant – anti resonant frequency method measured using an automatized impedance analyzer (HP-4193A). The polarization – electric field (P – E) hysteresis loops were measured by a Sawyer – Tower circuit at 50Hz.
3. Results and Discussion
3.1. Density of Ceramic
Table 1 shows the density of PZT – PMnSbN ceramics and the change of density shows in Fig.1.| Table 1. Ceramic densities of samples |
| | Sample | M1 | M2 | M3 | M4 | M5 | M6 | M7 | | ρ (g/cm3) | 7.40 | 7.47 | 7.58 | 7.64 | 7.56 | 7.50 | 7.44 |
|
|
It is clear that the densities of all samples were strongly changed with amount of PMnN and PSbN in PMnSbN. The maximum density was obtained at x = 0.7 (7.64g/cm3).The density increased with increasing amount of PMnN up to x = 0.7 and then decrease. This can be explained from microstructures of ceramic samples. When the amount of PMnN increased, the ceramic samples became more dense, and at x = 0.7, the ceramic sample was almost fully dense (fig. 4). When the further increasing the PMnN content to 0.8 and above, a large number of pores were present, giving rise to density decreased.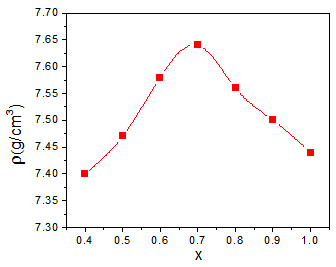 | Figure 1. Bulk density dependence on amount of PMnN in PMnSbN composition |
3.2. Struture and Microstructure
Fig. 2 shows the XRD pattern of all samples at room temperature. The subdivision in intensities of the (200) and (002) peaks demonstrated exist of tetragonal phase in the base of rhombohedral phase of the perovskite structure. No pyrochlore and any second phase were found in all compositions. The changes of lattice parameters of the samples were shown in the table 2 and figure 3. It is indicated that c/a ratio increase significant with increasing of amount of PMnN in PMnSbN composition. The largest strain of cell unit is at x = 0.7(c/a = 2.4865). | Table 2. Calculated lattice parameters samples |
| | | M2 | M3 | M4 | M5 | M6 | M7 | | a | 5.7651 | 5.7554 | 5.7506 | 5.7544 | 5.7548 | 5.7546 | | b | 5.7651 | 5.7554 | 5.7506 | 5.7544 | 5.7548 | 5.7546 | | c | 14.2989 | 14.3000 | 14.2989 | 14.3001 | 14.2996 | 14.2989 |
|
|
SEM micrographs of M1, M2, M3, M4, M5, M6, M7 samples are presented in figure 4. As shown in the figures, the grain structures of all samples were very fine, grain growth rise to decreasing of amount of PMnN in PMnSbN compositions. Most of all samples had clearly grain boundaries except M1 and M2 samples appeared grain boundaries and grain size of M1, M2, M3 samples were limited to 2.33μm shown in fig.5, it is explained that excess PSbN and PMnN in beyond the solubility limit to segregate at grain boundaries and inhibits grain growth[9,10].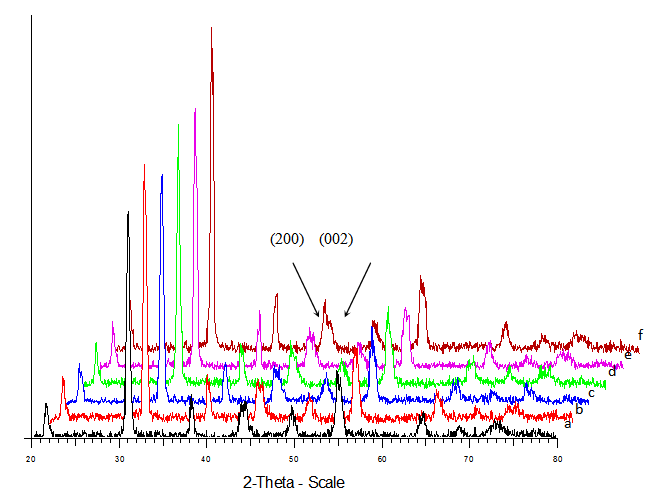 | Figure 2. XRD pattern of M2-a; M3-b; M4-c; M5-d; M6-e; M7-f samples |
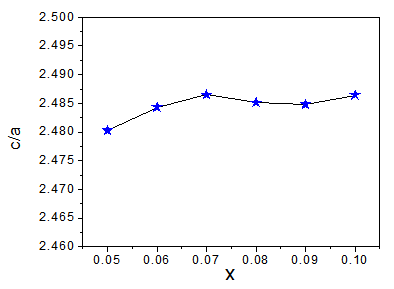 | Figure 3. Dependence of c/a ratios on amount of PMnN in PMnSbN compositions |
In addition to, such variation in grain size can be also interpreted in terms of the solubility limited of PSbN and PMnN in the PZT – PMnSbN composition matrix[10,11].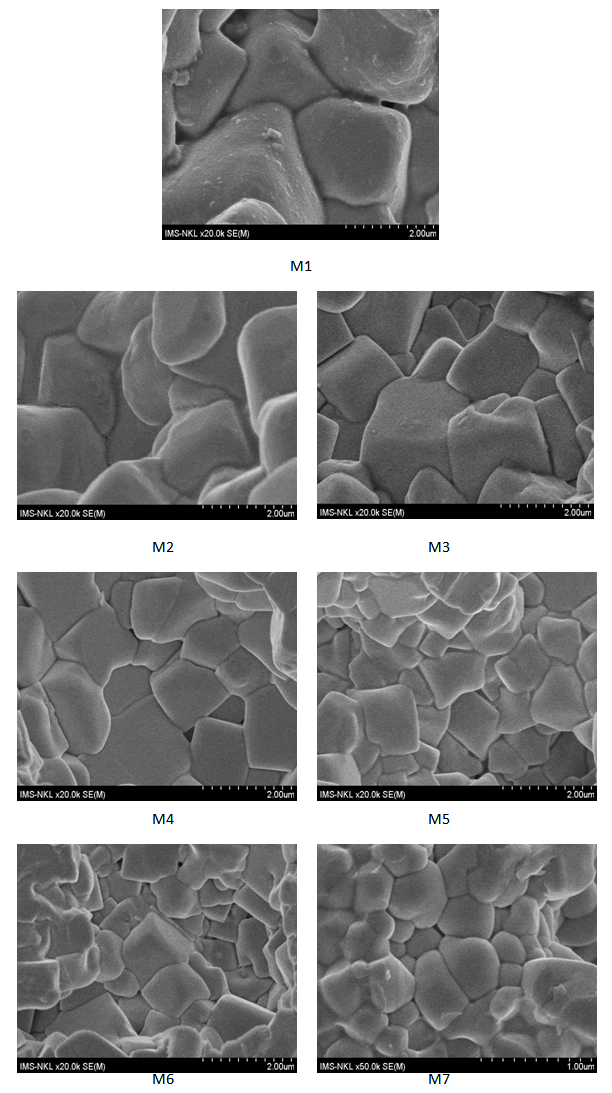 | Figure 4. SEM images of samples |
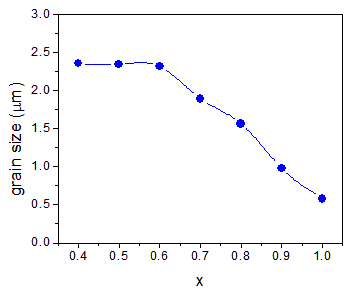 | Figure 5. Grain size dependence on amount of PMnN in PMnSbN composition |
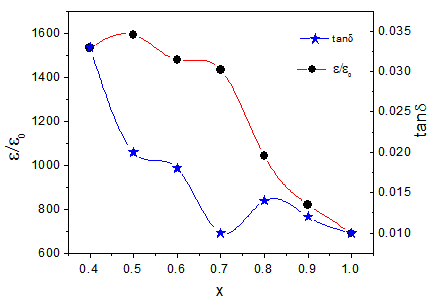 | Figure 6. Dielectric constant ε/ε0 and dielectric dissipation tanδ dependence on amount of PMnN in PMnSbN compositions |
3.3. Dielectric, Ferroelectric and Piezoelectric Properties
Dielectric properties of samples are presented in table 3 and in figure 6. It is cleared that, dielectric constant and dielectric dissipation of the samples strongly decrease with increasing of amount PMnN in PMnSbN compositions. Especially, with M4(x = 0.7) dielectric constant is very high while dielectric dissipation very low. It is indicated that the mixing amount of PMnN and PSbN into PMnSbN composition to form a material with the existence of both of the soft and hard properties is perfect at x = 0.7.Figure 7 shows P – E hysteresis loops of all samples. The well-saturated hysteresis loops were observed and the values of remanent polarization (Pr) and coercive field (EC) were presented in table 4 and figure 8.It’s demonstrated that the hysteresis loops of all samples are of typical forms characterizing ferroelectric materials. EC strongly increased with increasing of amount PMnN in PMnSbN composition. Meanwhile, Pr increased up to 49.2μC/cm2 at x = 0.7 and then decreased. This result is in good agreement with the studied dielectric and piezoelectric properties of the samples.| Table 3. Dielectric constants and dielectric dissipation of samples |
| | Sample | M1 | M2 | M3 | M4 | M5 | M6 | M7 | | ε/ε0 | 1533 | 1592 | 1477 | 1434 | 1041 | 820 | 690 | | tanδ | 0.033 | 0.021 | 0.018 | 0.010 | 0.014 | 0.012 | 0.01 |
|
|
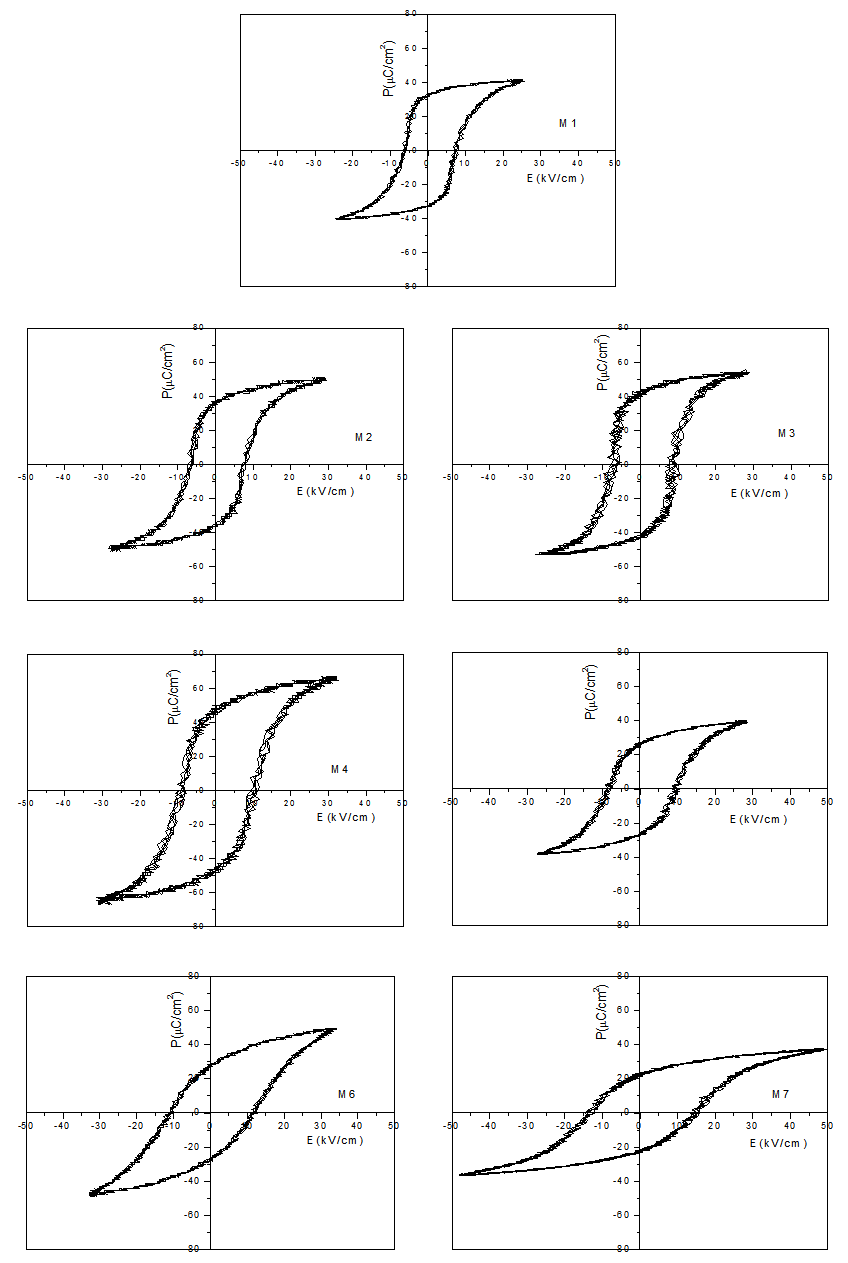 | Figure 7. P-E hysteresis loops of samples |
| Table 4. Calculated Pr and EC values of samples |
| | Sample | Ec(kV/cm) | Pr(μC/cm2) | | M1 | 7.69 | 33.0 | | M2 | 7.79 | 37.0 | | M3 | 9.36 | 42.0 | | M4 | 10.28 | 49.2 | | M5 | 10.00 | 46.0 | | M6 | 11.85 | 28.0 | | M7 | 15.40 | 25.0 |
|
|
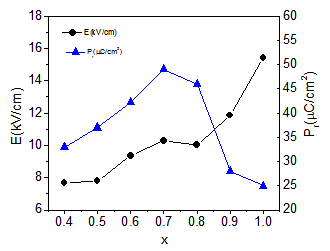 | Figure 8. Pr and EC dependence on amount of PMnN in PMnSbN compositions |
The values of the piezoelectric constants are shown in table 5. Figure 9 and figure 10 show the effect of amount of PMnN in PMnSbN composition on the piezoelectric properties, that is, radial coupling coefficient (kp), piezoelectric constant (d31) and mechanical quality factor (Qm) for the base composition PZT – PMnSbN. It is cleared that, kp and d31 increased with increasing amount of PMnN up to x = 0.7 and then strongly decreased. On other hand, increasing of amount of PMnN lead to decreasing the resonant resistance (R) and increasing Qm. The specimen at x = 0.7 exhibited the most excellent dielectric, ferroelectric and piezoelectric properties of ε/ε0 = 1447, Pr = 49.2μC/cm2, kp = 0.60, d31 = 180pC/N and Qm = 1895 is the best one for high-power piezoelectric transformerapplications[1,2,11,12,13,14,15,16,17].| Table 5. Calculated kp, d31 and Qm values of samples |
| | Sample | kp | d31(pC/N) | Qm | | M1 | 0.45 | 108.23 | 456 | | M2 | 0.50 | 119.3 | 487 | | M3 | 0.56 | 121.18 | 900 | | M4 | 0.60 | 180 | 1895 | | M5 | 0.52 | 102.6 | 1844 | | M6 | 0.50 | 86.22 | 1886 | | M7 | 0.44 | 72.57 | 2044 |
|
|
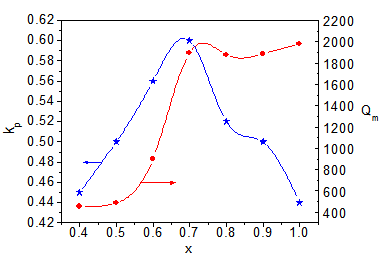 | Figure 9. The Qm, kp dependence on amount of PMnN in PMnSbN |
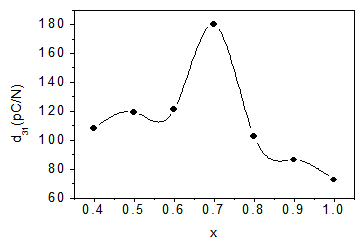 | Figure 10. The d31 dependence on amount of PMnN in PMnSbN |
4. Conclusions
Piezoelectric properties of0.9Pb(Zr0.53Ti0.47)O3-0.1Pb[(Mn1/3Nb2/3)x(Sb1/2Nb1/2)1-x]O3 ceramics were investigated with the variation of x = 0.4 – 1.0 for high power piezoelectric transformer application. The results obtained from the experiment are as follows:1. The structures of PZT – PMnSbN compositions were changed not much with amount of PMnN and PSbN. The splitting of (200) and (002) peaks demonstrated the presence of tetragonal phase in the base of rhombohedral phase of perovskite. No pyrochlore were found in all compositions..2. With the increase of amount of PMnN in PMnSbN composition, grain size decreased, EC increased, Pr increased up to x = 0.7 and then decreased. At x = 0.7, the values of grain size, EC, Pr were 1.89μm, 10.28kV/cm and 49.2μC/cm2, respectively.3. Dielectric constant ε/ε0 and dielectric loss tanδ were decreased with increasing of amount PMnN. While Qm was strongly increased with increasing of amount of PMnN in PMnSbN composition, kp and d31 increased of maximum at x = 0.7 and then decreased. The optimal values of Qm, kp, d31 were 1895, 0.6 and 180pC/N, respectively. It can be concluded that the specimen 0.9Pb(Zr0.53Ti0.47)O3-0.1Pb[(Mn1/3Nb2/3)0.7(Sb1/2Nb1/2)0.3]O3 with the solubility suitably of soft and hard compositions is best for piezoelectric transformer applications.
References
| [1] | J.H.Yoo, Y.W.Lee, K.H.Yoon, H.S.Jung, Y.H.Jeong and C.Y.Park: J.Kor.Inst. Electr. Electron. Mater. Eng. (KIEEME) 11, 1998, 849. |
| [2] | G. H. Haertling, J. Am. Ceram. Soc. 82, 1999, 797. |
| [3] | C. W. Ahn, H. C. Song, S. Nahm, S. Priya, S. H. Park, K. Uchino, H. G. Lee and H. J. Lee, J. Am. Ceram. Soc.89,2006, 921. |
| [4] | Seok-Jin Yoon, Ji-Won Choi and Joo-Young Choi, Journal of the Korean Physical Society, Vol. 57, No. 4, 2010, pp. 863_867. |
| [5] | J.H.Yoo, K.H.Yoon, Y.W.Lee, S.J.Suh, J.S.Kim and C.S.Yoon: Jpn.J.Appl.Phys. 39, 2000, 2680. |
| [6] | L.T. Li, W.T. Deng, J.H. Chai, Z.L. Gui, X.W. Zhang, Ferroelectrics 101 (1990) 193–200. |
| [7] | H.Ohuchi and Y.Kawamura: Jpn.J.Appl.Phys. 34, 1995, 5298 – 5302. |
| [8] | Satoh, O.Ise, Y.Mamina. Jpn.J.Appl.Phys. 38, 1999, 5531 – 5534. |
| [9] | J. Yoo, Y. Lee, K. Yoon, S. Hwang, S. Suh, J. Kim and C. Yoo, Jpn. J. Appl. Phys 40, 2001, 3256–3259. |
| [10] | Yuhuan Xu, Ferroelctric Materials and Their Applications (North-Holland, Amsterdam- London- Newyork-Tokyo), 1991. |
| [11] | F. Gao., L. Cheng, Hong R., J. Liu, C. Wang and C. Tian, Ceramics International 35, 2009, 1719–1723. |
| [12] | R. Muanghlua, S. Niemchareon, W. C. Vittayakorn and N. Vittayakorn, Advanced Materials Research 55-57, 2008, 125-128. |
| [13] | J. Yoo and S. Lee, Transactions on electrical and electronic materials 10, 2009, 121-125. |
| [14] | X. Chao, Z. Yang, C. Kang, Y. Chang, Sensors and Actuators A 141, 2008, 482–488. |
| [15] | Lee J. S., Choi M. S., Nguyen V. H. Kim Y. S, Kim I. W., Park E. C., Jeong S. J., Song J. S., Ceramics International 33, 2007, 1283–1286. |
| [16] | Y. D. Hou, M. K. Zhua, C. S. Tian, H. Yan, Sensors and Actuators A 116, 2004, 455–460. |
| [17] | C.H. Wang, S.J. Chang, P.C. Chang, Materials Science and Engineering B 111, 2004, 124–130. |
 Abstract
 Reference
 Full-Text PDF
 Full-text HTML