-
Paper Information
- Next Paper
- Previous Paper
- Paper Submission
-
Journal Information
- About This Journal
- Editorial Board
- Current Issue
- Archive
- Author Guidelines
- Contact Us
International Journal of Materials and Chemistry
p-ISSN: 2166-5346 e-ISSN: 2166-5354
2013; 3(1): 5-9
doi:10.5923/j.ijmc.20130301.02
Raman Spectroscopy as a Tool for Garnet Analysis and Investigation on Samples from Different Sources
Theodore Ganetsos1, 2, Thomas Katsaros1, Peter Vandenabeele3, Susanne Greiff4, Sonngard Hartmann4
1Laboratory of Gemstones, Byzantine & Christian Museum, Vas. Sofia’s Avenue. 22 Athens, 106 75, Greece
2T.E.I. of Lamia, 3rd Km. ONR Lamia-Athens, Lamia, 35100, Greece
3Ghent University, Department of Archaeology, Sint-Pietersnieuwstraat 35, B-9000 Ghent, Belgium
4Romisch-Germanisches Zentralmuseum Mainz, Ernst-Ludwig-Platz 2, D-55116 Mainz, Germany
Correspondence to: Theodore Ganetsos, Laboratory of Gemstones, Byzantine & Christian Museum, Vas. Sofia’s Avenue. 22 Athens, 106 75, Greece.
| Email: |  |
Copyright © 2012 Scientific & Academic Publishing. All Rights Reserved.
During the Hellenistic period, Garnet was a popular stone for use both as seals and as decorative inlay in jewellery1. The Collectors of garnets and minerals often attach great importance to the provenance or country of origin2. Therefore, “the goal of origin determination” is to provide the geographic provenance of a garnet and can be defined as: the attribution of a stone to a specific type of deposit and the attribution of a stone to a mining area, a geographic locality, or country. In this research work we present the identification and the provenance of 9 garnets from 7 different localities. This is possible because the full range of properties of a garnet measured and observed in the laboratory reflect the specific conditions of its genetic background during the natural crystallization process. We used Raman spectroscopy analysis as a tool which provides even further information to distinguish garnets from different localities. Since each specific member of the isomorphous series shows a characteristic pattern, the Raman Effect can be used as a tool of identification. Our experimental results illustrate this concept.
Keywords: Raman Spectroscopy, Garnets, Almandine, Jewellery
Cite this paper: Theodore Ganetsos, Thomas Katsaros, Peter Vandenabeele, Susanne Greiff, Sonngard Hartmann, Raman Spectroscopy as a Tool for Garnet Analysis and Investigation on Samples from Different Sources, International Journal of Materials and Chemistry, Vol. 3 No. 1, 2013, pp. 5-9. doi: 10.5923/j.ijmc.20130301.02.
Article Outline
1. Introduction
- The precious varieties of Garnets according to Pliny the Elder, were the Indian, the Garamantic or Carthaginian, the Ethiopia, and the Alabandine. The last were so called because, though found in the Orthosian rocks, they were worked up (perficiuntur) at Alabandae3. This was the sort called by Theophrastus as the Milesian4 stone both places being in the same province, Caria (Modern Turkey).The sample from Turkey comes from Alabanda a site of ancient topography which was described by Pliny the Elder5. The importance of this specific sample is high because of its historic origin. Theophrastus in his treatise “On Stones” had described a mineral in chapter 19 with geometrical structure which consists of hexagonal and named anthrax. In this research work we present the identification and the provenance of 9 garnets from 7 different localities. This is possible because the full range of properties of a garnet measured and observed in the laboratory reflect the specific conditions of its genetic background during the natural crystallization process. We used both two Raman spectroscopy analysis equipments, as a tool6,7 which provides even further information to distinguish garnets from different localities8. We used a laboratory stable μ-Raman at University of Ghent and a handle Raman at Byzantine Museum of Athens.
2. Experimental
2.1. Samples Description
- The samples which we studied are the followings: a green grossular (variety tsavorite) from the Merelani Hills of Tanzania, a whitish grossular from the Kimmeria Mountains near Xanthi in Northern Greece and five green grossulars from the region of Yakutia, Siberia of Russia (Fig. 4a and b). We have also two samples of grossular from the district of Santa Eulalia, Chihuahua, Mexico (Fig. 3a and b). These specific species have a perfect shape of rhombic dodecahedron. From the Atlas Mountains of Morocco we have a black andradite (variety melanite). We studied four samples of almandine, two from Tyrol of Austria, and two from the locality of Alabanda, Aydin Province of Turkey (Fig. 5a and b).
2.2. Method and Apparatus
- Micro-Raman investigations are performed using a dispersive Renishaw System1000 Raman spectrometer. (Ghent University, Belgium). The device is fitted with a diode laser operating at 50 mW and 780 nm. An Olympus BH-2 microscope is used to focus the laser on the sample, using objective lenses of 5x, 20x, 50x and 80x magnification. The microscope is equipped with binoculars and a colour video camera, allowing to position the sample and to select a specific region for investigation. The backscattered light passes through a holographic notch filter (HNF), which rejects the abundant elastic Rayleigh scattering, to avoid outshining of the weaker Raman signal. The backscattered light is dispersed by using a 1200 lines / mm grating and is detected on a Peltier-cooled CCD-detector. This configuration allows to record spectra with a spectral resolution of ca. 1 datapoint / cm-1 in the spectral region between 150 and 2500 cm-1. The fibre-optics Ramanspectra are recorded on a Bruker FT-Raman spectrometer, allowing to record spectra from 250 cm-1 onwards.The handled equipment is a Raman spectrometer (Rockhound of Deltanu) at 785 nm, with a range from 200-2000cm-1 and a resolution 8 cm-1. The excitation power of the laser beam is 120 mW. This is a light-scattering and non-destructive technique which allows for the identification of inclusions in garnets by comparing a spectrum to a mineral database for identification of the sample. It shoots a laser beam at the garnet sample and then measures the weak light emitted to measure the spectrum of the Raman Effect. Since each specific member of the isomorphous series shows a characteristic curve in its obtained spectra, the Raman Effect can be used as a tool of identification7.
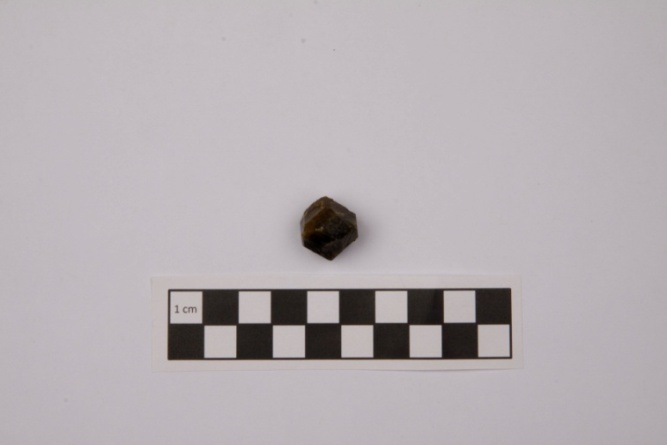 | Figure 4a. Green grossular image. Localitry: from the region of Yakutia, Siberia of Russia |
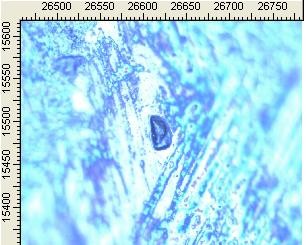 | Figure 4b. Micro Raman photo of green grossular. Locality: from the region of Yakutia, Siberia of Russia |
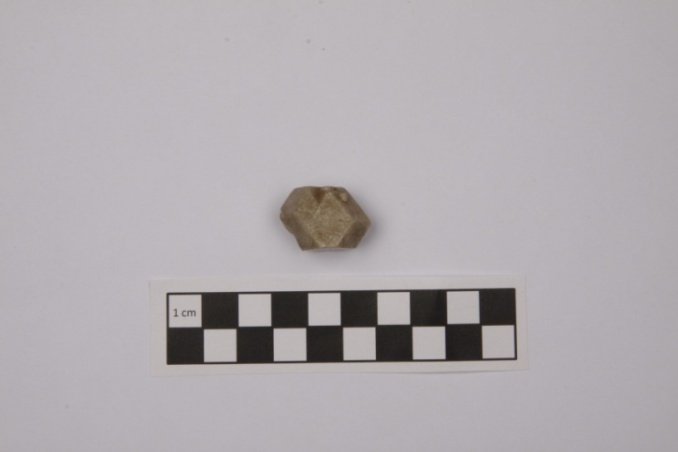 | Figure 3a. Grossular image. Locality: of Santa Eulalia, Chihuahua, Mexico |
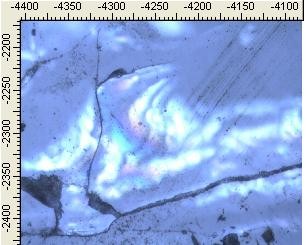 | Figure 3b. Micro Raman photo of grossular. Locality: of Santa Eulalia, Chihuahua, Mexico |
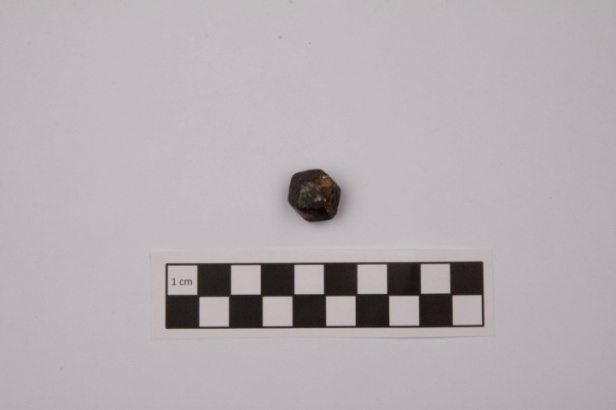 | Figure5a. Almandine image. Locality: Alabanda, Aydin Province of Turkey |
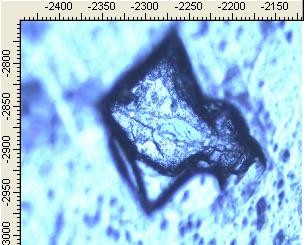 | Figure 5b. Micro Raman photo of almandine. Locality: Alabanda, Aydin Province of Turkey |
3. Results and Discussion
- Hydroxide ions are a minor component of many silicate minerals that are usually formulated as anhydrous. In garnets, the concentration of OH can range from trace levels to that of a major component. Hydroxyl in garnet has been extensively studied with infrared transmission spectroscopy, and analytical calibrations have been established through integrated absorbance and peak heights for the spessartine-almandine series9, for grossular10, and for pyrope11. Although infrared methods are comparatively easy to conduct, they do require that the sample be prepared as a doubly polished slab of thickness appropriate for the amount of OH in the sample. Because Raman spectroscopy is a relatively fast and easy way to collect data with minimal sample preparation, we wanted to evaluate the utility of this method to acquire quantitative OH concentrations for some members of the garnet family. Available for this study were the suite of grossular samples used by Rossman and Aines10 in their study of OH in grossular, and the suite of pessartine almandine garnets as used by Arredondo et al.12. Analyses by Raman spectra have proven useful for determining water contents of melt inclusions in granite with contents ranging from 0–20 wt% 13.
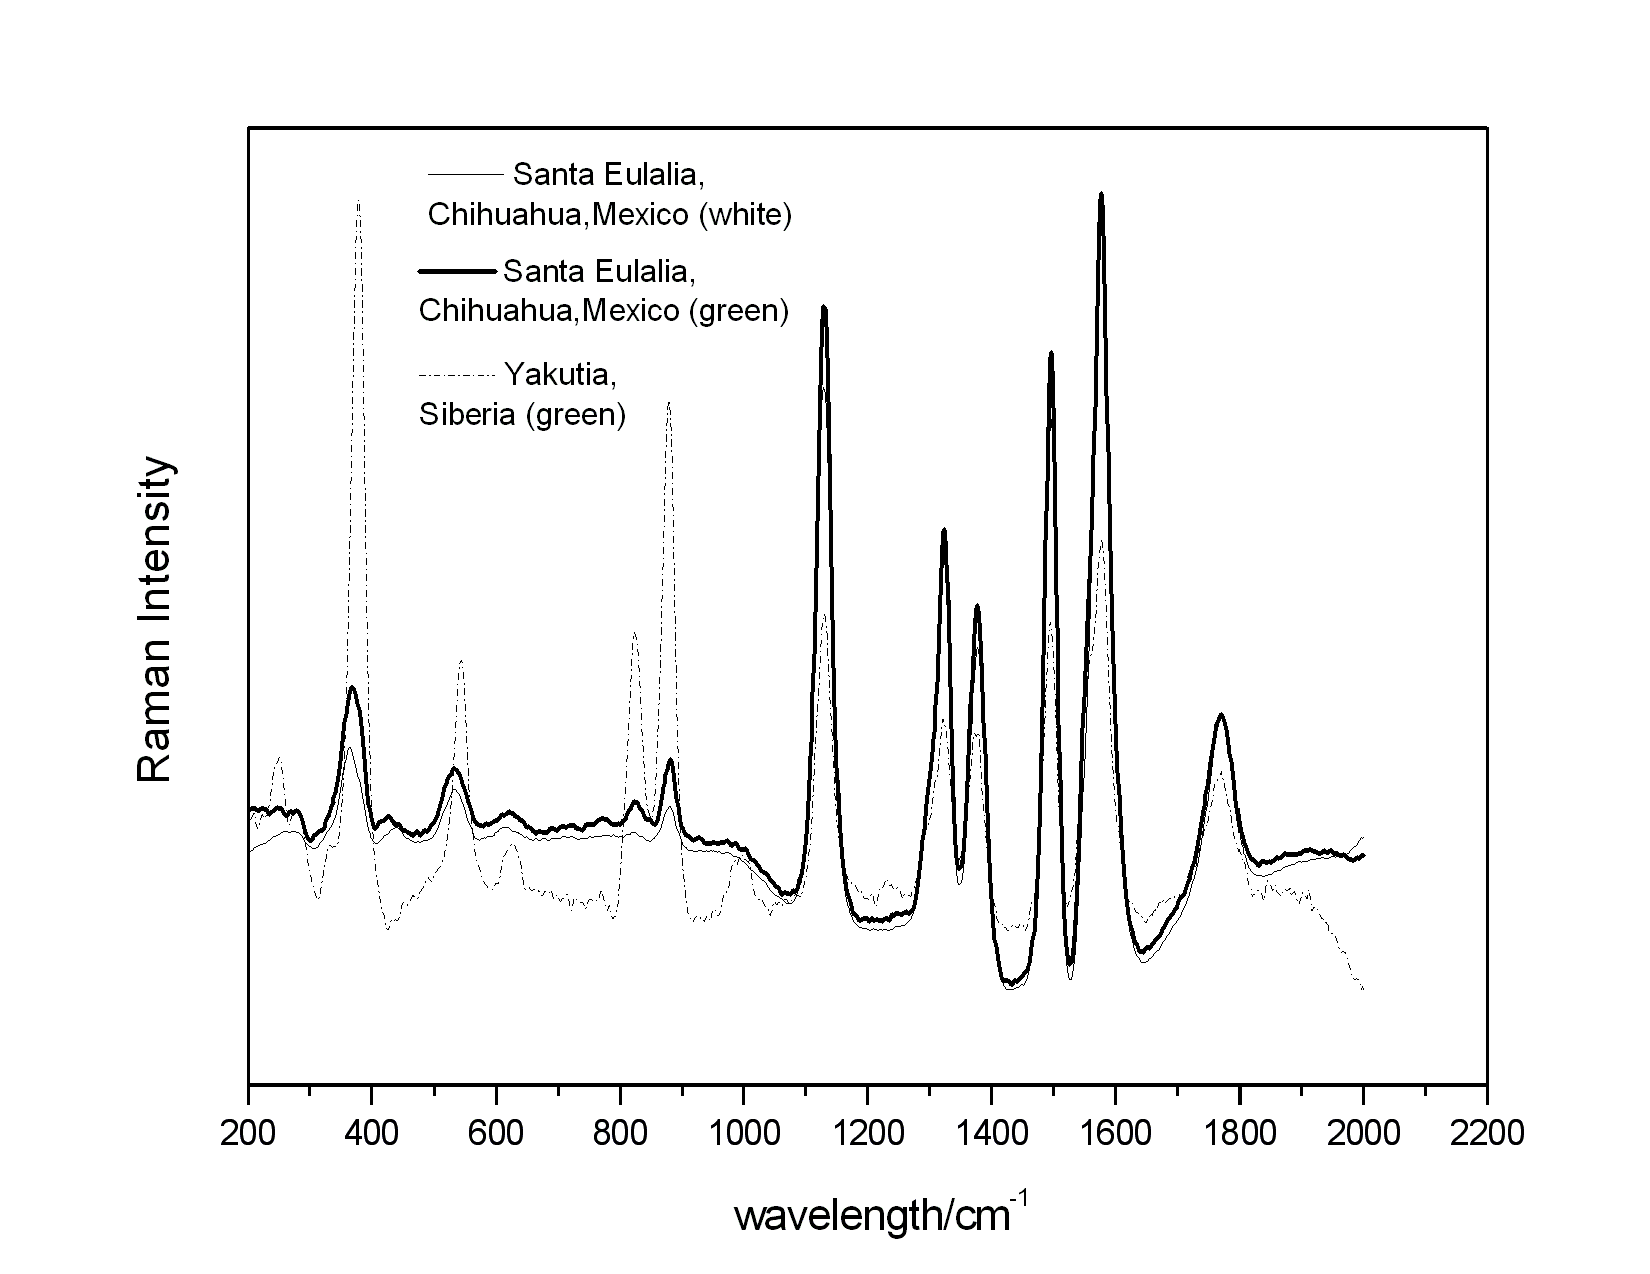 | Figure 2. Raman spectra of three grossular samples from Different localities |
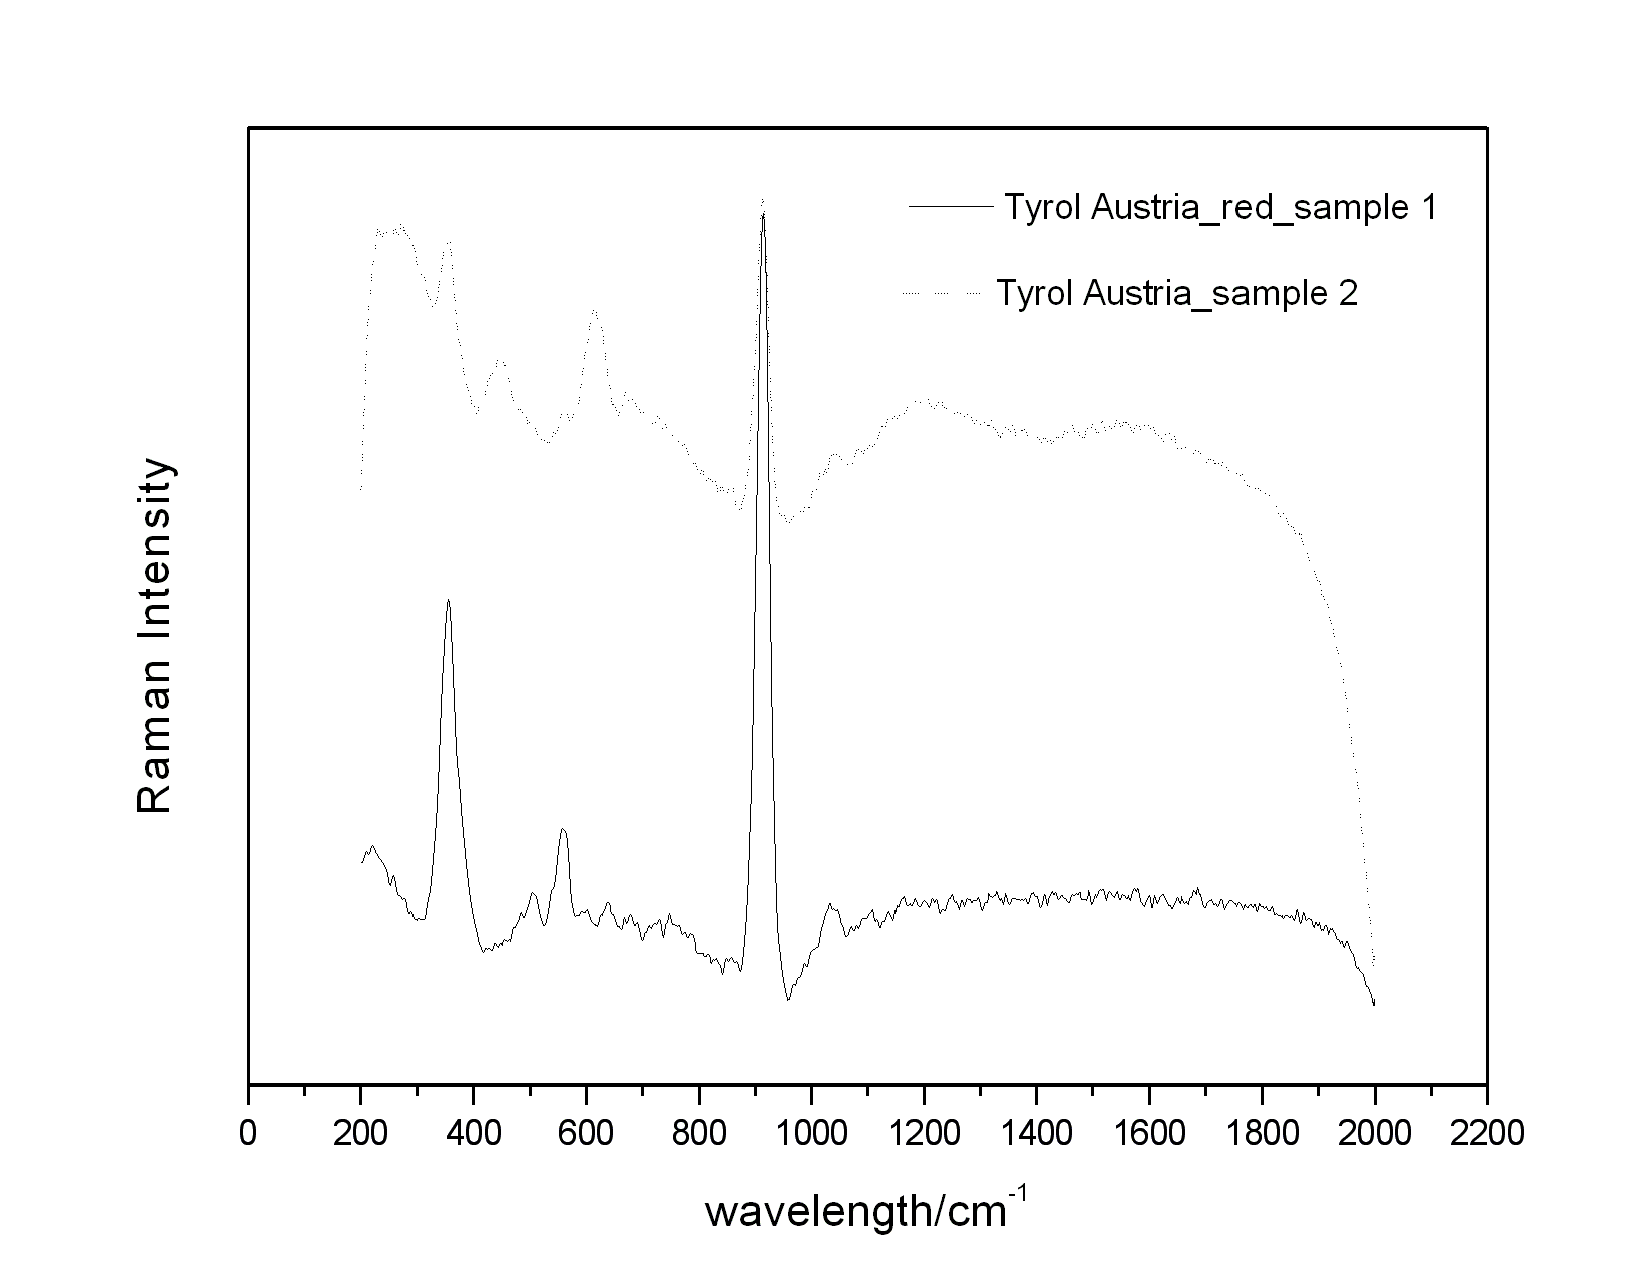 | Figure 1. The Raman spectrum of two almandine garnets from Tyrol (Austria) |
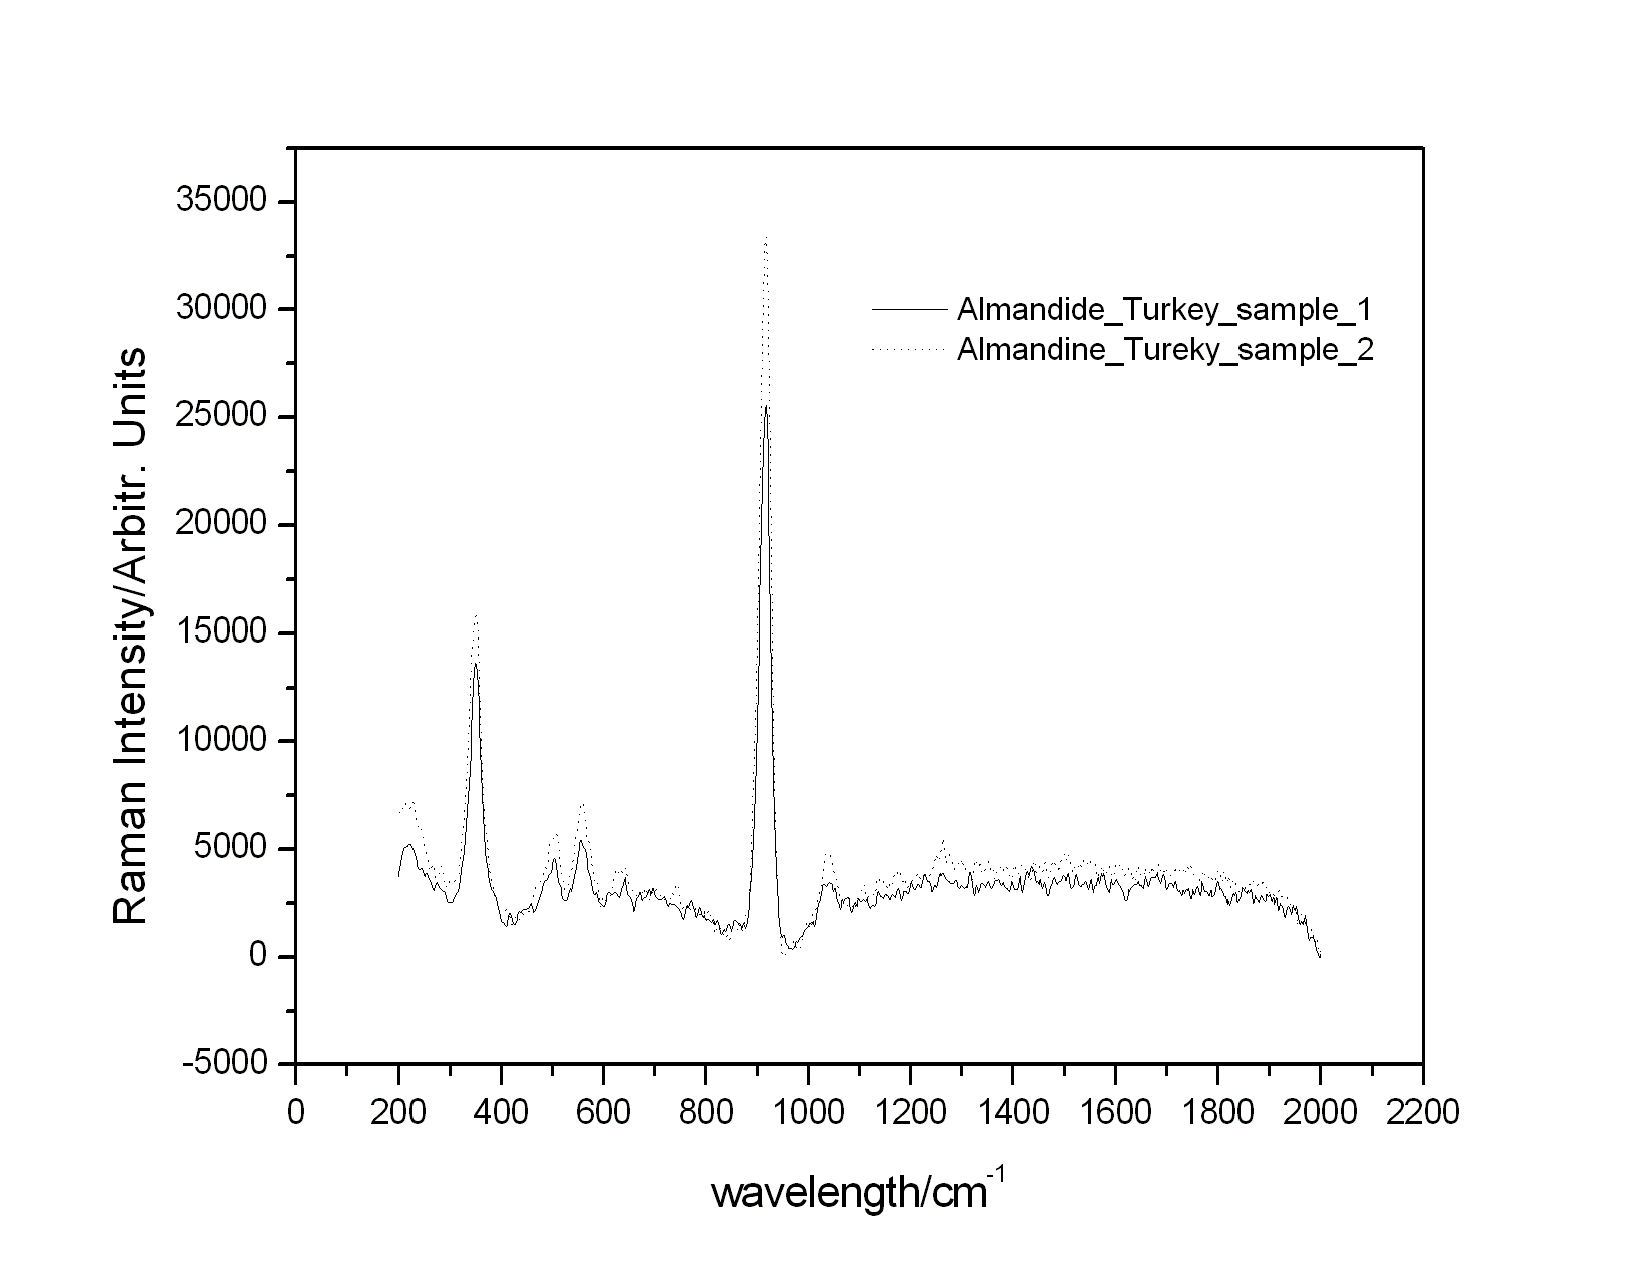 | Figure 6. The Raman spectrum of the Almandine sample from Turkey |
- The direction of the trend makes the resonance Raman effect unlikely, but raises the possibility that absorption of the Raman OH signal at 630–633 nm by the sample might be a factor. However, the Si-O emission in the 540 nm region is more strongly absorbed by the iron14. The Raman measurements of garnet samples were obtained at Ghent and Athens respectively. The grossular (tsavorite) from Tanzania has a very strong Raman peak at 1601 cm-1 which corresponds to the other sample of grossular from Greece at the same spectra position of 1601 cm-1. Additionally we have a very good comparison between the two obtained spectra at 374, to 374, 551 to 548, 1155 to 1158, 1348 to 1344, 1396 to 1399, 1521 to 1518, 1576 to 1576, 1601 to 1601, 1790 to 1796, 2064 to 2061 and 2250 to 2247 cm-1. (Table 1)These measurements made in Laboratory of University of Ghent with μ-Raman equipment. The grossular samples from Yakutia of Siberia and Santa Eulalia of Mexico were studied (Fig. 2) using the portable Raman Rockhound – Byzantine Museum and we take the following peaks in comparison: 177 to 173, 240 to 236, 267 to 270, 369 to 365, 537 to 537, 624 to 620, 820 to 824, 878 to 875 and 992 to 984 cm-1. (Table 1)The very strong Raman peaks in both of the spectra of the samples of Siberia and Mexico are at the positions of 369 cm-1 and 365 cm-1 respectively. The sample of andradite from Morocco gave us a different Raman behavior15,16 with the following peaks: 161, 357, 443, 510, 745, 812, 866, 980 cm-1 and we observed a very strong peak at 357 cm-1. Finally the four samples of almandine17-19 came two from Tyrol and two from Alabanda. In this case reported the distinctive Raman peaks at 354, 504, 557, 912, 1037 cm-1 for the two samples of almandine20-22 from Tyrol, Austria. We have observed in the measurements of the almandine from Turkey, by using two different spectrometers (Portable and μ-Raman) the bands at the following positions: 351, 508, 555, 638, 744, 917, 1039, 1177, 1263 cm-1 and 338, 494, 549, 910, 1035 cm-1. In both two cases the very strong bands are at 917 cm-1 (portable Raman) and 910 (μ-Raman) and in the samples from Tyrol (Fig. 1) the very strong peak observed at 912 cm-1. (see Table 1)The observed bands of 630, raises of the absorption of the Raman OH signal to the grossular from Mexico, Turkey and Siberia samples. However, the Si-O emission in the 540 nm region is more strongly absorbed by the iron for the samples from Greece and Turkey14(Fig. 6).
4. Conclusions
- In this research work we present a specific collection of garnets from different district as grossular, almandine and andradite. We used μRaman as a specific tool for identification and characterization of the samples. Additionally we compared the data from a portable Raman and a μRaman to the same samples. Our results give as the basic bands for the choice of the different samples and localities. It is very interesting our results, for the first time in bibliography, of the Kimmeria Mountains near Xanthi in Northern Greece and Alabanda, Aydin Province of Turkey, especially for the sample from Alabanda is the locality which is described by Gaius Pliny the Elder in the Historia Naturalis5.
References
| [1] | J.Spier, Late antique and Early Christian Gems, Wiesbaden, 2007. |
| [2] | Gubelin Gem Lab, Ltd., Jewellery News Asia, 2006; 7, 66. |
| [3] | C.W.King, A Natural History of Precious Stones and Precious Metals. Cambridge Press, London, 1867. |
| [4] | Caley R, Theophrastus On Stones, Ohio University Press, Chicago, 1956, p.p. 89, 91. |
| [5] | G.Pliny the Elder, Historia Naturalis, 36, XIII, 62. |
| [6] | P. Vandenabeele, Anal Bioanal Chem , 2010; 397, 2629. |
| [7] | D.Bersani, S.Andò, P.Vignola, G.Moltifiori, I.G.Marino, P.P.Lottici, V.Diella, Spectrochimica Acta Part A: Molecular and Biomolecular Spectroscopy 2009; 73, 484. |
| [8] | G.Rossman, Elements, 2009; 5, 159. |
| [9] | G.R.Rossman, F.Rauch, R.Livi, T.A.Tombrello, C.R.Shi, Y.Zhou, Neues Jahrbuch für Mineralogie Monatshefte, 1988, H4; 172. |
| [10] | G.R.Rossman, R.D.Aines, American Mineralogist, 1991; 76, 1153. |
| [11] | D.R.Bell, P.D.Ihingerand, G.R.Rossman, American Mineralogist, 1995; 80, 465. |
| [12] | E.H.Arredondo, G.R.Rossman, G.R.Lumpkin, American Mineralogist, 2001; 86, 485. |
| [13] | R.Thomas, American Mineralogist, 2000; 85, 876. |
| [14] | E.H.Arredondo, G.R.Rossman, American Mineralogist, 2002; 87, 307. |
| [15] | B.A.Kolesov, C.A.Geiger, Journal of Physics and Chemistry of Minerals, 1998; 25, 142. |
| [16] | B.A.Kolesov, C.A.Geiger, Journal of Raman Spectroscopy, 1997; 28, 659. |
| [17] | L.Wang, E.J. Essene, Y.Zhang, Contributions to Mineralogy and Petrology, 1999a; 135, 164. |
| [18] | L.Wang, E.J.Essene, Y.Zhang, American Mineralogist, 2000; 85, 41. |
| [19] | P.G.Manning, The Canadian Mineralogist, 1967; 9, 237. |
| [20] | F.Emiliani, G.Venturelli, The Canadian Mineralogist, 1972; 11, 464. |
| [21] | M.L.Crawford, The Canadian Mineralogist, 1977; 15, 243. |
| [22] | M.Pinet, D.C.Smith, Schweizerische Mineralogische & Petrographische Mitteilungen, 1994; 74, 161. |
| [23] | S.Greiff, A.Gerick., E.Ritz, T.Hager, Y.Junchang, in 35th International Symposium on Archaeometry 2005; 11, S4. |
| [24] | T.Bofa Ballaran, M.A.Carpenter, C.A.Geiger, A.Kozol, Journal of Physics and Chemistry of Minerals, 1999; 26, 554. |
| [25] | J.W. Anthony, R.A.Bideaux, K.W. Bladh, M.C.Nichols, Handbook of Mineralogy, Mineral Data Publishing, by permission of the Mineralogical Society of America, Tucson Arizona, 1990. |
 Abstract
 Reference
 Full-Text PDF
 Full-text HTML