D. Govindarajan 1, G. Jayalakshmi 1, R. Gopalakrishnan 2, A. Stancu 3
1Department of Physics, Annamalai University, Tamilnadu, India
2Department of Physics, SRM University, Kattankulathur, Tamilnadu, India
3Faculty of Physics, A1. I. Cuza ‘University, 11 Bd. Carol I, 6600, Iasi, Romania
Correspondence to: R. Gopalakrishnan , Department of Physics, SRM University, Kattankulathur, Tamilnadu, India.
| Email: |  |
Copyright © 2012 Scientific & Academic Publishing. All Rights Reserved.
Abstract
The present work deals with redmud were calcined at different temperatures ranging from 30℃ and 1000℃ for 1 hour in furnace and characterised by First order reversal curve (FORC). The magnetic hysteresis parameters as a function of temperature were determined from the FORC curves. The test results indicate good reactivity was observed till a temperature of 900℃, after which it started declining.
Keywords:
Redmud, Coercivity, Different Temperature
Cite this paper:
D. Govindarajan , G. Jayalakshmi , R. Gopalakrishnan , A. Stancu , "Fist-order reversal curve Study on Calcined Indian Redmud", International Journal of Materials and Chemistry, Vol. 2 No. 4, 2012, pp. 123-127. doi: 10.5923/j.ijmc.20120204.01.
1. Introduction
Redmud is a solid waste product discharged in Al2O3, smelting as well as the largest pollutant from Al2O3 production. The name derives from its colour, for it is similar in appearance to red-colour med[1]. Large amounts of redmud are piled up in outside storage yards, causing environmental pollution, soil basification, paludification, surface water and ground water pollution as well as resource pollution. The effective recycling and safe treatment of redmud has become a serious problem. Some efforts have been made to treat the redmud by producing cement or making bricks by recycling useful materials from the redmud[2]. But these methods have in general not been intensively applied.The alkaline nature of redmud makes it a potential acid-neutralizing agent[3]. Redmud has also been found to have strong binding capacity for heavy metal and therefore can be used for remediation of heavy metal contaminated soils[4]. Bayer process redmud and their environmental applications have received substantial research[5].Calcination is one of the best ways for recycling the red mud. FORC diagrams are more convenient because they do not require the magnetization to be measured in a remanent state. FORC diagram also gives information about coercive field distribution and the ratio of the reversible and irreversible magnetization processes in the sample. The study of hysteresis loops can produce significant dynamical information, but it reduces the often complex dynamics of magnetization reversal to only a few quantities, usually the hysteresis loop area and the coercive field. The first-order reversal curve (FORC) method was recently developed[6] to extract more information from experiments on magnetic systems. It has produced interesting results, mostly in systems with strong disorder in the physics of magnetism[7].Fist order reversal curves diagram for soft magnetic materials were reported by Fecioru- Morariu and Stancu[8]. Micromagnetic and Preisach analysis of the First order Reversal curves diagram were proposed to Stancu etal.,[9] and explain the single – domain ferromagnetic particle systems. FORC analysis of Ni (SiO2) nanogranular film in the blocked regime was reported by Lavin et al.,[10] and explained the magnetic measurements as function of temperature. A simple approach to the first order reversal curves of two phase magnetic systems were reported by Panagiolopoulos[11] and explained the biasing field as well as coercivity of magnetic systems. XRD, FTIR and microstructure studies of calcined sugarcane Bagasse ash was reported by Govindarajan and Jayalakshmi[12]. He was concluded the temperature increases, the sugarcane Bagasse ash colour changes from black to grey and white, which indicates that the carbon content present reasonably reduced, in the sugarcane Bagasse ash. However little has been done to redmud that is derived or partially derived from calcinations methods. In this paper, we report on calcinations of redmud investigated for the first time with the FORC method and correlation between coercivity and hysteresis loops.
2. Materials and Experimental Methods
2.1. Material
The original redmud sample was provided by NALCO, Orrissa, India.
2.2. Experimental Methods
The samples in small amounts were heated in muffle furnace at different fixed temperatures (for 1 hour) ranging from 30℃ to 1000℃). The samples were named as RM, RM 500℃, RM 600℃, RM 700℃, RM 800℃, RM 900℃ and RM 1000℃. RM means the redmud sample heated at 30℃, RM 500 means the redmud samples heated at 500℃ etc., The hysteresis parameters of thermally treated redmud samples were recorded at room temperature and the FORC were recorded under a sinusoidal waveform of amplitude E0 = 2.5 Kv/mm and frequency f = 1 Hz, using a modified sawyer – Tower circuit.
2.3. Chemical Analysis
Chemical analysis of the original redmud yielded weight percentages values were Al2O3 (43.75%), Fe2O3 (28.25%), TiO3 (1.89%), SiO2 (2.08%) and LiO2 (23.1) respectively.
3. Results and Discussion
3.1. Hysteresis Parameter
FORC’S were measured in redmud samples at different temperatures upto 1000℃. The corresponding hysteresis loop and the FORC diagrams were shown in Figs 1-14. The standard hysteresis properties Saturation magnetization (Ms (emu)), Remanent magnetization (Mr (emu)), coercivity (Hc (Oe)), Squareness of the hysteresis loop (S), Saturation of the mass unit of the sample (Ms (emu/g)), and Remanent moment of the mass unit of the sample (Mr (emu/g)) of redmud at different temperatures were measured and reported in table 1.1.The FORC diagram provides a detailed characterization of the hysteric response of a system because it evidences dominant magnetic interactions, magnetic effects and the annihilation of memory during the demagnetization process. The hysteresis parameter Ms, Hc, and Mr were directly obtained from the FORC measurements. It must be realized that determining the hysteresis parameters from FORC measurements may give slightly different values to those determined from standard hysteresis measurements because of differences in field history[13]. 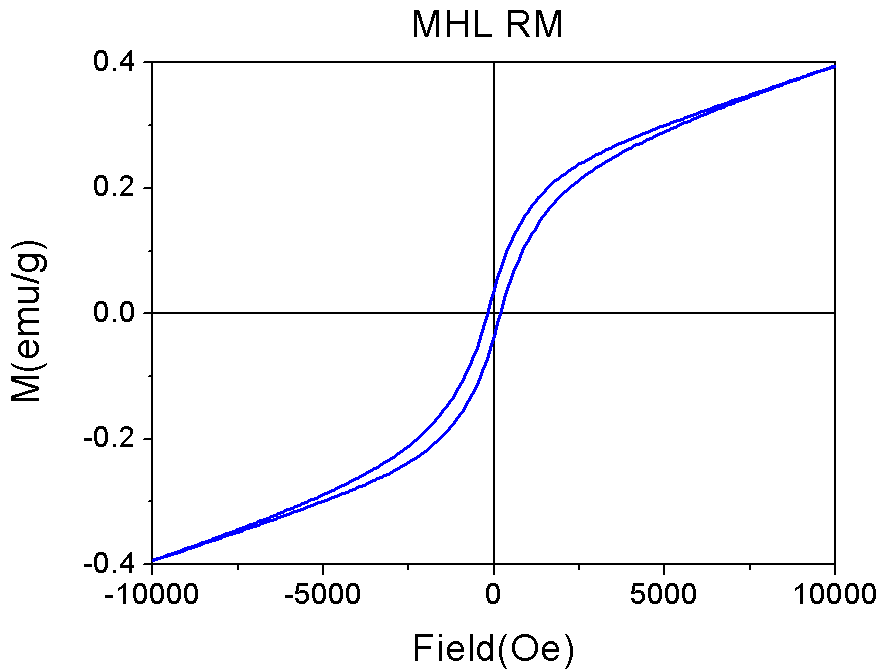 | Figure 1. Hysteresis loop of calcined redmud at room temperature (30℃) |
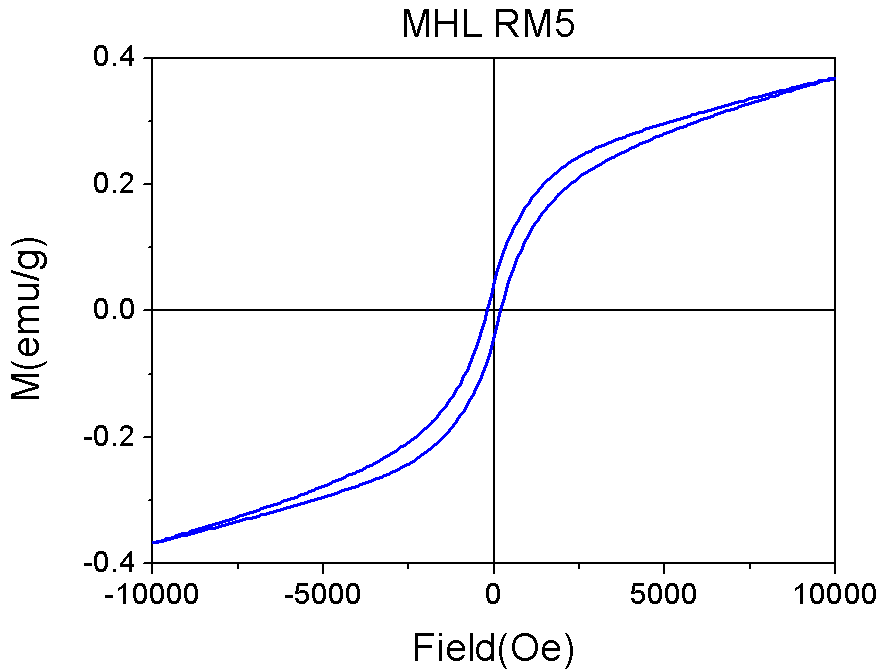 | Figure 2. Hysteresis loop of calcined redmud at 500℃ |
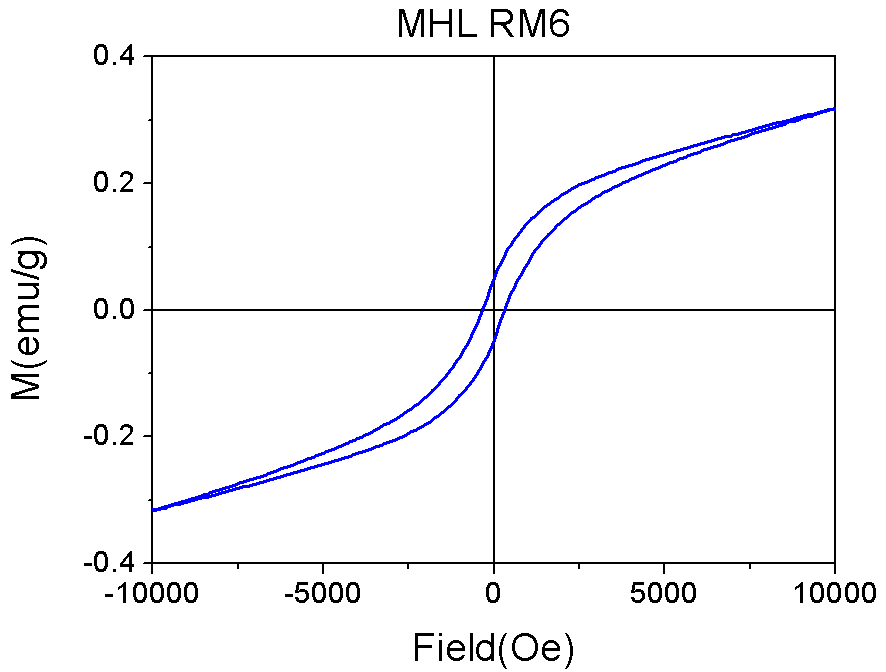 | Figure 3. Hysteresis loop of calcined redmud at 600℃ |
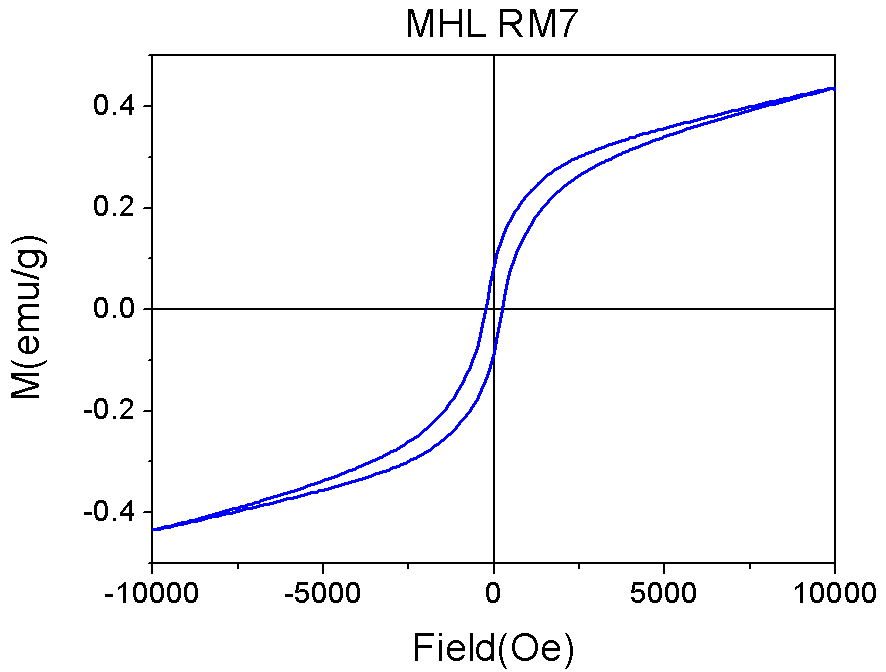 | Figure 4. Hysteresis loop of calcined redmud at 700℃ |
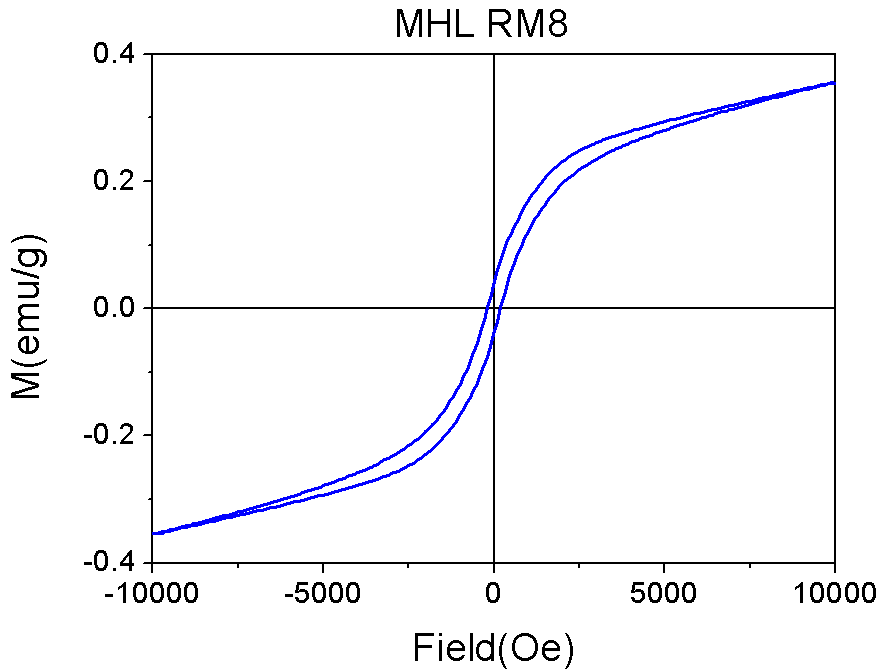 | Figure 5. Hysteresis loop of calcined redmud at 800℃ |
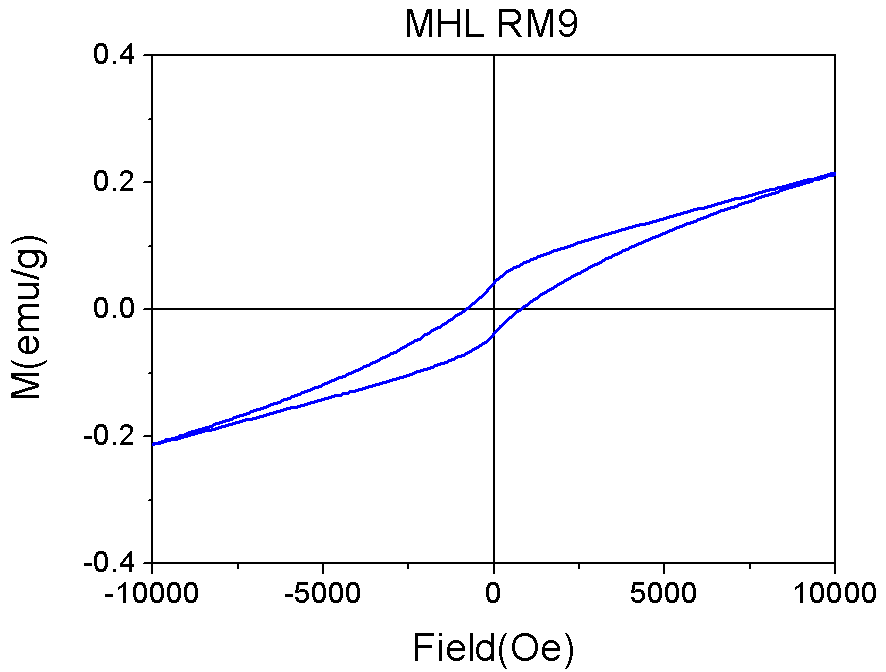 | Figure 6. Hysteresis loop of calcined redmud at 900℃ |
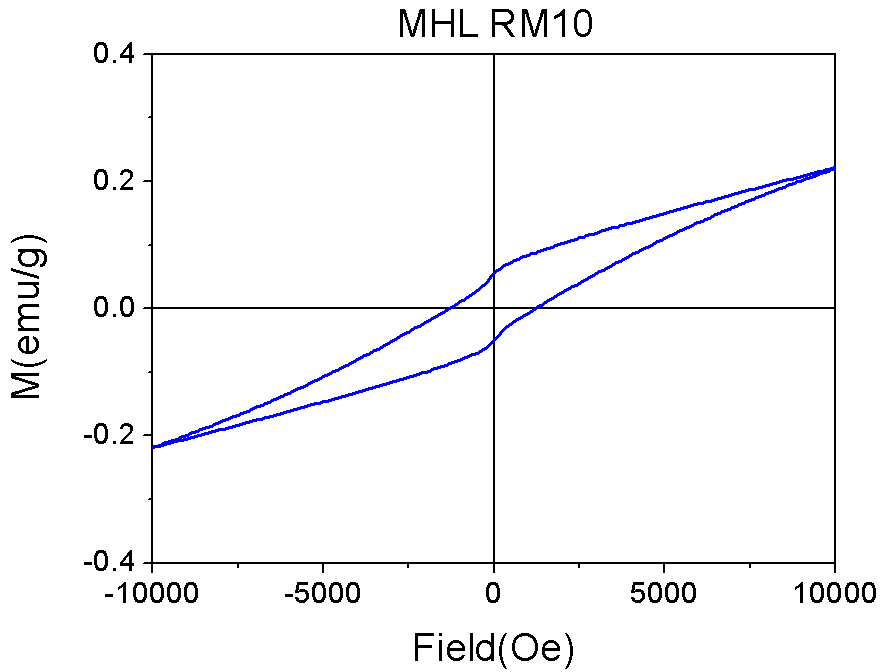 | Figure 7. Hysteresis loop of calcined redmud at 1000℃ |
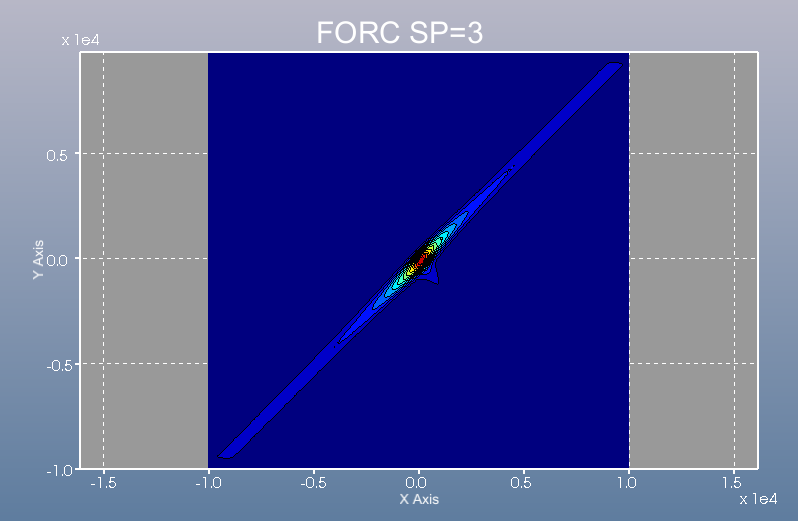 | Figure 8. FORC diagram of calcined redmud at room temperature |
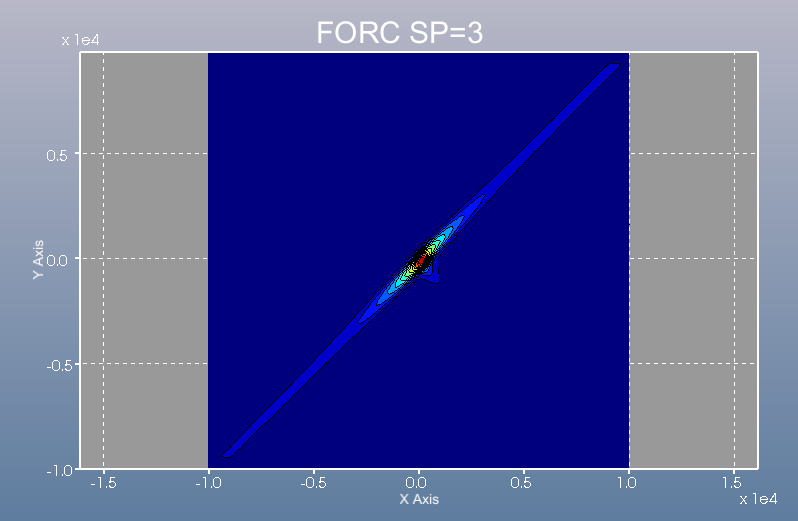 | Figure 9. FORC diagram of calcined redmud at 500℃ |
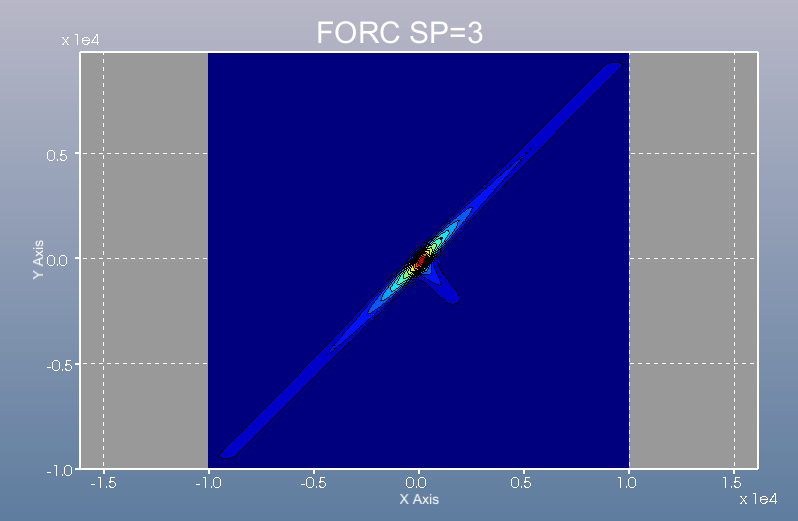 | Figure 10. FORC diagram of calcined redmud at 600℃ |
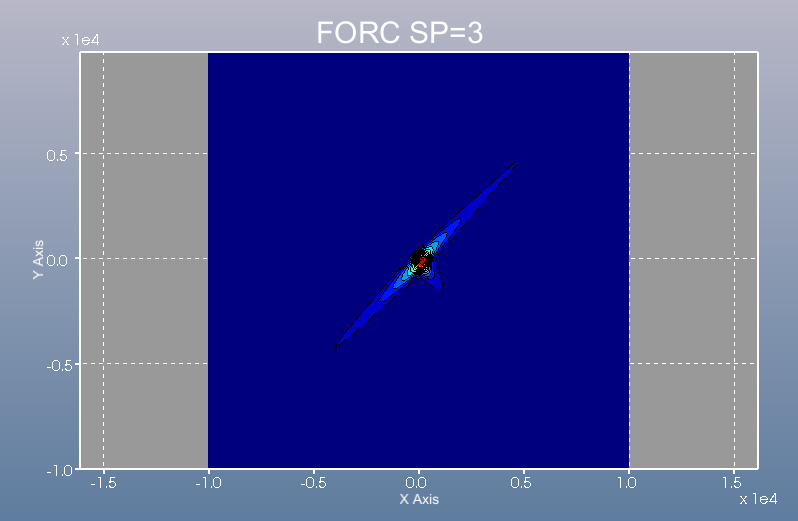 | Figure 11. FORC diagram of calcined redmud at 700℃ |
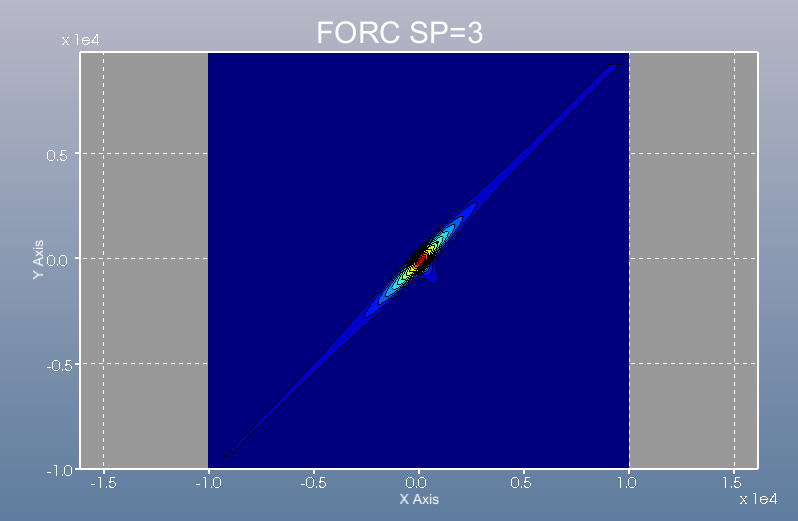 | Figure 12. FORC diagram of calcined redmud at 800℃ |
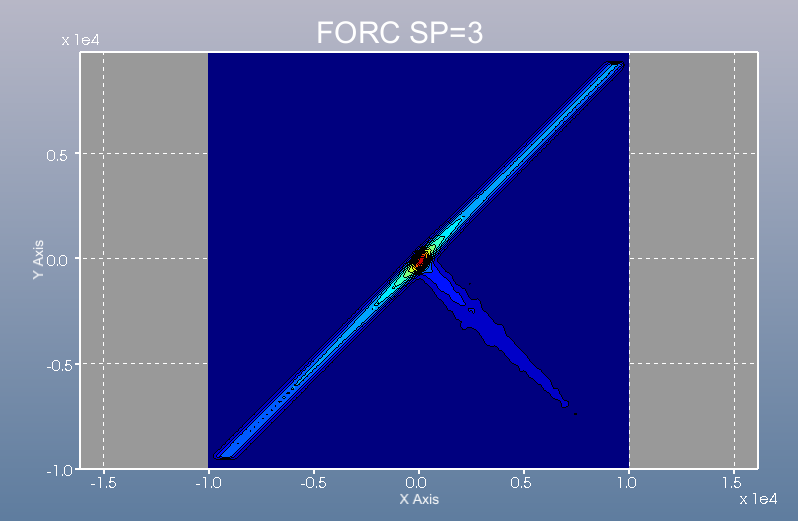 | Figure 13. FORC diagram of calcined redmud at 900℃ |
| Table 1.1. Hysteresis loop parameters of Redmud samples at different temperatures |
| | Name | mass(g) | Ms(emu) | Mr(emu) | Hc(Oe) | S | Ms(emu/g) | Mr(emu/g) | | RM | 4.80E-02 | 1.89E-02 | 1.80E-03 | 1.79E+02 | 0.10 | 3.94E-01 | 3.76E-02 | | RM5 | 4.35E-02 | 1.60E-02 | 1.93E-03 | 1.97E+02 | 0.12 | 3.68E-01 | 4.45E-02 | | RM6 | 6.56E-02 | 2.08E-02 | 3.18E-03 | 3.20E+02 | 0.15 | 3.17E-01 | 4.85E-02 | | RM7 | 8.40E-02 | 3.66E-02 | 7.14E-03 | 2.33E+02 | 0.19 | 4.36E-01 | 8.50E-02 | | RM8 | 5.58E-02 | 1.98E-02 | 2.29E-03 | 1.97E+02 | 0.12 | 3.55E-01 | 4.12E-02 | | RM9 | 7.95E-02 | 1.70E-02 | 3.24E-03 | 8.07E+02 | 0.19 | 2.14E-01 | 4.08E-02 | | RM10 | 8.52E-02 | 1.88E-02 | 4.49E-03 | 1.26E+03 | 0.24 | 2.20E-01 | 5.27E-02 |
|
|
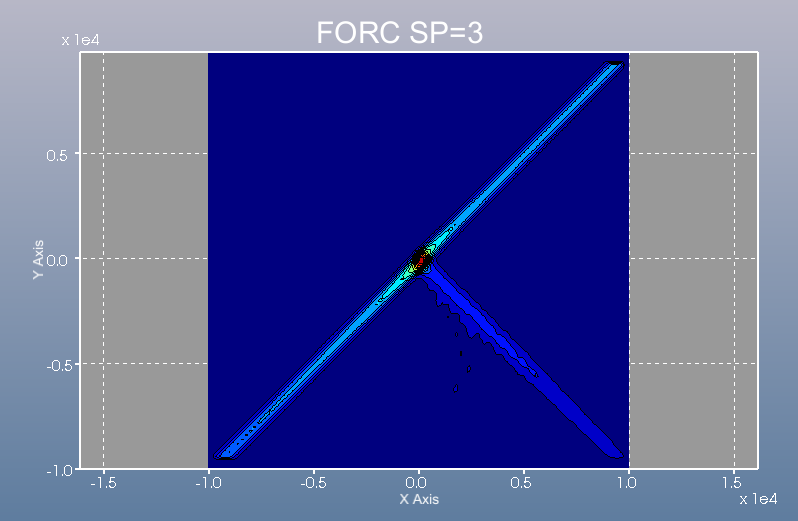 | Figure 14. FORC diagram of calcined redmud at 1000℃ |
3.2. FORC Measurement
Fig. 1-7 Shows the study of hysteresis loop of FORC diagram measured on calcined redmud samples. The figures clearly indicate the superior and prominent minerals of hematite are existing in the redmud samples. The ability of FORC diagrams to give a better description of grain size distribution and magnetic mineralogy.On heating the redmud samples at temperature 600℃ (Fig. 10), the FORC distributions contract toward the origin, but do not change significantly in shape or appearance until 500℃ (Fig.9). If the contraction is primarily related to the decrease in Hc, then this implies that the dominant domain structure does not change significantly with temperature[14]. The room temperature calcined redmud FORC diagram (Fig. 8) is asymmetrical, although the Asymmetry decreases with temperature. The FORC distributions change markedly with increasing the temperature (Fig 11-14). In addition all FORC distribution strong asymmetry.
3.3. Coercivity Vs Temperatures
A FORC diagram is a contour plot that contains information regarding magnetostatic particle interaction and domain state. The domain state of a particle depends on the particle size. The ratio of Mr/Ms yield information of magnetic domain[15]. The table (1.1) indicates a single domain value of 0.1-0.2. This region clearly indicates the magnetic state of redmud samples are pseudo – single domain and the particle size is 0.1-20 microns. Fig. 15 shows coercivity Vs different temperatures derived FROM forc diagrams.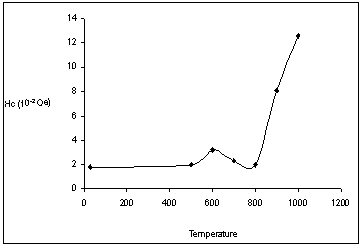 | Figure 15. Hc Vs temperature of redmud sample |
The coercivity i.e., the width of the thermal hysteresis loop, reflects the strength of intradomain interactions[16]. Low coercivity values can appear upto 500℃ calcined redmud. The temperature at 600℃ of redmud has optimum Hc compared to other calcined redmud samples. Sudden decrease of Hc is appeared at 800℃. The rate of decrease is not constant, suggesting thermofluctuation effects are not significant at most temperature[17]. Higher values of Hc are present at 900 and 1000℃ calcined redmud samples. Higher values of coercivity indicate the particles interactions are high.
3.4. Squareness Vs Temperature
The squareness of the hysteresis loop (Mr/Ms) Vs different temperature of redmud samples are shown in Fig. 16.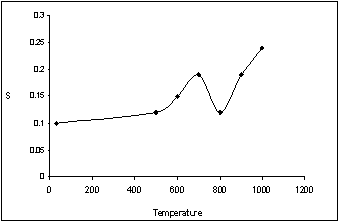 | Figure 16. S Vs temperature of redmud sample |
The squareness of the hysteresis loop (Mr/Ms) values are increases up to 700℃ calcinations of redmud. calcination of 1000℃redmud sample having a higher value of Mr/Ms. For the calcinations of 800℃, Mr/Ms display a sharp decrease compared to other redmud samples. The most likely cause of this is chemical alteration during heating. It is known that the ratio between the remanent and saturation magnetization in a redmud sample is an indicator of the importance of the reversible processes[18]. The hysteresis loops of each calcinations redmud samples were rectangular and completely characterized by the values of saturation magnetic moment Ms.
4. Conclusions
The calcination of red mud was studied in this work by FORC Technique. Force diagrams appear to be a promising tool for developing an understanding of the magnetic grain size distribution of bulk natural redmud samples at elevated temperatures. The FORC diagram results showed that calcined redmud have been good reactivity upto 900℃ and the single domain value is 0.1-0.2. This region clearly indicates the magnetic state of redmud samples are pseudo – single domain and the particle size is 0.1-20 microns. The moderate reactivity up to 900℃ makes the redmud useful as an inert component in the fabrication of traditional clay-based ceramics, such as tiles and brikes, which are usually fired at temperature lower than 1000℃.
References
| [1] | W. Xing, Q. Yuan-yuan, H. Wei-Wei, C. Jie, Z. Xue-yi, W. Miao, J. China. Univ. Mining &Tech. 18 (2008) 0266-0270. |
| [2] | M.S. Vincenzo, C. Renzo, J. Europ. Cerm. Soc., 20 (2000) 245-252. |
| [3] | K. E. Snars, R.J. Gilkes and M.T.F. Wong, Aust. J. Soil. Res., 42 (3), (2004), 321-328. |
| [4] | O. Lin, M.W. Clark, D. McConchie, G. Lancaster and N. Ward, Aust. J. Soil. Res., 40 (2002) 556-563. |
| [5] | H.S.Altundogan, S. Altundogan, F. Tumen and M. Blldik, Wast. Mang., 22(3), 92002) 357-363. |
| [6] | T.R.F. Peixoto, D.R. Cornejo, J. Mag. Magnetic Mat., 320 (2008) e279-e282. |
| [7] | P.G. Bercoff, M.I. Oliva, E. Broclone and H.R.Bertorello., Physica B., 320 (2002) 291. |
| [8] | M. F. Morariu, A. Stancu., J.Opto electronics and Adv. Mat., 5(4) (2003) 939-944 |
| [9] | A. Stancu, C. Pike, L. Stoleriu, P. Postolache and D. Cimpoesu, J. Appl. Phys., 93(10), (2003) 6620-6622. |
| [10] | R.Lavin, C.Farias, J.C.Denardin, J.Magnetism and Mag. Mat., 324(10), (2012) 1800-1803. |
| [11] | I. Panagiotopoulos, J.Magnetism and Mag. Mat., 322 (16), 2011, 2148-2153. |
| [12] | D.Govindarajan, G.Jayalakshmi. Adv. Appl.Sci.Res., 2(3), 2011, 544-549. |
| [13] | G. Bertotti, Hysteresis in Magnetism, Acadamic Press, London, 1998, 558 pp. |
| [14] | A.R. Muxworthy, D.J. Dunlop, Earth. Plant. Sci. Lett., 203 (2002) 369-382. |
| [15] | C. Carvallo, A.R. Muxworthy, D.J. Dunlop, W.Williams, Earth. Plant. Sci. Lett., 213 (2003) 375-390. |
| [16] | C. Enachescu, R. Tanasa, A. Stancu, E. Codjovi, J. Linares, F. Varret, Physica B .,343 (2004) 15-19. |
| [17] | D.J. Dunlop, M.M. Bina, Geophys. J. R. Astron. Soc., 51 (1977) 121-147. |
| [18] | R. Tanasa, C. Enachescu, A. Stancu, F. Varret, J. Linares, E. Codjovi., Polyhedron, 26 (2007) 1820-1824. |


 Abstract
 Reference
 Full-Text PDF
 Full-Text HTML