-
Paper Information
- Next Paper
- Previous Paper
- Paper Submission
-
Journal Information
- About This Journal
- Editorial Board
- Current Issue
- Archive
- Author Guidelines
- Contact Us
International Journal of Materials and Chemistry
2012; 2(3): 90-100
doi: 10.5923/j.ijmc.20120203.02
Statistical Thermodynamic Analysis for Isothermal Hydrogenation Performances of Mg2-yPryNi4Intermetallics (y = 0.6, 0.8, 1.0)
Nobumitsu Shohoji
LNEG , Laboratório Nacional de Energia e Geologia (NationalLaboratory for Energy and Geology)
Correspondence to: Nobumitsu Shohoji , LNEG , Laboratório Nacional de Energia e Geologia (NationalLaboratory for Energy and Geology).
| Email: |  |
Copyright © 2012 Scientific & Academic Publishing. All Rights Reserved.
Isothermal hydrogenation performances of intermetallic Mg2-yPryNi4 alloys with y = 0.6, 0.8 and 1.0 reported by Terashitaet al.were analyzed on the basis of statistical thermodynamics under a simplifyinga priori assumption of constant nearest neighbourH-H interactionE(H-H) in a given phase at arbitrary T aiming at characterizing basic aspects of state of H atoms in the interstitial sites in H-storage alloy. To fulfill this a priori assumption, number θ of available interstitial sites per metal atom was chosen by preliminary search attempt at the onset of the statistical thermodynamic analysis. Primary H solution in Mg2-yPryNi4 was analyzed by the model with θ = 0.15. The chosen value 0.15 for the model analysis was close to be 1/6 (≈ 0.167) which was half of 1/3 (=[Mg + Pr]/[Mg + Pr + Ni])implying that about half of the (Mg + Pr)-related interstitial sites were provided as the available sites for occupation by H atoms in the primary H solution of Mg2-yPryNi4. On the other hand, hypo-stoichiometric M4H3 type hydride of Mg2-yPryNi4 was analyzed by the model with θ = 0.75 and θ' = 0.333 where ' refers to the lower limiting composition of the phase. This model yielded situation with E(H-H) = 0 for any Mg2-yPryNi4examined. Chosen value of θ' = 0.333 appeared to imply that the filling of Ni-related interstitial sites by H atoms started after preferential full occupation of the (Mg + Pr)-related interstitial sites by H atoms in the two-phase equilibrium range at invariable p(H2) plateau during H-charging.
Keywords: (Mg,Pr)2Ni4intermetallics, Hydrogenation, Non-Stoichiometry, Interstitial Solid Solution, Statistical Thermodynamics
Article Outline
1. Introduction
- Hydrogen (H) storage alloys are of strategic importance towards development of H-based energy systems with zero-CO2 emission. In this context, many researchers have been investing efforts to discover adequate alloy composition to allow high H-storage capacity with favorable absorption/desorption performances. In a recent publication, Terashitaet al.[1] reported isothermal hydrogenation performances of ternary intermetallic compounds Mg2-yPryNi4 (0.6 ≤ y ≤ 1.4) that is considered as one of candidate H-storage alloys. In their publication, pressure-temperature-composition(PTC)relationships on H-charging/discharging cycle is presented as isotherms on P-C coordinate (log p(H2) vs. x = H/M; M = Mg2-yPryNi4; p(H2): partial pressure of H2 gas) for alloys with y = 0.6, 0.8 and 1.0 that maintained crystalline lattice structures during H-charging/discharging cycle (cf. Table 2in Ref.[1]). For the Mg2-yPryNi4 alloys with y = 1.2 and 1.4, amorphizationprogressed during H-chargingand thence alloys with these compositions had to be disregarded as reversible H-storage alloyand, as such, PCisotherm for the alloys with y = 1.2 and 1.4 was not reported in Ref.[1].In metal-hydrogen (M-H) systems, hysteretic performanceis a commonplace rather than exceptionin H-absorption/desorption cycle. In simplifying model for hysteresis of M-H system, hysteresis is presented for plateau levels of p(H2) representing transition between primary solid solution phase of H in M and higher hydride phase designating the equilibrium H2 gas pressure p(H2)f for the hydride formation during ascending p(H2) and the equilibrium H2 gas pressurep(H2)d for dissociation of the hydride during descending p(H2) where p(H2)f>p(H2)d[2]. In such simplifying model for hysteresis of M-H system, PCisotherm in single-phase region on H-charging and that on H-discharging are considered to be comparable to one another assuming reversible nature of the H-absorption/desorption processes in single-phase regions (e.g., Fig. 1 and Fig. A1 in Ref.[2]).Nevertheless, all the PCisotherms reported forthe Mg2-yPryNi4 alloyswith y = 0.6, 0.8 and 1.0 by Terashitaet al.[1] show clearly the hysteretic performance in the single-phase regions as well as in the two-phase region yielding plateaus for distinguishablep(H2)f and p(H2)d. Thus, in the present work, PTC relationships reported forthe single-phase regions of the Mg2-yPryNi4 alloys with y = 0.6, 0.8 and 1.0 by Terashitaet al.[1] were analyzed by statistical thermodynamics for the absorption process and for the desorption process separately for respective isotherms aiming at identifying the possible causes leading to hysteretic performance forH dissolution in the Mg2-yPryNi4 alloy lattice.Basic principles for statistical thermodynamic analysis are provided in a classical textbook authored by Fowler and Guggenheim[3] and desired thermodynamic parameter values of the calculation might be retrieved from NIST-JANAF Thermochemical Tables[4]. In statistical thermodynamic approach, PTC relationships in single-phase region are analyzed to derive atomistic interaction parameter values in a given phase while range of composition where two phases are co-existing (i.e., plateau p(H2) regime in isothermal plot of PC relationship) cannot be handled by statistical thermodynamics unlike by conventional thermodynamics.Statistical thermodynamic analyses were made for extensive range of MHx and MZzHx under standardized a priori assumption of constant nearest neighbor (n.n.)H-H interaction energy E(H-H) within a phase at respective temperature T where M might be pure metal or substitutional alloy of type A1-yBy and Z refers to another interstitial element besides H[5-23]. At the onset of the statistical thermodynamic analysis, number θ of interstitial sites available for occupation by H atoms per M atom is chosen to fulfill the a priori assumption of constant E(H-H) within a phase by trial-and-error plotting ofA(x,T) ≡ RT ln {[p(H2)]1/2·(
 - x)/x} against xat an arbitrary Tto find θ value yielding linear A(x,T) vs. x relationship in which slope of the plot refers to E(H-H) as explained in some detail later in Chapter 2. There is no firstprinciple-based justification for validity of the a priori assumption of constancy of E(H-H) within a phase at arbitraryT on the statistical thermodynamic modelling. In fact, in some earlier statistical thermodynamic analyses made for interstitial non-stoichiometric compounds MXx by other authors,
  was assumed arbitrarily on the basis of crystal lattice structure consideration and, when slope change of A(x,T) vs. x plot with composition x was detected, it was accepted as the inherent variation of E(X-X) with respect to composition x.Normally, E(X-X) tended to become less attractive on going from dilute range of X to higher X concentration range in the same phase MXxin such evaluation and this trend was appreciated as the consequence of rising elastic strain in the lattice with increasing x in the same phase. However, noting the reality that phase change even between liquid and solid is involved with enthalpy difference of up to mere 20 kJ·mol-1(e.g., Ref.[4] and Fig. 1 in Ref.[24]), it would be more natural and straightforward to accept that change in E(X-X) of non-stoichiometric interstitial compound with x at a given Twould end up with phase transformation rather than being maintained in a specified crystal lattice structure. Further, set of statistical thermodynamic interaction parameter values estimated on the basis of the simplifying a priori assumption of constant E(H-H) for extensive range of metals and alloys appear to be self-consistent among themselves[5-24].Thus, in this work, PC isotherms reported for the Mg2-yPryNi4 alloys with y = 0.6, 0.8 and 1.0 by Terashitaet al.[1] are analyzed on the basis of statistical thermodynamics with thea priori assumption of constant E(H-H) within a phase at arbitraryT.
2. Statistical Thermodynamic Analysis
- Noting the realitythat the statistical thermodynamic analysis procedure is not so widely known as the conventional thermodynamic analysis procedure among materials researchers, essence of the statistical thermodynamic analysis procedure is reviewed briefly in the following.In the statistical thermodynamics, partition function PF for condensed phase (either solid or liquid) under consideration is composed taking into account pairwise nearest neighbor atomic interactions E(i-j) between the constituents, i and j. Then, chemical potential μ (i)c of the constituent element i in the condensed phase is derived through partial differentiation of PF with respect to the number ni of the constituent element i. Subsequently, μ (i)c in the condensed phase is put equal to μ (i)g of the same element i in the gas phase.The expression for μ (X)gof ideal diatomic gas X2 is readily made available in the classical textbook authored by Fowler and Guggenheim[3]. The detailed derivation procedure of μ (X)c for the condensed phase MXx might be referred to elsewhere[7,11].Anyway, the statistical thermodynamic equilibrium condition is eventually reduced to the following Eq.(1) for the purpose of analyzing H solution under consideration[5-23]
 | (1) |
 | (2) |
 | (3) |
 | (4) |
 | (5) |
3. General Features of the PC Isotherms for H Solutions in Mg2-yPryNi4Alloy Lattice (y = 0.6, 0.8 and 1.0)
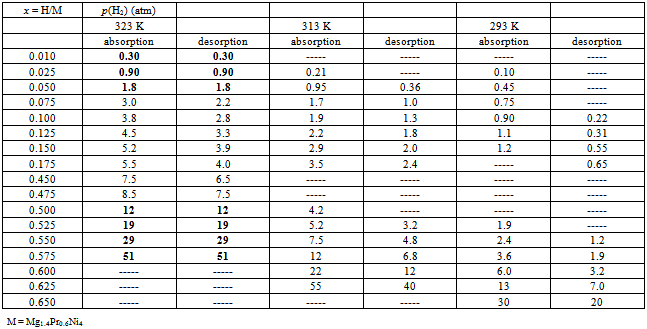
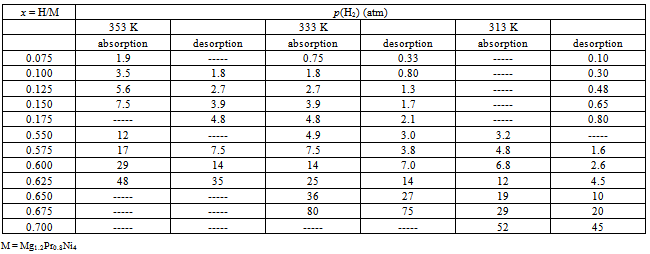
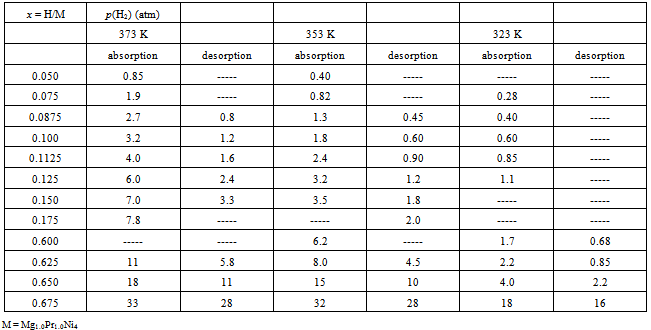
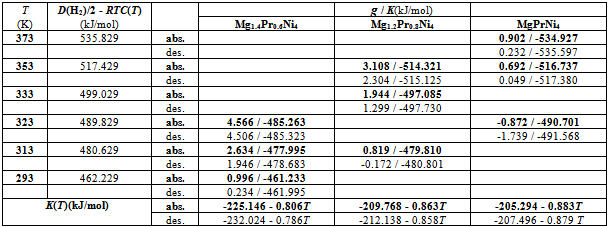
- To carry out statistical thermodynamic analysis for the MHxlattice, it was desirable to convert the graphically presented PC isotherms for the Mg2-yPryNi4 alloys by Terashitaet al.[1]into numerical tables as summarized in Tables 1 (for y = 0.6), 2 (for y = 0.8) and 3 (for y = 1). The data were read from magnified PC isotherms presented in Ref.[1] as Figs. 3-5 by cutting the mesh of x (= H/M) with interval 0.025 to read p(H2) value while finer mesh interval 0.0125 was taken partially for primary H solution range in MgPrNi4 to acquire sufficient number of data points for the analysis. With this procedure, introduction of certain extent of error in reading the experimental data presented in graphical form is inevitable but, as p(H2) enters in the calculation formula of Eq.(1) in form of log[p(H2)]1/2, the error margin introduced by the graphical data reading into the calculation results must remain relatively small being held in acceptable level.
|
|
4. Analysis for Primary H Solution in Mg2-yPryNi4Lattice (x< 0.2; y = 0.6, 0.8 and 1.0)
- To commence statistical thermodynamic analysis process, adequate value for θ must be chosen first of all. A trial-and-error test for evaluating A vs. x relationships defined by Eq.(1) was done using sets of data for Mg1.4Pr0.6Ni4 at T = 323 K in the range ofx< 0.2 listed in Table 1. This set of data showed the smallest extent of hysteresis between the H absorption and the H desorption processes.
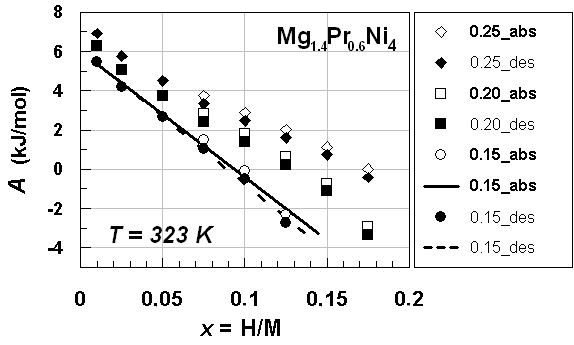 | Figure 1. A vs. x relationships estimated for isothermal PC data at T = 323 K forprimary H solution in Mg1.4Pr0.6Ni4 alloy lattice on H-absorption and on H-desorption (Table 1) with different choices of θ parameter value.Best-fit linear relationships were calculated using all the data points plotted herein |
 | (6) |
 | (7) |
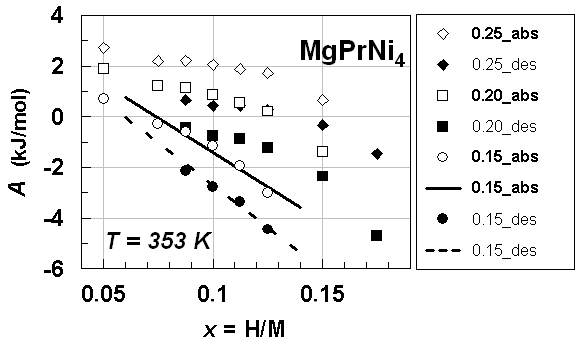 | Figure 2. A vs. x relationships estimated for isothermal PC data at T = 353 K forprimary H solution in MgPrNi4 alloy lattice on H-absorption and on H-desorption (Table 3) with different choices of θ parameter value, Best-fit linear relationships were calculated excluding the data points at x = 0.05 |
 | (8) |
 | (9) |
|
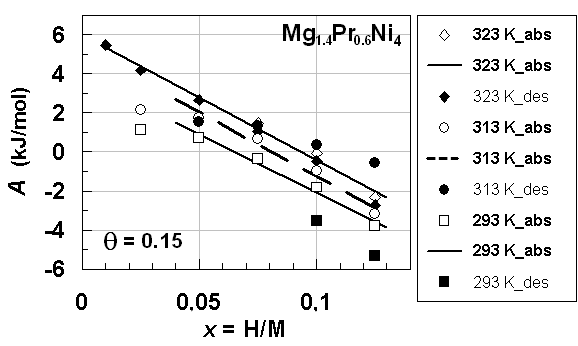 | Figure 3. A vs. x relationships estimated for isothermal PC data at different T forprimary H solution in Mg1.4Pr0.6Ni4 alloy lattice on H-absorption and on H-desorption (Table 1) with θ =0.15.Best-fit linear relationship at T = 323 K on H-absorption was calculated using the all data points plotted herein whereas best-fit linear relationships at T = 313 K and 293 K on H-absorption were calculated excluding the data points at x = 0.05 |
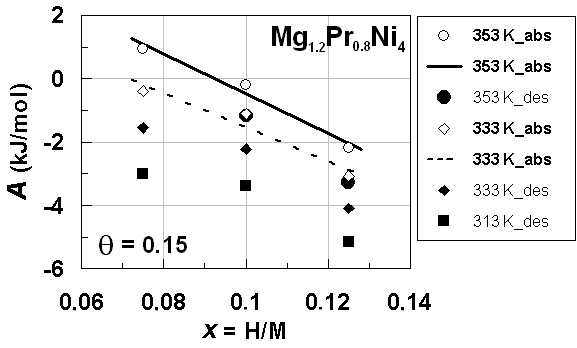 | Figure 4. A vs. x relationships estimated for isothermal PC data at different T forprimary H solution in Mg1.2Pr0.8Ni4 alloy lattice on H-absorption and on H-desorption (Table 2) with θ =0.15.Best-fit linear relationships at T = 353 K and 333 K on H-absorption were calculated using the all data points plotted herein |
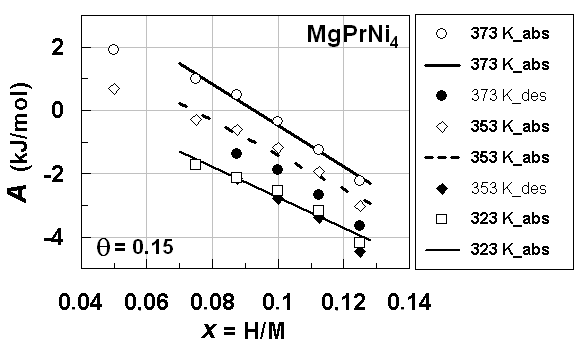 | Figure 5. A vs. x relationships estimated for isothermal PC data at different T forprimary H solution in MgPrNi4alloy lattice on H-absorption and on H-desorption (Table 3) with θ =0.15.Best-fit linear relationships at T = 373 K and 353 K on H-absorption were calculated excluding the data points at x< 0.05 |
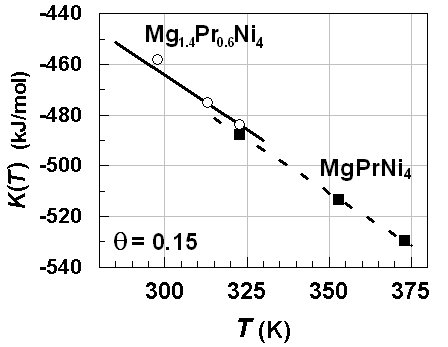 | Figure 6. K vs. T relationships estimated for primary H solutions in Mg1.4Pr0.6Ni4 and MgPrNi4 alloy lattices on H-absorption with θ =0.15 |
 | (10) |
 | (11) |
 | (12) |
 | (13) |
5. Analysis for Hypo-stoichiometric M4H3Type Hydride of Mg2-yPryNi4 (0.45 <x< 0.75; y = 0.6, 0.8 and 1.0)
- Search of θ for analysis of hypo-stoichiometric M4H3 type hydride of Mg2-yPryNi4 (0.45 <x< 0.75; y = 0.6, 0.8 and 1.0) was done in the same fashion as that for the primary H solutions described above in Chapter 4. For this, the analysis was done for the PCisotherms for H-absorption and H-desorption at T = 323 K for Mg1.4Pr0.6Ni4 and at T = 353 K for MgPrNi4. As plotted in Fig. 7, A vs. x relationships for these isotherms were calculated with θ = 0.75 and with θ = 1.0 for the sake of comparison. It looks that the data point for x = 0.45 forMg1.4Pr0.6Ni4 at T = 323 K was out of contention and thence it was discarded for evaluation of the A vs. x relationships for Mg1.4Pr0.6Ni4.
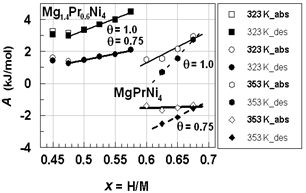 | Figure 7. A vs. x relationships estimated for isothermal PC data for hypo-stoichiometric M4H3 alloy lattice with M = Mg1.4Pr0.6Ni4(Table 1) and M = MgPrNi4(Table 3) with choices of θ = 0.75 and 1.0.Best-fit linear relationships for Mg1.4Pr0.6Ni4on H-absorption and on H-desorption were calculated excluding the data points at x< 0.50 while those for MgPrNi4 on H-absorption and on H-desorptionwere calculated using all the data points plotted herein |
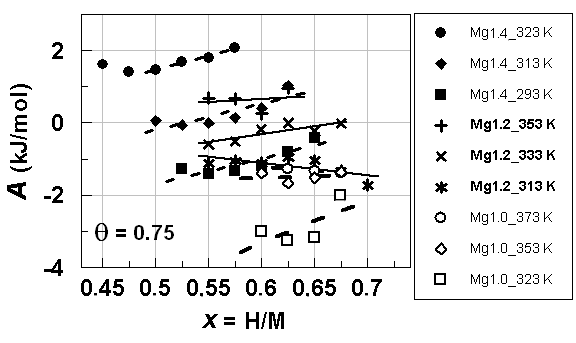 | Figure 8. A vs. x relationships estimated for isothermal PC data at different T forhypo-stoichiometric M4H3 alloy lattices with M = Mg1.4Pr0.6Ni4and MgPrNi4on H-absorption withθ = 0.75 |
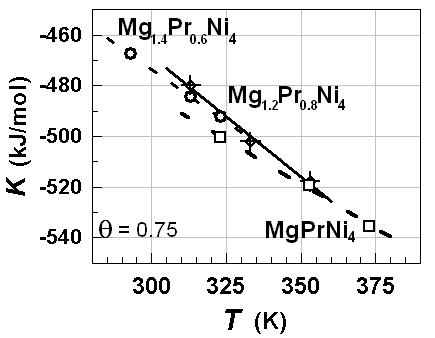 | Figure 9. K vs. T relationships estimated for hypo-stoichiometric M4H3 alloy lattice with M =Mg1.4Pr0.6Ni4, Mg1.2Pr0.2Ni4 and MgPrNi4withθ = 0.75 |
| |||||||||||||||||||||||||||||||||||||||
|
| ||||||||||||||||||||||||||||||||||||||||||||||||||||||||||||||||||||||||||||||||||||||
|
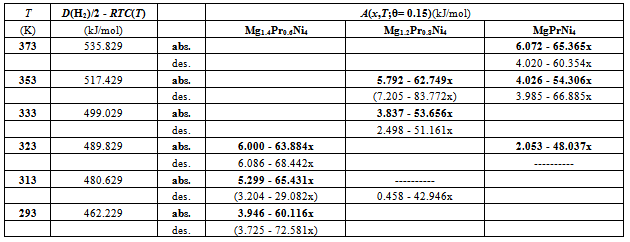
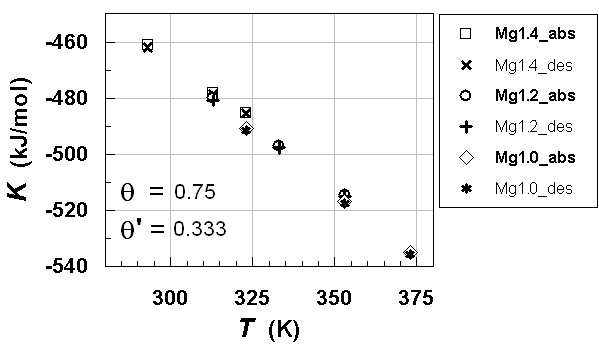 | Figure 10. K vs. T relationships estimated for hypo-stoichiometric M4H3 alloy lattice with M =Mg1.4Pr0.6Ni4, Mg1.2Pr0.2Ni4 and MgPrNi4with θ=0.75 and θ' = 0.333 |
6. Concluding Remarks
- Isothermal hydrogenation performances of Mg2-yPryNi4 alloys with y = 0.6, 0.2 and 1.0 reported by Terashitaet al.[1] were analyzed on the basis of statistical thermodynamics under an a priori assumptionof constant E(H-H) in a given phase at arbitrary T.Primary H solution in Mg2-yPryNi4was analyzed by the model with θ= 0.15 to yield Q ≈ -210 kJ·mol-1 and R ln fH = +850 J·K-1·mol-1. The chosen θ value 0.15 for the model was close to 1/6 (≈ 0.167) which was half of 1/3 (=[Mg + Pr]/[Mg + Pr + Ni]) implying that about half of the (Mg + Pr)-related interstitial sites were provided as the available sites for occupation by H atoms in the primary H solution of Mg2-yPryNi4.On the other hand, hypo-stoichiometric M4H3 type hydride of Mg2-yPryNi4 was analyzed by the model with θ = 0.75 and θ' = 0.333. This model yielded situation with E(H-H) = 0. Chosen value of θ' = 0.333 appeared to imply that the filling of Ni-related interstitial sites by H atoms started after preliminary full occupation of the (Mg + Pr)-related interstitial sites by H atoms in the two-phase equilibrium range at invariable p(H2) plateauduring H-charging.
APPENDIX / List of Symbols
- A(x,T): ≡ RT ln {[p(H2)]1/2·(θ - x)/x} (kJ∙mol-1); calculated from experimentally determinedvalues of p(H2), T and x for specified value of θusing Eq.(1)C(T): defined by eqn.(3) to represent contributions of translational, rotational andvibrational motions of H2 molecule D(H2): dissociation energy of H2 molecule per mole (kJ∙mol-1)E: lattice energy (kJ∙mol-1)E(i-j): nearest neighbor pair-wise interaction energy between iand j atoms in MHx latticefH(T): partition function of H in MHx lattice at temperature Tg: parameter determined as the intercept of the A(T) vs. x plot at x = 0 using Eq.(1)g(v): distribution function as a function of vibrational frequency νof H atom in MHx latticeh: Planck constantk: Boltzmann constantK: parameter calculated from g using Eq.(2)mH: mass of H atomnH: number of H atoms in the MHx latticenV: number of M atoms in the MHx latticep(H2): partial pressure of ideal H2 gas molecule (atm)P-T-C: pressure-temperature-compositionQ: degree of stabilization of H atom in MHx lattice with reference to isolated H atom in vacuumR: universal gasconstant (= 0.0083145 kJ∙mol-1·K-1)T: absolute temperature (K)x: atom fraction of H against M in MHxβ: geometrical factor determined from crystal structure considerationθ: number of available interstitial sites for occupation by H atom per metal atom in MHxΘr: characteristic temperature for rotation of H2 molecule (= 85.4 K)Θv: characteristic temperature for vibration of H2 molecule (= 6100 K)μ(H)c: chemical potential of H atom in the condensed phase MHxμ(H)g: chemical potential of H atom in the ideal diatomic H2 gas moleculeν:vibrational frequency of H atom in MHx latticeρ: nuclear spin weight (= 2 for H while 3 for D)υ0: statistical weight of tightly bound electrons around H in MHx latticeυ0*: statistical weight of electrons in H2 molecule in normal state (= 1)
References
| [1] | N. Terashita, K. Sakai, S. Tsunokake, Y. Nakamura and E. Akiba: Mater. Trans., 53 (2012) 513-517.DOI: 10.2320/matertrans.M2011334."Hydrogenation properties of ternary intermetallic compounds Mg2-xPrxNi4". |
| [2] | T. B. Flanagan and J. D. Clewley: J. Less-Common Met., 83 (1982) 127-141."Hysteresis in metal hydrides". |
| [3] | R.H. Fowler and E.A. Guggenheim: Statistical Thermodynamics, Cambridge University Press (1949). |
| [4] | M.W. Chase, Jr. (Ed.): NIST-JANAF Thermochemical Tables, Fourth Edition, J. Phys. Chem. Ref. Data, Monograph No. 9, Amer. Chem. Soc. and Amer. Inst. Phys., 1998. |
| [5] | N. Shohoji: J. Less-Common Met., 90 (1983) L5-L6."Comments on 'Hysteresis in metal hydrides'". |
| [6] | N. Shohoji: J. Less-Common Met., 90 (1983) L27-L29."On the construction of a statistical model for primary solid solutions of hydrogen in the group Va transition metals (vanadium, niobium and tantalum)". |
| [7] | N. Shohoji: Phys. Stat. Sol. (b), 118 (1983) 811-822. "Statistical thermodynamic approach to some hyperstoichiometricdihydrides of lanthanides (La, Ce, Pr, Nd, Sm) and actinides (Np, Pu, Am)". |
| [8] | N. Shohoji: Phys. Stat. Sol. (b), 119 (1983) K87-K90."Statistical thermodynamics of hydrogen solution in some lanthanides". |
| [9] | N. Shohoji: J. Less-Common Met., 102 (1984) 53-65."Statistical thermodynamics of metal-hydrogen systems". |
| [10] | N. Shohoji: Mater. Lett.,3 (1985) 206-208."Statistical model for the hydrogen solution in bcc Nb1-yMy alloys (M = Al, Cu, Sn, Ni, Pd)". |
| [11] | N. Shohoji: Z. Metallkde., 76 (1985) 192-197."Statistical thermodynamics of the very dilute interstitial solid solutions". |
| [12] | N. Shohoji: J. Less-Common Met., 114 (1985) 249-256."The application of statistical thermodynamics to interstitial solid solutions". |
| [13] | N. Shohoji: J. Nucl. Mater.,127 (1985) 88-96."Statistical thermodynamic study of the ternary compounds ThXyHx (X = C, Ni; y< 1; x< 2)". |
| [14] | N. Shohoji: J. Mater. Sci. Lett., 5 (1986) 522-524."Interaction between hydrogen atoms in metals". |
| [15] | N. Shohoji: J. Mater. Sci., 21 (1986) 2147-2152."Comparative study of solubilities of hydrogen, nitrogen and carbon in -iron". |
| [16] | N. Shohoji: Surface Coatings Technol., 28 (1986) 365-382."Statistical thermodynamic aspects of hydrogen in metals". |
| [17] | N. Shohoji and T. Marcelo: J. Mater. Sci. Lett., 6 (1987) 1251-1253."Tetragonality in crystal lattice of zirconium dihydride". |
| [18] | M. C. Monteiro Dias and N. Shohoji: J. Mater. Sci., 27 (1992) 5154-5158." Stability of hydrogen and nitrogen in group VIa metals (Cr, Mo, W) and iron-group metals (Fe, Co, Ni) evaluated by statistical thermodynamics". |
| [19] | M. C. Monteiro Dias and N. Shohoji: Mater. Chem. Phys.,39 (1995) 193-199."Atomic configuration in hexagonal-close-packed TiCzHx phase estimated by statistical thermodynamics". |
| [20] | N. Shohoji: Mater. Trans., JIM, 42 (2001) 2225-2231. "Statistical thermodynamics as a tool for evaluating atom clustering around interstitial atom". |
| [21] | N. Shohoji: Thin Solid Films, 518 (2010) 7167-7173.DOI: 10.1016/j.tsf.2010.06.052. "Hydrogen absorption in epitaxial bcc V (001) thin films analysed by statistical thermodynamics". |
| [22] | N. Shohoji: Internat. J. Mater. Eng. Technol., 7 (2012) 33-54."Suppressed hydrogen solubility in body centred cubic Va-group metal (Nb and Ta) by alloying with W or Ru analysed on the basis of statistical thermodynamics". |
| [23] | N. Shohoji: Mater. Trans., 53 (2012) 1273-1277.DOI: 10.2320/matertrans.M2012071."Statistical thermodynamic analysis for hydrogen absorption behaviour in a four monolayers (4 ML) thick bcc vanadium (110) superlattice being in contact with molybdenum layer". |
| [24] | N. Shohoji: Mater. Chem. Phys., 17 (1987) 391-398."Estimation of carbon-metal interaction in the carbides of d-transition metals". |
 Abstract
 Reference
 Full-Text PDF
 Full-Text HTML