-
Paper Information
- Next Paper
- Previous Paper
- Paper Submission
-
Journal Information
- About This Journal
- Editorial Board
- Current Issue
- Archive
- Author Guidelines
- Contact Us
International Journal of Modern Botany
p-ISSN: 2166-5206 e-ISSN: 2166-5214
2012; 2(4): 88-91
doi: 10.5923/j.ijmb.20120204.04
Application of Non-Destructive Devices for Determination of Alkaloid Level in Dioscorea Hispida
 Abstract
 Reference
 Full-Text PDF
 Full-Text HTML
Mohd Hudzari bin Haji Razali
Department of Agriculture Science, Faculty of Agriculture and Biotechnology, Universiti Sultan Zainal Abidin (UniSZA), Kuala Terengganu, Terengganu, 21300, Malaysia
Correspondence to: Mohd Hudzari bin Haji Razali , Department of Agriculture Science, Faculty of Agriculture and Biotechnology, Universiti Sultan Zainal Abidin (UniSZA), Kuala Terengganu, Terengganu, 21300, Malaysia.
| Email: |  |
Copyright © 2012 Scientific & Academic Publishing. All Rights Reserved.
The potential of microwave and imaging application in the determination of alkaloid in Dioscorea hispida tubers were explored. The microwave device is used to measure the coefficient permittivity of microwave level at tubers surface using mechanical probe. With the same tubers, 40 grams was selected for chemical analysis at a laboratory for the programme of East Coastal Economic Regions – Kementerian Pengajian Tinggi, Universiti Sultan Zainal Abidin, Malaysia (ECER-KPT UniSZA). The samples were selected from 12 portions of 2 plants (I and B) collected from Kampung Kudat, Ajil, Terengganu, Malaysia. The result show that the correlation between microwave level and weight of alkaloid with regression, R2 is >0.8 is acceptable. For imaging application, the images of variety harvested of Dioscorea hispida will be captured, and then the images will be analysed using the developed color histogram module to determine the maximum Hue image value of Dioscorea hispida at different stages of viscosity. The prediction was also made on the statistical relationship between Hue and dioscorine viscosity in the fruit. The development on both studies is grouped as nondestructive method to determine the dioscorine content which is one of the alkaloid components in the tubers of Dioscorea hispida.
Keywords: Alkaloid Of Dioscorea, Rapid Detection Device, Alkaloid Detection, Dioscorea Hispida, Microwave Sensor
Cite this paper: Mohd Hudzari bin Haji Razali , "Application of Non-Destructive Devices for Determination of Alkaloid Level in Dioscorea Hispida", International Journal of Modern Botany, Vol. 2 No. 4, 2012, pp. 88-91. doi: 10.5923/j.ijmb.20120204.04.
Article Outline
1. Introduction
- Dioscorea hispida is a poisonous plant where scientific study has shown that its tubers contain toxic alkaloid constituents, dioscorine. The tubers can only be consumed after the poisonous dioscorine is removed. This plant is commonly found in secondary forest and grows under shaded areas or near streams. D.hispida is one of the most economically important yam species, which serves as a staple food for millions of people in tropical and subtropical countries[1] and[2] and the only species of which most of the leaves have 3 leaflets and have no aerial tubers[3]. This plant is classified as a wild creeping and climbing plant which can grow up to 20 meters in height[4]. Traditionally, the stem of D.hispida has been used to treat sinus. The tubers has been reported to be rich in essential dietary nutrients[5]. This plant is also known by the local with names such as Tuba Ubi, Ubi Nasi, Ubi Cerok, Ubi Kendudok and Ubi Kipas[6]. Figure 1 show during collecting the tubers of D.hispida at Ajil, Terengganu, Malaysia.[7];[8] mentioned that the advancement of technology should be introduced for agriculture research and for D.hispida the area should focus are harvesting process, dioscorine removal and dioscorine detection devices. The essence of agriculture is shown within the righteous book of Al-Quran which is there are about eighty three sentences mentioning about agriculture as indicated as benefit of mankind[9]
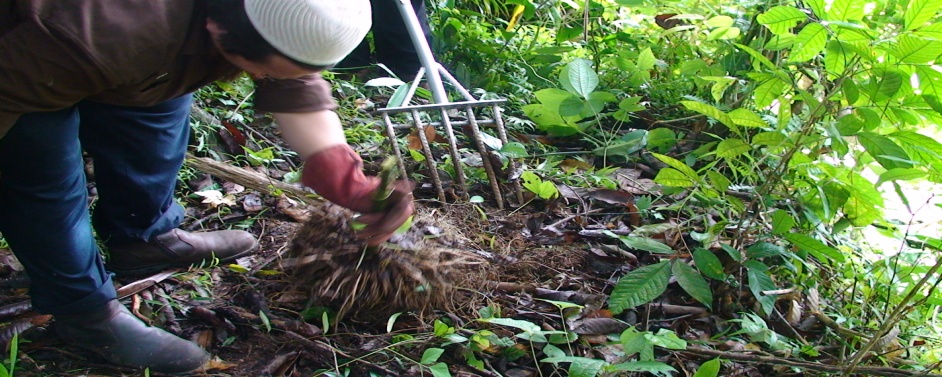 | Figure 1. Collecting the tubers of D.hispida |
2. Objective
- The objectives of this study are to investigate the alkaloid level from the different variety of D.hispida using the microwave sensor and color sensor. The relationship between the levels of alkaloid with the microwave signal and with the colorimetry of D.hispida also will investigate and lastly this study is to generate the simulation model based on alkaloid content in D.hispida.
3. Materials and Methods
- Two plants of D.hispida named as plant I and plant B, were collected from Kampung Kudat, Ajil, Terengganu, Malaysia. There were three levels for each plant. Three tubers were chosen from each level.
3.1. Measurement of microwave of D.hispida
- The experimental set up for measuring the magnitude of reflection coefficient, (|S11|) of a monopole antenna includes a monopole antenna as a mechanical sensor probe and an Agilent FieldFox network analyzer as shown in Figure 2. The operating frequency to measure the reflection coefficient was set from 2MHz to 4GHz. The antenna was inserted into the flesh of the D.hispida tubers and the measurement was made for each tubers sample. Post-processing of the measured data was completed at the Department of Physics, Faculty of Science, Universiti Putra Malaysia.
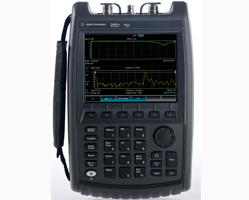 | Figure 2. FieldFox RF Analyzer used in this study |
3.2. Measurement of image value of D.hispida
- The experimental set up to measure the color of D.hispida was easier using the Chroma Meter CR-400 made by Konica Minolta as shown in Figure 3. The output of CR-400 is tristimulus value, whether XYZ, L*a*b* or other color space value. So, using this equipment we can measure the color of an object easily. Simply put it on the object, press the button and we get numerical value that represents that color. This measurement is independent of illumination around the object since CR-400 is pressed against the object which blocks other light to interfere.
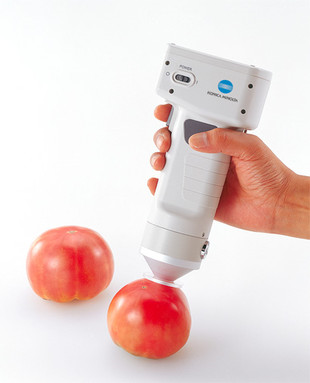 | Figure 3. Chroma Meter CR-400 used at laboratory of Food Technology, UniSZA |
3.3. Chemical Experiment for Alkaloid Determination
- The experimental method was adopted from the chemical analysis method[5].After the tuber was peeled, they were weighed (40 grams) and sliced. Each sample was blended with 200mL of 0.5426 M hydrogen chloride (HCl), (specific molarity of HCl obtained from Titrant/Acid Standardisation) using an electric blender. For HCl preparation, measure the 42mL of HCl in measuring cylinder to make 0.5 M HCl, add this to about two-thirds of the final volume of distilled water in separate beaker. Stir the solution properly. Transfer them into a larger measuring cylinder and add distilled water to the required level and mix them thoroughly. The mixtures of sample were transferred into a conical flask covered with parafilm and left at room temperature for 2 days. After that, the samples were filtered using muslin cloth followed by filter paper; (Whatman Cat No 1001 150). The pH of the samples was checked using pH meter. The mixtures were made alkaline (pH 10-11) by adding K2CO3 and extracted with 3 portion (600-200mLl x 3) of ether using the separating funnel. All of the extracts were combined and dried overnight with Na2SO4. The dried extract was filtered and concentrated under reduced pressure using a rotavapor. The concentrated extract was spotted on a 20 x 20 cm TLC plate (Silica gel G, 60 F254, 0.5 mm thickness, Merck). The compounds were separated with a solvent mixture of chloroform:ethanol:ammonia (100:10:0.5). The plates were air-dried and were sprayed with Dragendorff reagent. The calculated Rf value was compared with literature Rf value[13].
4. Results and Calculation
- With an assumption that the alkaloid content in the whole tubers is homogeneous, results in table 1 and 2 were used to calculate weight percentage of alkaloid content versus magnitude of reflection coefficient and image pixel value. Table 3 show the percentage of alkaloid content and magnitude of reflection coefficient |S11| at 561.7 MHz of every sample. The sample I and b indicated 2 plants of D.hispida. The symbols of ‘a,b,c’ indicated the different tubers of tubers while ‘1,2,3’ indicated the level of tuber from stem, 1 is the nearest with stem.
4.1. Determination of Relationship between Image Pixel Value and Percentage of Dioscorine Content
- Table 2 show the percentage of alkaloid content and reading of L a b color space of every sample. The, I and B indicated 2 plants of D.hispida. The symbols of ‘a,b,c’ indicated the different tubers of tubers while ‘1,2,3’ indicated the level of tuber from stem, 1 is the nearest with stem.
4.2. Determination of Relationship between Magnitude of the Reflection Coefficient, |S11| and Percentage of Dioscorine Content
- Table 1 show the weight parameters of alkaloid in 40 grams of tubers. The tubers from two D.hispida plants were harvested and each layer of the tubers was sliced for this experiment.
|
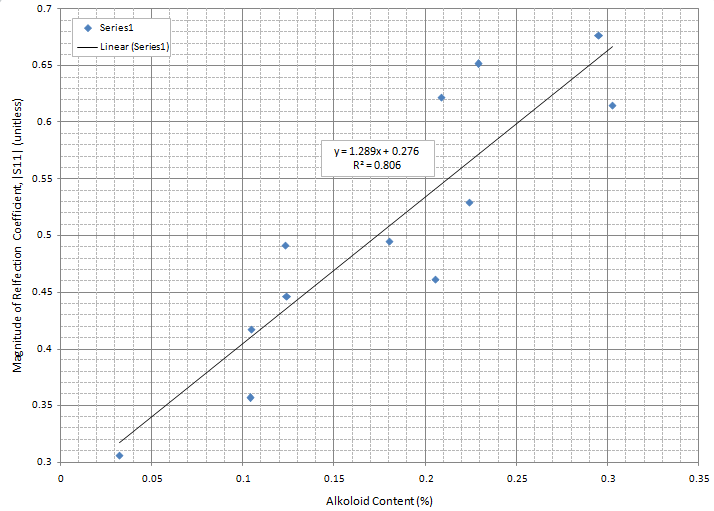 | Figure 4. correlation between percentage alkaloid content and magnitude of reflection coefficient |S11| |
|
5. Discussion
- The correlation between the magnitude of the reflection coefficient of the sensor antenna probe and alkaloid content in the D.hispida tubers samples is high, with R2=0.806. This result means we can use this method and proceed to determine the relation between dioscorine content and the magnitude of the microwave sensor. The pixel value of surface D.hispida tubers also had potential to further analysis on getting similar correlation of alkaloid level of dioscorine. Both works are considered nondestructive method, where the users only need to insert the sensor antenna probe and imaging sensor to the tubers.
6. Conclusions
- The model using the mathematical equation to predict the level of alkaloid of the D.hispida tubers will be developing. Therefore, the amount of water needed to remove the toxic compound and the time consuming in the process can be determined. InshaAllah the sensory device for determine the alkaloid level for D.hispida will comprehend.
ACKNOWLEDGEMENTS
- Greatest thanks to the Al Mighty ALLAH who provided health and strength. The authors would like to thank the Unit Perancangan Ekonomi Negeri (UPEN) Terengganu, who provided fund for this project. Also to those who are directly and indirectly gave their support and help for the success of this project.
References
| [1] | Hahn, S.K., 1995. Yams:Dioscorea spp. (Dioscoreaceae). In: J. Smartt and N.W. Simmonds (Eds), Evolution of crop plants, pp: 112-120. Longman Scientific and technical, UK. |
| [2] | Udensi E.A., Oselebe H.O., and Iweala O.O (2008), “The Investigation of Chemical Composition and Functional Properties of Water Yam (Dioscorea alata): Effect of Varietal Differences”, Pakistan Journal of Nutrition, 7(2): 324-344. |
| [3] | Jill E.Wilson and Linda S.Hamilton (1988), “A Practical Guide to Identifying Yams;The Main Species of Dioscorea in the Pacific Islands” Agro-Facts,Crops, IRETA Publication 1/88 |
| [4] | Sharifah (2011) “Colloquium on Research Program for Discorea Hispida (Ubi gadung), 16 February 2011, Kuala Terengganu, Malaysia |
| [5] | Megh Raj Bhandari and Jun Kawabata (2005),”Bitterness and Toxicity in Wild Yam (Dioscorea spp.) Tubers of Nepal”, Plant Foods for Human Nutrition 60:129-135 |
| [6] | Nashriyah M, Nornasuha Y, Salmah T, Norhayati N and Mohd. Rohaizad (2010), “Dioscorea hispida Dennst. (Dioscoreaceae): An Overview”, Buletin UniSZA, No. 4, ISSN 2180-0235 |
| [7] | Mohd. Hudzari Hj Razali, Hasbullah Hj Muhammad, Noordin Asimi Mohd and Wan Ishak Wan Ismail (2011). A Review on Farm Mechanization and Analysis Aspect for Dioscorea hispida, Journal of Crop Science, 2(1): pp.21-26. |
| [8] | Ishak W.I.W. and Hudzari R.M (2010). “Image Based modelling for oil palm fruit maturity prediction”. Journal of Food, Agriculture & Environment, Vol.8 (2): 469-476. |
| [9] | Mohd. Hudzari Hj Razali, Wan Ishak Wan Ismail, Abd. Rahman Ramli,Md. Nasir Sulaiman, Mohd Haniff Harun (2010), “Colour for Agriculture Product in Al-Quran”, Proceeding of 2nd International Conference on Islamic Science and Technology”, 20th-21th October 2010, Johor Bahru, Malaysia (ISBN 978-983-9805-98-7) |
| [10] | Kaida Khalid and Zulkifly Abbas (1992), A Microstrip Sensor for Determination of Harvesting Time for Oil Palm Fruits, Journal of Microwave Power and Electromagnetic Energy, Vol.27, (1), pp.1-9 |
| [11] | Abbas, Z. (1994). A Microstrip Sensor for Determination of Harvesting Time for Oil Palm Fruits. MSc Thesis, Universiti Putra Malaysia. |
| [12] | Tang Y., Lu L., Zhao W. and Wang J. (2009). “Rapid detection technique biological and chemical contamination in food; A Review. International Journal of Food Engineering 5(5): art. 2. |
| [13] | Leete E and Pinder AR (1972), Biosynthesis of dioscorine, Phytochemistry 11: 3219-3224. |