Armando C. de Souza 1, Flavio Aristone 2, Rene A. Capitanio 3, Joao O. P. Pinto 2, Valmedir A. Laura 4, Samuel L. Oliveira 2, Mauro H. de Paula 2
1Physics Department, State University of South Mato Grosso, C. P. 25, 79200-000 Aquidauana, MS, Brazil
2Center of Sciences and Technology, Federal University of South Mato Grosso, C. P. 549, 79070-900 Campo Grande, MS, Brazil
3Electrical Engineering Department, Anhaguera Uniderp University, Av. Ceara 333, 79003-010 Campo Grande, MS, Brazil
4Embrapa Cattle Beef, C. P. 154, 79002-940, Campo Grande, MS, Brazil
Correspondence to: Flavio Aristone , Center of Sciences and Technology, Federal University of South Mato Grosso, C. P. 549, 79070-900 Campo Grande, MS, Brazil.
| Email: |  |
Copyright © 2012 Scientific & Academic Publishing. All Rights Reserved.
Abstract
An automated photothermal system has been developed to measure the photochemical loss of in vivo plant leaves. In this paper we present results obtained with a programmed system calibrated to measure the hourly photochemical loss during a period of one week (168 hours). To show the usefulness of our technique, we compare the results obtained for a plant maintained inside a receptacle containing a single solution of water and nutrients with the results obtained for another plant that was immersed in the same solution plus polyethylene-glycol to see the effect of water stress on the photochemical loss measurement. Our results indicate that the present technique permits a study of the response of in vivo plants submitted to different water stress conditions.
Keywords:
Photothermal Cell, Photochemical Loss, Eugenia uniflora L. , in Vivo Measurements
Cite this paper:
Armando C. de Souza , Flavio Aristone , Rene A. Capitanio , Joao O. P. Pinto , Valmedir A. Laura , Samuel L. Oliveira , Mauro H. de Paula , "Continuous Monitoring of the Photochemical Loss for in-vivo Plants Using an Open-Ended Photothermal Cell", International Journal of Modern Botany, Vol. 2 No. 4, 2012, pp. 68-71. doi: 10.5923/j.ijmb.20120204.01.
1. Introduction
Characterization of either solid, liquid or gas materials may be performed making use of different spectroscopic techniques. Photothermal spectroscopy is the study of physical and chemical properties by means of the analysis of the conversion of optical energy into heat[1]. An overview on photothermal techniques has been reported by Almond and Pattel[2]. In 1987 an open-ended photothermal cell specifically adapted for in vivo measurements of plants was reported[3, 4]. A transparent crystal of LiNbO3 was used as detector[5] in direct contact with the sample[6]. The use of the open-ended photothermal cell in plant leaves to determine the photochemical loss is important since it allows continuous monitoring of the plant. In contrast, if a conventional photoacoustic[7] cell with a microphone is used, a piece of the leaf needs to be cut and then placed in a sealed chamber, making its application in vivo difficult to analyze, as pieces of different sites of the leaf convey different responses. Another advantage of the open-ended photothermal cell in comparison to the conventional photoacoustic spectroscopy is the requirement of lower frequencies of modulation. It is possible to measure the photochemical loss in low frequencies, thus avoiding interference from the oxygen released by the plant[5, 6]. The photochemical loss signal coming from the plant in vivo is obtained from the ratio between the energy absorbed by the plant when exposed to a beam light and the energy dissipated as heat. Such ratio characterizes the amount of energy stored by the plant, which is mostly used in the photosynthesis process[8, 9]. In this paper we evaluated the usefulness of an open-ended photothermal cell for real-time monitoring of photochemical loss (stored energy) of Eugenia uniflora L. seedlings subjected to two different conditions: a regular solution (water and nutrients) and a water stress system induced by a polyethylene glycol solution of hydrophilic characteristic and highly soluble in water[4,6]. Eugenia uniflora L., also known as the “pitanga” or Brazilian cherry, has been used for this experiment because it is a typical medium – sized tree in Brazil, whose fruit is highly regarded and has a high concentration of calcium and vitamin C.
2. Experimental Setup
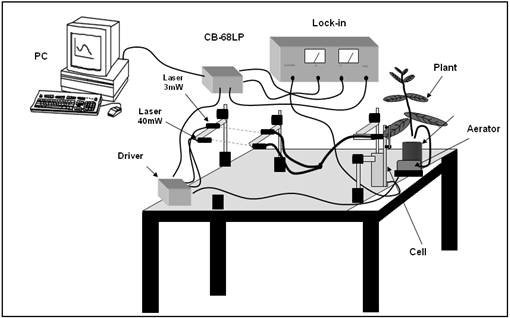 | Figure 1. Schematic experimental setup used to measure the photochemical loss in plant leaves |
The experimental setup used to measure the photochemical loss is shown in Figure 1. A bifurcated optical cable is used for guiding the 3 and 40−mW laser beams up to the plant leaves. The laser beams went through the positive face (electrode) of the LiTaO3 crystal, reaching the plant leaves. The in vivo sample remains attached to the negative face of the LiTaO3 crystal, which detects the heat produced by the leaves as a voltage appearing between the electrodes[11].A data acquisition system was developed to control and monitor the cycles of measurement by activating both lasers and the aerator, and sending a reference signal to the lock-in amplifier (SR530) at the same frequency of the pulse signal[6, 12]. The interface connecting the computer and equipments is done through the DACB card(PCI-6024E/CB-86LP, National Instruments)[13]. The lock-in provides two analogical outputs corresponding to the in-phase and square of the processed signal. These two analogical signals provided by the lock-in are processed by the DACB card that converts them to digital values. A numerical program developed using MATLAB process the signals returning the photochemical loss measured for each interval of approximately two minutes. Figure 2 exhibits a photo of the open photothermal chamber demonstrating the configuration to engage the plant to the transparent LiTaO3 transducer[14]. Seedlings of different species have been used, although here we report only the results obtained for the Eugenia uniflora L., which were subjected to three different experimental conditions. In the first case the seedlings’ roots were subjected to a solution of water and nutrients. In the second and third cases the seedlings’ roots were maintained in solutions of water, nutrients and polyethylene glycol leading to water potential of 0.6 and 0.9 MPa respectively, in order to induce a hydric stress in the plants[15 – 18]. 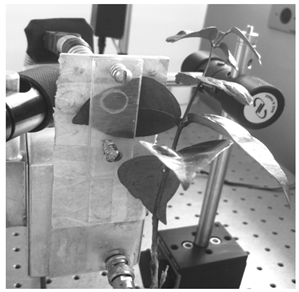 | Figure 2. Photograph of the open photothermal cell and the coupling setup to the leave of Eugenia uniflora L. with the LiTaO3 crystal |
Our experimental system performed measurements at hourly intervals, taking two minutes each time. During the first minute only the 3 mW laser (λ=650nm) modulated at the frequency of 17 Hz is turned on, providing enough energy for the plant to accomplish the process of photosynthesis[19 – 21]. At the beginning of the second minute the 40 mW laser (λ=650nm) is also switched on, both remaining activated until the end of the two minutes. After this period the amount of energy necessary for the plant to process photosynthesis is saturated. The signals obtained during each one of these two periods are used to calculate the photochemical loss. After the measurement the system remains stationary for 58 minutes. During this interval an aerator is turned on to keep the concentration of oxygen constant inside the solutions that contain the roots of the plant. Subsequent to this interval a new data collection was started. The photochemical loss of the plants was determined by a continuous monitoring carried out during a period of 168 hours.
3. Results and Discussion
Figure 3 shows the characteristic curve of thephotochemical loss (energy storage) for measurements obtained in a seedling of Eugenia uniflora L., the roots of which were kept in water and nutrients. Using the photothermal open cell it was possible to continuously monitor the diuturnal behavior of the plant and therefore to observe through the characteristic curve the enduring cycles of the photochemical loss during a period of 168 hours. The photochemical loss in these conditions shows that it is possible to qualitatively know the quantity of energy stored by the plant during the whole period. The decay observed on the characteristic curve can be associated to the adaptation of the plant to the transducer that was connected to it, since the photochemical loss is not due to a decrease of the signals provided by the lock-in but rather to the result of a process involving the signals provided by the lasers AC and DC. 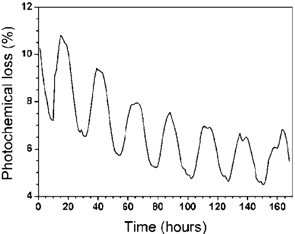 | Figure 3. Photochemical loss as function of time for the Eugenia uniflora L. in solution of water plus nutrients only |
Figure 4 displays the characteristic curve of the photochemical loss for a seedling of Eugenia uniflora L. that was subjected to water stress while its roots were submersed in a solution containing polyethylene glycol at water potential 0.6 MPa. We cannot observe the regular diuturnal cycles of photochemical loss during the first 60 hours of continuous monitoring, in contrast to that observed in the first case scenario. However, after this period of approximately 60 hours the plant adapted to the new environmental conditions, beginning to exhibit the diuturnal cycles of photochemical loss until the end of the 168 hour period, in a similar manner to that verified in the first case when the plant was not under water stress. 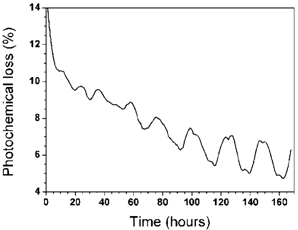 | Figure 4. Photochemical loss as function of time for the Eugenia uniflora L. in solution of water plus nutrients plus polyethylene glycol at 0.6 MPa |
The characteristic of the photochemical loss obtained for another seedling plant of Eugenia uniflora L. subjected to a higher concentration of polyethylene glycol, 0.9 MPa that implies less available water and higher water stress, is exhibited in Figure 5. In this experiment it was not possible to observe any diuturnal cycles behavior of photochemical loss during the first 30 hours of monitoring. 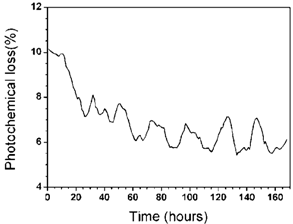 | Figure 5. Photochemical loss as function of time for the Eugenia uniflora L. in solution of water plus nutrients plus polyethylene glycol at 0.9 MPa |
Analyzing the characteristic curve shown in Figure 5 we noticed that the plant starts a process of adaptation to the new environment of higher water stress after such an initial period of 30 hours. However, the cycles of the diuturnal photochemical loss are irregular during all 168 hours of measurements, indicating that the adaptation of the plant is insufficient to restore the balance that was previously reached. This attempt of the plant to recover the diuturnal cycles of photochemical loss might be attributed to the physiological response to the different environmental conditions imposed in the form of strong water stress. Even though these characteristic curves indicate the continuous monitoring of the photochemical loss for the plant, it is important to point out that our results are not quantitative but rather qualitative. Nevertheless, they are certainly appropriate to assess the behavior of a plant under either regular or water stress conditions due to the use of the open-ended photothermal cell. It is also important to mention that a series of other exhaustive tests were performed on other plants, e.g. seedlings of Eucalyptus, in which similar dependence of the photochemical loss was observed.
4. Conclusions
The photothermal open cell was used in the continuous monitoring of the photochemical loss in plants during seven days (168 hours). The data indicate different photochemical loss regimes for plants submitted to regular and water stress conditions. The results indicate that the open photothermal cell may be used to develop portable equipment to monitor in real-time the photochemical loss in different crops directly into the field.
ACKNOWLEDGEMENTS
We acknowledge the financial support of CNPq – Brazil, CAPES – Brazil. S. L. Oliveira also thanks the support provided by the “National Institute of Photonics”. F. Aristone is particularly grateful to CNPq under contract number 552729/07-8. We thank Victoria R. Tangi for English proofreading and editing.
References
| [1] | H. Vargas, L. C. Miranda, “Photoacoustic and related photothermal techniques”, Physics Report 161 (1988), 43-101. |
| [2] | D. P. Almond, P. M. Patel, “Photothermal Science and Techniques”, Chapman & Hall, London (1996). |
| [3] | M. H. de Paula, M. A. Carvalho, L. M. Alves, M. A. Aegerter, “An open ended photothermal cell for in vivo measurements”, Journal of Applied Physics 61 (1987), 2617–2620. |
| [4] | M. H. de Paula, C. A. Vinha, M. A. A. Cortez, S. Placencia , “Determination of photochemical loss in leaves by an open-ended photothermal cell”, Biochimica et Biophysica Acta – Bioenergetics (1997), 179–182. |
| [5] | T. Hata, Y. Sato, M. Kurebayashi, “Photoacoustic spectroscopy of CdS by transducer method”, Japanese Journal of Applied Physics, 22 (suppl. 22–3) (1983), 205–207. |
| [6] | M. H. de Paula, S. M. F. Filho, G. M. Lemos, C. A. T. L. Junior, G. S. Maeoca, M. A. A. Cortez, A. A. de Carvalho, C. Kitano, J. G. sa Dilva, W. L. B. de Melo, “The open-ended photothermal cell with LiTaO3 and its use in determining the photochemical loss”, Sensors and Actuators B - Chemical 125 (2007), 274 – 277. |
| [7] | A. Rosencwaig, “Photoacoustics and Photoacoustic Spectroscopy”, Wiley, New York (1980). |
| [8] | P. Poulet, D. Cahen and S. Malkin, “Photoacoustic detection of photosynthetic oxygen evolution from leaves – quantitative analysis by phase and amplitude measurements”, Biochimica and Biophysica Acta 724 (1983), 433–445. |
| [9] | S. K. Herbert, T. Han, T. C. Vogelmann, “New applications of photoacoustic to the study of photosynthesis”, Photosynthesis Research 66 (2000), 13–31. |
| [10] | G. Puccetti, R. M. Leblanc, “A comparative study on chromophore diffusion inside porous filters by pulsed photoacoustic spectroscopy”, Journal of Membrane Science 119 (1996) 213–228. |
| [11] | D. R. Lide, CRC Handbook of Chemistry and Physics, 75th ed., CRC Press, Boca Raton, 1994. |
| [12] | M. H. de Paula, A. A. de Carvalho, A. L. Brassalotti, A. J. Alter, W. K. Sakamoto, J. A. Malmonge, A. de Almeida, “Microcontrolled pyro-electric instrument for measuring X-ray intensity in mammography”, Medical Biology Engineering Computing 43 (2005) 751–755. |
| [13] | W. B. Jackson, N. M. Amer, A. C. Boccara, D. Foumier, “Photothermal deflection spectroscopy and detection”, Applied Optics 20 (1981) 1333–1344. |
| [14] | M. Havaux, L. Lorrain, R. M. Leblanc, “Photothermal beam deflection: a new method for in vivo measurements of thermal energy dissipation and photochemical energy conversion in intact leaves”, Photosynthesis Research 24 (1990) 63–73. |
| [15] | A. C. Tam, “Ultrasensitive Laser Spectroscopy”, edited by D. S. Kliger, Academic, New York (1983). |
| [16] | E. Schoubs, H. Mondelaers, and J. Thoen, Journal of Physics IV, coll. C7 4, C7-257-C7-261 (1994). |
| [17] | M. Marinelli, F. Mercuri, S. Foglietta, U. Zammit, and F. Scudieri, Physical Review E 54, 1604 (1990). |
| [18] | Yasuomi Ibaraki, Kaori Matsumura, S. Dutta Gupta. “Low-cost photochemical reflectance index measurements of micropropagated plantlets using image analysis”, Computers and Electronics in Agriculture, Vol. 71, Elsevier B, 170-175, (2010). |
| [19] | Yasuomi Ibaraki, S. Dutta Gupta. !Nondestructive evaluation of the photosynthetic properties of micropropagated plantlets by imaging photochemical reflectance index under low light intensity”, In Vitro Cellular Developmental Biology Plant, Vol. 46, Issue 6, pp. 530-536 (2010). |
| [20] | Xiaoping Xie, Zhiqiang Gao, Wei Gao, “Estimating photosynthetic light-use efficiency of Changbai Mountain by using MODIS-derived photochemical reflectance index”, Proceedings of SPIE. Volume: 7454, Issue: 1, Publisher: Spie, 745415-745415-7 (2009). |
| [21] | Gabriel Hmimina, Eric Dufrêne, Nicolas Delpierre, Kamel Soudani. “Tower-Based Photochemical Reflectance Index measurements to assess ecophysiological responses in a mature deciduous forest”, Geophysical Research Abstracts. Vol: 13, 11332-11332 (2011). |
 Abstract
 Reference
 Full-Text PDF
 Full-Text HTML