-
Paper Information
- Paper Submission
-
Journal Information
- About This Journal
- Editorial Board
- Current Issue
- Archive
- Author Guidelines
- Contact Us
International Journal of Internet of Things
2018; 7(2): 37-44
doi:10.5923/j.ijit.20180702.03

Internet of Things Users Classification According to Their Technology Readiness Index
 Abstract
 Reference
 Full-Text PDF
 Full-text HTML
Adel Bessadok1, Smirani Lassaad1, Khaled Hatem A. Almotairi2
1E-learning and Distance Education Deanship, Umm Al-Qura University, Makkah, Saudi Arabia
2College of Computers and Information Systems of Umm Al-Qura University, Saudi Arabia
Correspondence to: Adel Bessadok, E-learning and Distance Education Deanship, Umm Al-Qura University, Makkah, Saudi Arabia.
| Email: |  |
Copyright © 2018 The Author(s). Published by Scientific & Academic Publishing.
This work is licensed under the Creative Commons Attribution International License (CC BY).
http://creativecommons.org/licenses/by/4.0/

The extending of the Internet and communication technology by linking it with smart sensors devices and physical objects is a growing trend known as the Internet of Things (IoT). From people communication to objects communication, IoT takes the Internet to an evolution stage, a leap that will allow us to become more proactive and less reactive. The adoption of IoT is recognized as a key factor for economic and social development. In this paper, we first examine the willingness of people in Kingdom of Saudi Arabia to adopt IoT as an emerging technology based on the Technology Readiness Index (TRI) dimensions- innovation, optimism, discomfort and insecurity-of Parasuraman. Secondly, we are interested in mining people’s belief based on TRI dimensions that provide a meaningful explanation of their IoT readiness. A survey questionnaire was conducted to collect data from 400 participants. Confirmatory Factor Analysis (CFA) and Measurement Model have been deployed to verify TRI hypothesis. Using the correlation between TRI dimensions; we analyze the most influential factor on people readiness. We used Classification approach with two-step cluster technique to mining people’s belief. The results confirm the existent of TRI hypothesis and show a match of five out of the five TRI segments. Despite their belief in the present and future efficiency of these smart devices, people are showing considerable reluctance regarding the wide use of IoT explained by the dominance of the Insecurity factor on overall TRI score.
Keywords: Internet of Things, Technology Readiness Index, Measurement Model, Two-step cluster
Cite this paper: Adel Bessadok, Smirani Lassaad, Khaled Hatem A. Almotairi, Internet of Things Users Classification According to Their Technology Readiness Index, International Journal of Internet of Things, Vol. 7 No. 2, 2018, pp. 37-44. doi: 10.5923/j.ijit.20180702.03.
Article Outline
1. Introduction
- The internet has conquered daily life of all planet inhabitants. It has easily and quickly succeeded in connecting people to each other, regardless of distances and time zones. Today, according to expert reports, we are on the eve of a new revolution [1]. In the next few years, the number of Internet users, which is increasing, is likely to be very small compared to the multitude of inanimate objects that can communicate with each other electronically. Nowadays, we start talking about objects with addresses that make up networks bigger and bigger. For example, televisions can communicate with each other and exchange programs and media files, refrigerators can exchange information with supermarket shelves, microwave and washing machines can do the same too [2]. This notice of connection between real world and internet virtual world is called the Internet of Things “IoT". This expected revolution has been the subject of several research projects over the last few years, while the emergence of the concept of IoT was born in 2005 [3]. Since then, it has explained how a mobile phone can be equipped with a unique identifier that transmits data about its user and location, while allowing the mobile phone to receive accurate information about where it is located. Today, electronic tags equipped with radio transmitters are incorporated into manufactured goods; in other words, each object is electronically identifiable at any time and in any place. Some of these labels, which are very small in size, can be integrated into any medium.The IoT will challenge the existing structures of telecommunication industry while opening radically new perspectives to new management models [4]. All countries can innovate in this area of new technologies, even Middle East countries. This technology can make a significant contribution to achieving their development goals. IoT-based applications can bring tangible improvements in several areas: medical diagnosis and treatment, improved water and sanitation, energy production, increased trade and improved food security. There is no doubt that IoT will become very popular. This fact was confirmed by all observers’ testimony. In the other hand, this question had to find a response: What about IoT consumers and smart devises users? Even if smart products based on IoT technology are available at the market in a big way, this fact does not give a clear idea about users readiness and acceptance to this technology and cannot confirm whether this acceptance is conditional or not. In this paper we study the degree of KSA user readiness to get these new smart items not only at home but also outside. Also, we aim to know the ability degree of use smart devices and how users deal with it in their daily life. Our study aims to give an idea about smart device users beliefs and their tendencies in Saudi Arabia. This article examines a sample of consumers in Kingdom of Saudi Arabia. KSA is a country experiencing strong technological growth and keeps abreast of the latest high-speed technological developments. On the other hand, the KSA is known for the widespread of Internet use because this country has managed to consolidate the society of knowledge and information. All KSA indicators in the field of internet use point to a significant increase. Also in the use of smart mobile phones so we speak about a full involvement in modern technologies use. The telecom industry is proving that IoT is a large lucrative market and the technical infrastructure needed for the IoT is being phased gradually. In this article, we will try to know the readiness of the Saudi consumer measured by the degree of their willingness to embrace this technology based on smart objects that will surround him. The question is whether the Saudi Arabian consumer is really ready to buy and use a refrigerator that automatically controls food products or a washing machine that can directly report a failure to its manufacturer.We aim to assess the readiness of consumers to use smart system-based technology by using TRI model. Such models have been extensively used since the publication of original TRI studies by Parasuraman [5] and Parasuraman and Colby [6]. TRI test results can be generalized for contexts such as insurance services and industrial equipment [7]. Confirmatory factor analysis (CFA) was used to validate the instrument and the results obtained showed that TRI makes it possible to differentiate between users and non-users of these new technological products or services and can help predict adoption of these products or services.
2. Literature Review
2.1. Internet of Things
- The extending of the Internet and communication technology by linking it with smart sensors devices and physical objects is a growing trend known as the Internet of Things. From people communication to objects communication, IoT takes the Internet to an evolution stage, a leap that will allow us to become more proactive and less reactive. The adoption of IoT is recognized as a key factor for economic and social development. Our life will become connected objects: it is the current technological revolution. As the digital revolution unfolds, new aspects are brought up to date. The IoT is the next step in the process. It is a multitude of connected physical objects: smartphones, laptops, televisions, consoles, medical implants, thermostat, camera, appliances…Many experts predict that 11.2 billion objects will be connected by 2018, and more than 20 billion connected devices will be in circulation by 2020. This massive arrival of connected objects makes it easier for consumers to live daily. Several large companies take advantage of this to improve the customer service experience. Companies launched the "connected button" in 2014 [1]. It allows putting in contact on a simplified interface the technical teams and all the consumers, including those who did not buy their product in the signboard. This service is also available via an application. Some innovations also simplify consumption habits. For businesses, the explosion of connected objects also has several advantages. Thus, with better management systems, the connection between sales and storage areas, the maintenance of the cold chain or the management of preemptions are reinforced.Marketing teams will also benefit from this trend. IoT represents both new opportunities and a major challenge: how to see clearly in an exponential amount of information?With the development of machine learning algorithms, telephone operators have, for example, developed their networks according to the use of certain areas. The challenge is to get closer to consumers and offer them more personalized experiences. For the Economist Intelligence Unit, the sector will be worth $ 4 trillion by 2024 [3].
2.2. Technology Readiness Index
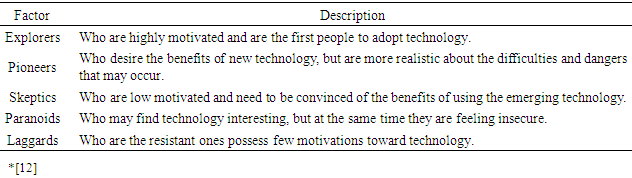
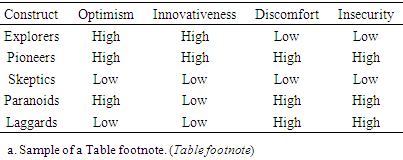
- Many researchers have studied technology readiness. Among the work done, comparative studies had dealt with positive and negative beliefs about technology acceptance [8], [9] and [10]. At the beginning of the new millennium, Parasuraman had introduced the expression "Technology Readiness Index" (TRI) and it was published in the Journal of Service Research [5]. Parasurman propose to measure the "people's propensity to embrace and use new technologies for accomplishing goals in home life and at work" (Parasuraman, 2000, p. 308). Since then, the TRI has become a widely accepted metric for studying the behavior process behind the adoption of technological products and services. Nevertheless, TRI gives an idea about a person's beliefs and not person's ability using new technology [11]. As multiple-item scale, the TRI consisted of a 36 questions devoted to measuring "technology readiness". The 36-item scale was composed of four component dimensions of beliefs related to technology that influences a personal’s level of technology readiness. These beliefs assign a person's willingness to interact with new technology [6] as listed in Table 1.
|
|
|
3. Research Design
3.1. Model Hypothesis
- The main objective of the current study is to determine the dominant factor that have the most influence on the overall TRI score. To understand TRI factors as specific characteristic profiles between user's smart device readiness and non-readiness, and between technology motivated and non-motivated, we suggest the following hypotheses:•H1: The optimism and innovativeness are well correlated and constitute the contributors’ factors. •H2: The discomfort and insecurity are well correlated and constitute the inhibitors factors.•H3: The contributors and inhibitors factors are less correlate between each dimension.•H4: The optimism is the most influential factor among all TRI factors.•H5: The innovativeness is the most influential factor among all TRI factors.•H5: The discomfort is the most influential factor among all TRI factors.•H5: The insecurity is the most influential factor among all TRI factors.
3.2. Methodology
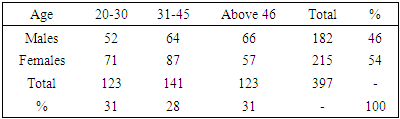
- Since the adoption of the internet of things is fairly recent in the KSA region, our preliminary sample consists of 400 participants. As a prerequisite for pre-processing we eliminate missing responses and the final sample was composed of 397 respondents. Among the sample obtained, 46% were men and 54% were women, which corresponds approximately to the distribution of the actual population. The Demographic details of our sample are presented in Table 4.
|
4. Emperical Analysis and Results
4.1. Confirmatory Factor Analysis
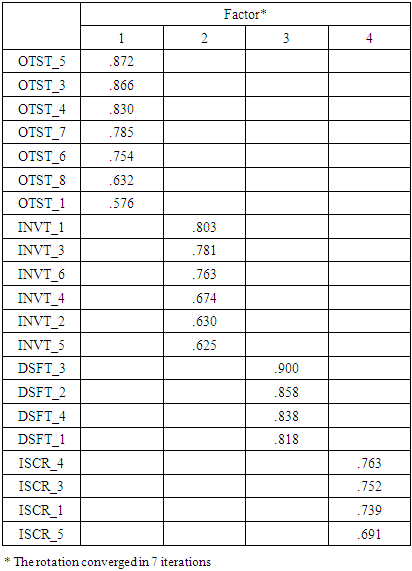
- To validate or reject the first three hypothesis in the research model (Figure 1), we deployed Confirmatory Factor Analysis (CFA) that lead to identify the underlying structure in the TRI four dimension [14]. In the conducting study, each common factor is presented by multiple measured variables manifested by a considerable items number (36 items). In such case, Exploratory Factor Analysis (EFA) procedure provide more accurate results [15]. For extracting the composing of each TRI factor with an increasing reliability, we proceed for several times EFA to check the consistency of the proposed factor. EFA was deployed using IBM SPSS 20 software.
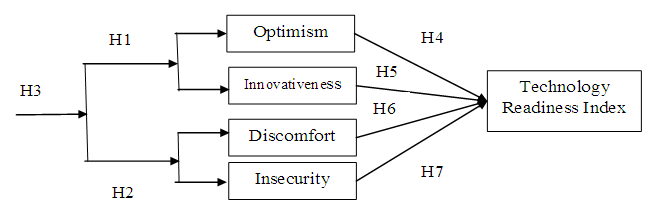 | Figure 1. Research Model |
|
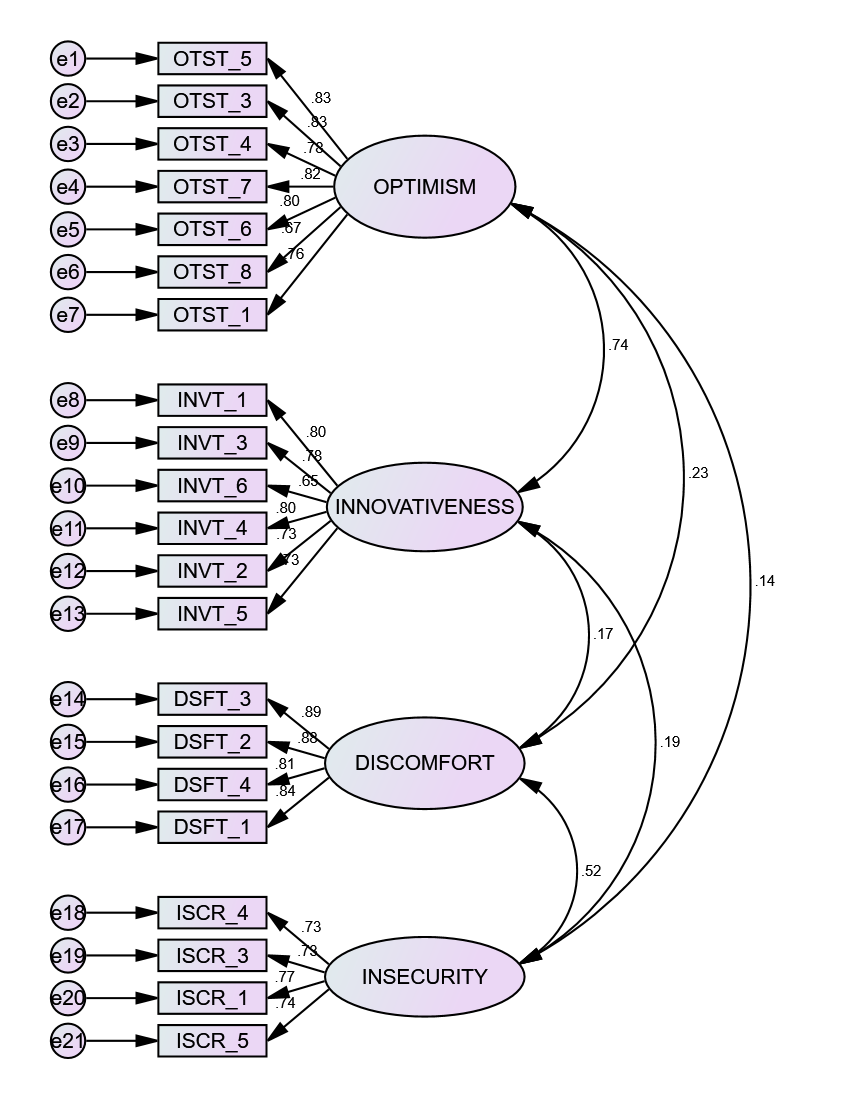 | Figure 2. CFA Result |
4.2. Reliability and Validity Assessment
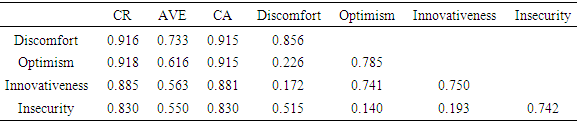
- The reliability and validity of results are considered as the two major import issues in measurement theory. The reliability analysis of each factor determines its ability to yield the same results on different situation and validity refers to the measurement of what the factor is supposed to measure [18]. As reliability estimate we use Cronbach’s alpha (CA) that measures internal consistency. We establish convergent validity to show measures that should be related are in reality related. In addition to the internal validity measurement, the convergent validity was examined by Composite Reliability (CR) and by the Average Variance Extracted (AVE) [19]. The recommendation level for the internal consistency reliability is at least should be 0.7 and at least 0.5 for AVE [17].As shown in Table 6, the Crombach's alpha (CA) and Composite Reliability (CR) for all constructs are above the acceptable level of 0.7, indicating a high the internal consistency.
|
4.3. Discriminant Validity
- Discriminant validity refers to the extent to which factors are distinct and uncorrelated. Thus, when the correlation between any two constructs is less than the square root of the AVE then the discriminant validity is established [20]. The rule is that variables should relate more strongly to their own factor than to other factor. In the Table 6 the items on the diagonal represent the square roots of the AVE and the others elements are the correlation estimates. The square root of the AVE is greater than inter-item correlations and that conclude the approval of discriminant validity for each of the items.
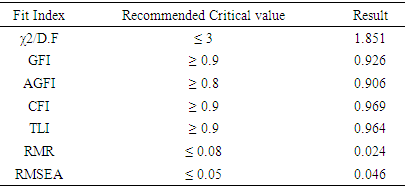
4.4. Overall Model Fit
- For measuring the model fit, it is a common practice to deploy a variety of indices [21]. These indices could be classified into three categories as suggested by [14]. The Chi-square statistic, the goodness-of-fit Index (GFI) and the standardized root mean residual (SRMR) are used to measure how well the measurement model reproduce the observed data that constitute the first category which is the absolute fit indices. The second is the parsimonious fit indices category takes into account the model's complexity which includes the Root Mean Square Error of Approximation (RMSEA) and the Adjusted Goodness-of-Fit Index (AGFI).Finally, the Comparative Fit Index (CFI) and the Tucker-Lewis Index (TLI) asses how well a specified model fit relative to an alternative baseline model that constitutes the third incremental fit indices category. The recommended critical level of acceptable fit and the result fit indices for the research measurement model that show an excellent fit for all three categories indices are presented in Table 7.
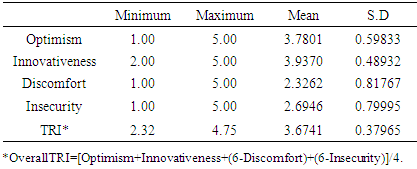
4.5. TRI Score Results
- We calculate the overall TRI score for each respondent as an average of the optimism, innovativeness, discomfort and insecurity after reverse coding the scores on discomfort and insecurity and the results was presented in Table 7. For contributor dimension, Innovativeness was rated with highest mean score, 3.9370 and the optimism was the next highest mean score, 3.7801. However, for the inhibitor dimension, the discomfort and insecurity factors yielded mean values of 2.3262 and 2.6946 respectively. The overall TRI mean was 3.6741 with a standard deviation of 0.379665.
|
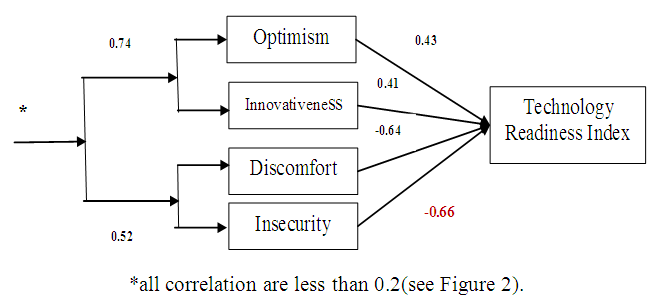 | Figure 3. Research Model Result |
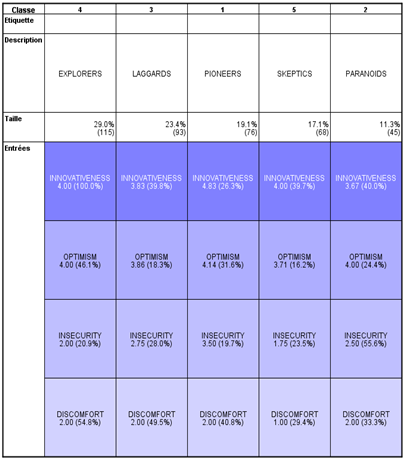
4.6. TRI Classification Results
- Classification may provide a meaningful explanation of why a particular user is more (or less) ready for using smart devices. Several cluster techniques were deployed to obtain distinct groups with homogeneous user profiles based on technology readiness index dimensions ([13], [22]). The classification technique we need should be applicable for a relatively large data set as manifested in the sample case study and must be based on Likert scale.Therefore, in such situation methodologists advocate the use of a two-step cluster procedure. In the first step a hierarchical algorithm determines the number of clusters and starting means which are then as second step inputs into the subsequent non hierarchical algorithm that is run to achieve final clustering [23]. Modeling analyses were conducted with IBM AMOS 20 software. The first step of the procedure was to calculate the Schwarz’s Bayesian information criterion (BIC) for each number of clusters within a specific range that estimate the initial number of clusters. The second step refines the initial estimate using log-likelihood by finding the greatest change in distance between the two closest clusters in each hierarchical clustering stage. We first tested the existence of the five classes presented in Table 8 and then we fixed four from the remaining factors after eliminating the nonexistent one.
|
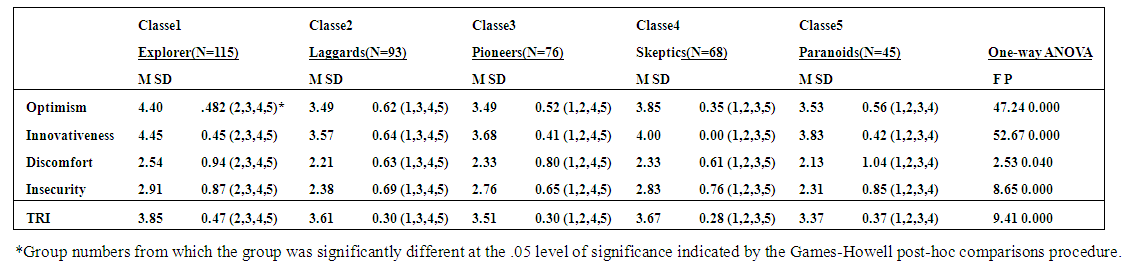 | Table 9. TRI Dimensions per Class |
5. Discussion
- Based on our findings, one can mention that the surveyed respondents are somewhat readiness for the use of IoT technology. In fact, the Table 6 shows that the overall TRI, 3.67, is around the average of Likert scale deployed in this study. The correlation between optimism and innovativeness, 0.71, and between discomfort and insecurity, 0.52, are the highest correlation amongst all TRI factors (Table 5). This result is predictable because the pairs of factors defined respectively the contributors and inhibitors which describe the readiness of users to use the IoT system technology. To determine the main factor that influence the overall TRI, one can distinguish from figure 2 that the inhibitor factors shown to be more positive with absolute value (0.19; 0.14) in relation to technology than the contributor ones (0.23; 0.17). However, the survey found that the technology readiness varies from a user to another. The last result was validated and confirmed in Table 10, where we obtained five user's belief classes. The Explorers class (29%), which indicates the existence of respondents who are highly motivated and fearless to try smart devices technology.A relatively considerable percentage of respondents surveyed, 23.4%; belong to the Laggard class. They represent the resistant participant who may never use the Internet of Things unless they are forced to do so. The third significant class is the Pioneers (19.1%), in which respondents have an desire to acquire the benefits of the new technology but were more practical about difficulties and obstacles involved. Moreover, a relatively small class of the respondents were skeptics, 17.1%. These users are no highly motivated nor highly resistant to use Internet of Things, but they need to be convinced of the benefit of the emerged smart devices. Our results show that the minority of surveyed users belong to the class of Paranoids (11.3) %, who were convinced of the benefits of the Internet of Things technology but were preoccupied about the imminent risks and obstacles of technology adoption. Pioneers need help in making the technology work for them and require some degree of assurance. In fact, as shown in figure 3, (0.66) is the absolute correlation value between insecurity and the TRI that indicates the most influential factor affecting the readiness of the participants. Combining this vulnerable situation affecting the readiness of participants with the considerable percentage of resistant one, we can maintain that the KSA respondents feel insecure and this is the main factor that explains their reticence about the use of Internet of Things. Thus, despite their belief that technology may offer efficiency and comfort in their daily lives, users in KSA are still reticent about the use of smart device connected to IoT technology.
6. Conclusions
- Recently, the Internet of Things has attracted growing interest and has become one of the hottest topics in information and communication technologies. The existence of IoT, which is an emerging technology, does not necessarily guarantee its use. One of the most important factors in the individual's use of modern technologies is his readiness. The current study is an analysis of the readiness of Saudi Arabia's users for IoT to embrace such new technologyThis study can also give some tips to IoT industrialists. In fact, we all agree that technology is increasingly humanity popular not only because it facilitates the daily life of individuals but also because of the marketing and promotion mechanism development. In the other hand, we had to agree that the presence of these smart and digital products on the market and in our daily life does not necessarily mean the evident use of it. In this study we focus on the readiness of people at Kingdom Saudi of Arabia. This factor is very useful to IoT innovators and industrialists to be more aware of consumer attitudes and beliefs. Also, aware of their fears about the use of smart device connected objects either inside or outside their home.According to our results, four important factors determine the IoT user readiness: two factors represent the positive attitude and the desire to use IoT smart devices and two factors represent negative attitude which correspond to user refuse and evasion from IoT smart devices. The obtained result confirms previous theoretical studies. This shows that safety is the most important factor in such equation. In fact, we find five classes of users. The first two classes are the most important but contradictory. Indeed, the first class, called "Explorer", includes 29% of users. This proportion represents people who are willing to use smart devices without any conditions. The second class represents people with no desire to use smart devise and their ability to use this technology is conditional and requires conviction efforts.The presence of these two different classes is not surprising. These results are justified by the fact that Saudi Arabia has succeeded in building the information technology society. The Saudis are currently using modern means and embracing technological evolution. Internet in Saudi Arabia is available in all regions of the Kingdom and the Saudi citizen uses the latest cries in the field of mobile phones, smart TVs and all TIC products, but his fear is justified by three main arguments:1. IoT represents technology entering his life and transmits data from his private life to communicate with outside world2. There is a poor sense of confidence in this new technology3. The citizen had to feel safer when using smart connected products.Finally, IoT innovators and manufacturers had to seriously consider the security aspect, both in IoT device constitution and in their marketing campaigns.Our study may suffer from some limitations specially related to the relatively small sample size explained by the recent adoption of IoT that still at a very nascent stage in gulf region. Care should then be taken into account in interpreting and generalizing the reached results. For future research, we recommend comparative studies to be conducted on other Arab region for a clearer vision about their tendency to embrace the Internet of Things technology. In addition, further research may consider more than the user's readiness but also the acceptance and the attitude to buy Internet of Things technology products.
ACKNOWLEDGMENTS
- The Umm Al-Qura University and the E-learning and Distance Learning Deanship in Saudi Arabia, has supported this work financially.