Hiroki Kitamura 1, Fumiko Harada 2, Yusuke Kajiwara 3, Hiromitsu Shimakawa 3
1Graduate School of Information Science and Engineering, Ritsumeikan University, Shiga, Japan
2Connect Dot Ltd, Kyoto, Japan
3College of Information Science and Engineering, Ritsumeikan University, Shiga, Japan
Correspondence to: Hiroki Kitamura , Graduate School of Information Science and Engineering, Ritsumeikan University, Shiga, Japan.
| Email: |  |
Copyright © 2018 Scientific & Academic Publishing. All Rights Reserved.
This work is licensed under the Creative Commons Attribution International License (CC BY).
http://creativecommons.org/licenses/by/4.0/

Abstract
This paper proposes a method to estimate whether a pedestrian is distracted or not and predict whether he will cross a driveway or not from 3-D acceleration / angular velocity data. In order to acquire these data, this method uses acceleration / angular velocity sensors attached to the heads and waists of pedestrians. Walking characteristics of head and waist are calculated from these data when they are walking. Some studies point out when a pedestrian is distracted or before he crosses driveway, he wanders of gait in the left and right direction or swings his head. This method calculates these change of head and waist as walking characteristics from 3-D acceleration / angular velocity data of head and waist. The machine Learning method, Random Forest, is applied to estimate whether a pedestrian is distracted or not and predict whether he will cross driveway or not using walking characteristics. The experimental result indicates this method can identify which of four-walking patterns the pedestrian is in because the F-measure value of Random Forest in the four-walking patterns were around 0.70. We also found that it is possible to reduce sensor equipment and cost to be worn by the pedestrian from walking characteristics of the top 10 significant variables. Finally, we discuss the limitations of this method from equipment attached to pedestrians and this environmental experiment.
Keywords:
Crossing, Distraction, Pedestrian, Walking Behaviour, Sensor
Cite this paper: Hiroki Kitamura , Fumiko Harada , Yusuke Kajiwara , Hiromitsu Shimakawa , Prediction of Crossing Driveways of a Distracted Pedestrian from Walking Characteristics, International Journal of Internet of Things, Vol. 7 No. 1, 2018, pp. 1-9. doi: 10.5923/j.ijit.20180701.01.
1. Introduction
Traffic accidents of collision of pedestrians and cars kill more than 270,000 pedestrians every year in the world [1]. About 40% of traffic accidents happen when pedestrians are crossing driveways at outside of crosswalks in Japan [2]. One of the reasons for the accidents is considered to be negligence for pedestrians, which comes from attention deficit of a pedestrian [3]. If they walk with some other tasks, for example, listening to music by mobile devices, texting or thinking while walking, they distract their attention [4, 5]. In this research, the state of a pedestrian at distraction is referred to as the state in which his attention is paid to something other than walking, such as a texting or thinking while walking. Distracted pedestrians sometimes misrecognize traffic conditions or delay in cognition because of their decreased processing capacity in the brain, called as working memory [6]. They lack in danger awareness at crossing a driveway. Therefore, they sometimes cross a driveway with dangerous timing and situations compared to normal pedestrians. In order to prevent collision accidents of pedestrians and cars, we need a method to detect latent accidents from pedestrian internal states. The main motivation of the paper comes from the following 2 points: 1. detecting distracted pedestrians who are going to cross roads, and.2. issuing effective warnings at right timing.To know the internal state of pedestrian states, it is necessary to predict whether a pedestrian is distracted or not, and whether he will cross a driveway or not. In this research, a method is proposed to detect that a pedestrian is distracted and predicts whether he will cross a driveway or not from his walking characteristics. The proposed method obtains walking characteristics of a pedestrian through 3-axis acceleration and angular velocity sensors attached on his head and waist. By detecting a pedestrian is distracted or by predicting whether he will cross a roadway or not, it is possible to make appropriate correspondence according to the predicted result to a pedestrian or driver. For example, pedestrians crossing the roadway in a distracted state are highly likely to cross dangerously. Therefore, the pedestrians receive warning through their mobile devices. On the other hand, pedestrians walking straight on sidewalks in a distracted state are in danger, however, they are not likely to collide with cars. Thus, they should be cautioned only to call attention to the driver.By changing correspondence according to the prediction result in these ways, we can prevent excessive warning to pedestrians. By preventing excessive warning to pedestrians, it is possible to reduce the possibility of ignoring or turning off warnings by pedestrians Thus, it is possible to prevent collision accidents between pedestrians and cars. In the paper, Section 2 introduces existing works. Section 3 explains our method to calculate the walking characteristics of pedestrians for prediction. In Section 4, we show the experiment and evaluation result. In Section 5, the paper discusses whether it is possible to reduce explanatory variables for prediction or not. Section 6 summarizes our work.
2. Estimation of Distraction Degree and Prediction of Crossing Pedestrian
In order to prevent collision accidents between pedestrians and cars, the danger degree of pedestrians has been estimated from various viewpoints. From past related studies, the degree can be estimated with focusing on environmental characteristics such as driveway conditions [7], personality factors such as children and the elderly [8], and cognitive development degree [9]. Recent studies have revealed the number of pedestrians who were distracted by texting while walking or listening to music is increasing. Therefore, some studies have been conducted with focusing on their crossing intention and behavior before they cross a driveway. As a related study to estimate distraction degree of a pedestrian, Uemura et al. [10] have proposed a method to estimate the distraction degree of a pedestrian with an error of ± 20% by using acceleration / angular velocity sensor attached to the pedestrian's waist. In our method, we use an acceleration / angular velocity data of waist of a pedestrian to detect whether a pedestrian is distracted or not as well as the method of Uemura et al [10]. In order to predict whether a pedestrian crosses a driveway or not, some related studies focused on traffic volume and head movement. Schulz et al. [11] proposed a method to predict pedestrian who will cross a driveway from pedestrian behavior, such as pedestrian posture and head movement, and traffic conditions, such as cars and other pedestrians on the street. Hamaoka et al. [12] proposed a method to estimate whether safety confirmation of pedestrians is sufficient or not from the change of head angle and its frequency before and after they cross driveways. However, no work has addressed a method to predict crossing pedestrian in distraction.
3. Prediction of Crossing Distracted Pedestrian from Walking Characteristic
3.1. Method Overview
The method calculates the walking characteristics of a pedestrian from movements of his head and body which change when he is distracted and before he crosses a driveway. From these walking characteristics, the method predicts whether the pedestrian is distracted or not and will cross a driveway or not. Figure 1 shows the overview of our method. Whether a pedestrian is distracted or not can be estimated from 3-D acceleration / angular velocity data of his/her waist [10]. In addition, whether the pedestrian will cross a driveway or not can be predicted from changes in the direction of the head and posture of the pedestrian appearing before he crosses the driveway. In the method, 3-D acceleration / angular velocity data of the pedestrian's head and waist are acquired. The method identifies the pedestrian's walking characteristics from these data, detects whether the pedestrian is distracted or not, and predicts whether he will cross a driveway or not. The 3-D acceleration / angular velocity of the waist is acquired with an acceleration sensor attached to the pedestrian's waist like the Uemura et al. [10]. 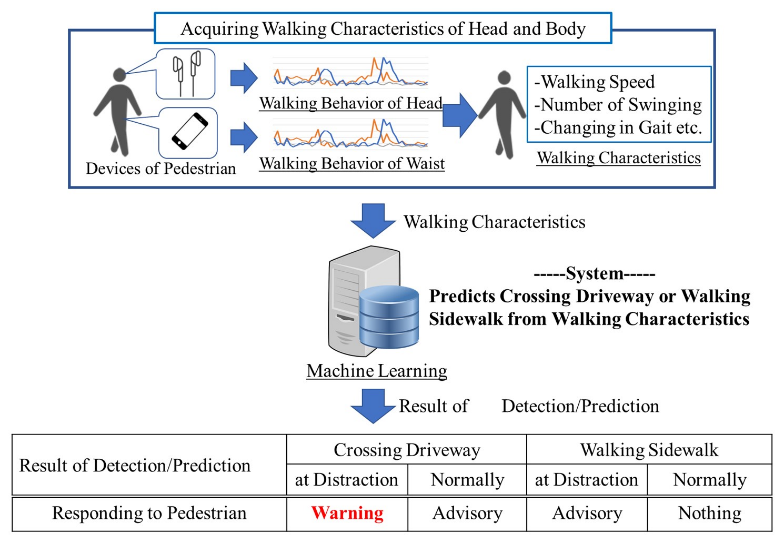 | Figure 1. Prediction of Pedestrian Crossing Considering Walking Characteristics at Distraction |
Then the norm of these data of the waist is acquired as movement of the waist. The 3-D acceleration / angular velocity of the head is acquired with an acceleration sensor attached to the head like the waist. Then the norm of these data of the head is acquired as movement of the head. Further, by applying the Fast Fourier Transform and Peak-Valley analysis to these acquired movements of the head and waist, the walking characteristics of the pedestrian to use detection/prediction are calculated. With the classifier trained in machine learning whose explanatory variables are the calculated walking characteristics of the pedestrian, the method estimates the pedestrian's distracted state and predicts whether pedestrians will cross a driveway or not.Excessive pedestrian warnings can cause pedestrians to ignore warnings. Therefore, in this method, the pedestrian’s state is classified into the following four walking patterns and warning is given only in the patterns which need warning.Walking Pattern 1: Be in distracted state and will crossWalking Pattern 2: Be in distracted state and will walk straightWalking Pattern 3: Be in normal state and will crossWalking Pattern 4: Be in normal state and will walk straightPedestrians in Walking pattern 1 may not notice a car and may start crossing even if there is possibility of collision with the car. Therefore, such pedestrians are judged in danger and given a warning through the mobile devices of the pedestrians. Pedestrians in Walking pattern 2 do not have adequate attention to the surroundings, however, they are unlikely to collide with cars on the driveway. Also, pedestrians in Walking pattern 3 may not cross the driveway in danger because they notice cars by their proper attention to the surroundings. Therefore, the responding to these pedestrians is only advisory. The proposed method assumes that the drivers of the cars are informed that the method detected pedestrians in Walking patterns 2 and 3 who should be paid attention. By this information, the drivers can respond to such a pedestrian by adjusting the speed of the car. Pedestrians in Walking pattern 4 do not receive pedestrian support because there is no possibility of collision with cars on the driveway. From the above, collision accidents of pedestrians and cars can be prevented by warnings and advisory according to prediction results for pedestrians.
3.2. Acquiring Walking Characteristics of Head and Waist of a Pedestrian
The method acquires walking characteristics of pedestrians focusing on the movements of the parts where features appear when they are distracted or before they cross a driveway. As a part that takes a characteristic movement before and after the crossing of a pedestrian, head direction of the pedestrian changes when he does safety confirmation [11]. Also, the gait is different according to whether the pedestrian is in distracted state or not [10]. The gait of a pedestrian appears in the movements of the waist [10]. Therefore, in order to estimate whether a pedestrian is distracted or not and will cross or not, the method acquires movements of the head and waist of the pedestrian. 3-D acceleration / angular velocity data of head and waist are acquired as movements of the pedestrian's head and waist. 3-D acceleration / angular velocity data of the head can be acquired with a hearable device [13]. A hearable device is an earphone type computer that incorporates an acceleration sensor, an angular velocity sensor, and so on. This device constantly detects location information of a pedestrian and acquires 3-D acceleration / angular velocity data of a pedestrians’ head. It is also known that the 3-D acceleration / angular velocity data of the waist can be acquired with an acceleration sensor mounted on the pedestrian's smartphone [10]. With hearable device and smartphones of pedestrians, 3-D acceleration / angular velocity data of pedestrians’ heads and waists can be acquired without placing a burden to pedestrians by wearing other devices. In this research, a pedestrian is wearing acceleration / angular velocity sensors as shown in Fig. 2.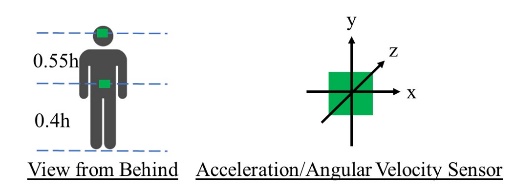 | Figure 2. Acceleration Sensor attached by user |
The 3-D acceleration data in t seconds, which is acquired every 15ms by a sensor attached to a pedestrian is defined as  . The 3-D angular velocity data is defined as
  similarly. These data are expressed by the following equations, as in (1) and (2).
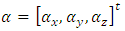 | (1) |
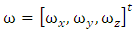 | (2) |
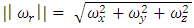
As α and ω contain noise, Kalman filter [14] is applied to α and ω to remove noise. Further, norm of the head and waist of the pedestrian is calculated from α and ω applied Kalman filter. Furthermore, walking speed is calculated. Norms of  and
and  are defined as
  and
and  , respectively. These norms are calculated by the following equation, as in (3) and (4).
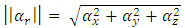 | (3) |
 | (4) |
The walking speed of a pedestrian is calculated by integrating  for each certain section.
3.3. Calculating Effective Walking Characteristics to Estimate Distracted State and Predict crossing the Driveway
Effective walking characteristics for estimation of distracted state of pedestrian and prediction of crossing are calculated from the norms of 3-D acceleration and angular velocity data ( and
and  ) for each of the head and waist described in Subsection 2. Figure 3 shows the flow for calculating the walking characteristics of pedestrians. The mean and variance of
  and
and  calculated as Subsection 3.2 represent the magnitude and variation of movements of pedestrian’s head and waist. Also, as
  and
and  are the waveform data, it is possible to calculate rapid change of pedestrian’s head and waist. In order to calculate this rapid change as a pedestrian's walking characteristics, the Peak-Valley analysis is applied toward
  and
and  (Fig. 4).
 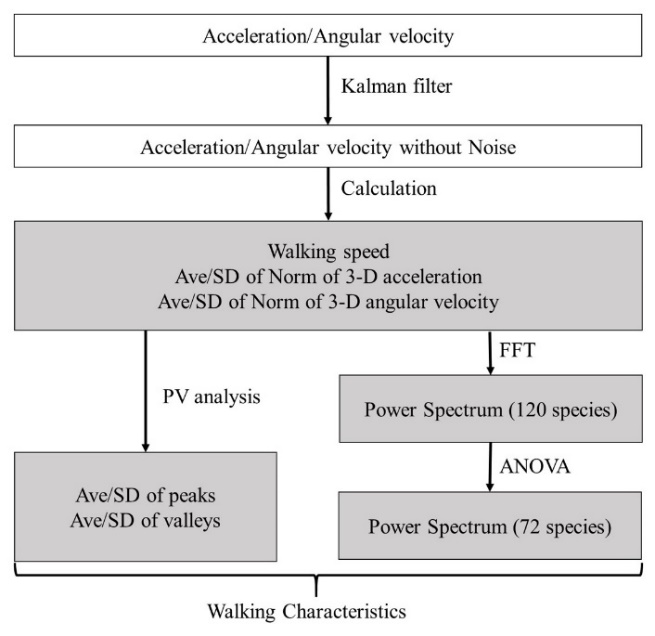 | Figure 3. Walking Characteristics calculated from movement of pedestrian |
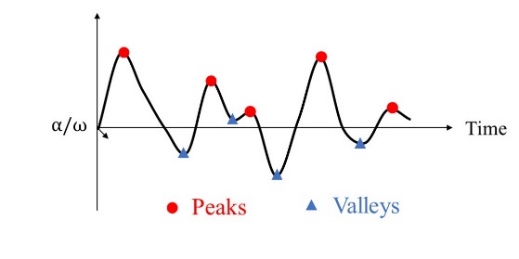 | Figure 4. Peak-Valley Analysis |
Peak-Valley analysis (PV analysis) detects locally maximum values (peak values) and locally minimum values (valley values) as data representing peaks and valleys from waveform data, respectively, based on the difference of adjacent observed data of 3-D acceleration / angular velocity. The detected peak and valley values indicate when and how head and waist movement of pedestrians have changed. These values include various movements of the head and waist. For example, they include a very large movement of the head to confirm the backwards by swinging, and a small movement of the head to see a little right. Therefore, in order to calculate the pedestrian's walking characteristic, it is necessary to set certain threshold values and extract only peaks above these threshold values or only valleys below these threshold values. In this method, we use thresholds for extracting peaks in the regions of the larger three quarters, larger half, largest quarter, and largest value, respectively, in the entire range of each of the norms  and
and  of the head and waist. Also, we use thresholds for extracting valleys in the regions of the smallest value, smaller three quarters, smaller half, and smaller quarter, respectively. The method calculates the difference between the maximum value (denoted by max) and minimum value (denoted by min) of each as dif. The thresholds are calculated by the following formula, as in (5).
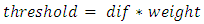 | (5) |
The value of weight is set to 0.25, 0.5, 0.75, and 1, respectively, for extracting peaks. It is also set to 0, 0.25, 0.5, and 0.75, respectively, for extracting valleys. An extracted peak value and valley value are defined as p (w) and v (w) when weight is set to a certain weight w. p (w) and v (w) are extracted from peaks and valleys according to the following formulas, as in (6) and (7). | (6) |
 | (7) |
Figure 5 shows an example in which weight is set to 0.75, threshold is set, and p (0.75) and v (0.75) are extracted. | Figure 5. Extracted Peaks and Valleys when weight is set to 0.75 |
From Fig. 5, it can be seen that only peaks representing larger movement are extracted by excluding peaks under threshold. By Calculating the average and variance of peaks and valleys extracted with each set threshold, the method acquires the walking characteristics of head and waist taking the magnitude of these movement into account. However, the variance of p (1.00) and v(0) are excluded because the number of peak and valley to be extracted is one. Therefore, 14 kinds of walking characteristics are acquired --- (1) mean and variance of peak values in each of larger 75%, 50%, and 25% range, (2) the largest peak value max, (3) mean and variance of valley values in each of smaller 25%, 50%, and 75% range, and (4) the smallest valley value min. These 14 kinds of walking characteristics are calculated from each of four types of data, namely acceleration / angular velocity of the head and acceleration / angular velocity of the waist respectively. Therefore, the 56 kinds of walking characteristics are totally calculated by PV analysis. To calculate characteristics of waveform data from  and
and  of head and waist, Fast Fourier Transform (FFT) apply to
  and
and  . By applying FFT, amplitude spectrum of
  and
and  are calculated every 1 Hz. Amplitude spectrum represents the intensity of waves in a specific frequency band included in the waveform data. It is known that when a pedestrian is distracted, change in gait appear in the amplitude spectrum of a specific frequency band [10]. Therefore, amplitude spectrum of
  and
and  in the waist is important walking characteristics for estimating the distracted state of the pedestrian. Also, since pedestrians do safety confirming of the backwards by swinging their heads, walking characteristics are expected to appear in the amplitude spectrum of the low frequency band of the head. Therefore, the amplitude spectrum of
  and
and  in the head are important walking characteristics for pedestrian crossing prediction. The method uses an acceleration / angular velocity sensor that acquires 3-D acceleration / angular velocity data every 15 ms. Therefore, we deal in only the amplitude spectrum from 1 Hz to 30 Hz which is more than twice the sample rate in the amplitude spectrum calculated by FFT. Since the amplitude spectrum is calculated every 1 Hz, 30 kinds of amplitude spectrum are calculated. The amplitude spectrum is acquired from four kinds of data, acceleration / angular velocity of the head and acceleration / angular velocity of the waist, respectively. Therefore, 120 kinds of amplitude spectrum are totally calculated by FFT. The calculated amplitude spectrum may include unnecessary walking characteristics that lead to lower accuracy in estimating distracted state and predicting cross. Therefore, variance analysis is applied to each amplitude spectrum when the pedestrian takes each of the four kinds of walking patterns to be discriminated, as discussed in Subsection 3.1. From result of variance analysis, 72 kinds of amplitude spectra in which significant differences appear are taken as walking characteristics.
3.4. Classifier by Machine Learning
In this method, a classifier indicating whether a pedestrian is distracted or not and indicating whether he will cross or not is generated by machine learning. Explanatory variables are walking characteristics of head and waist calculated as discussed in Subsection 3. The classifier discriminates which of the four walking patterns mentioned in Subsection 3.1 is occurring from the explanatory variables. The machine learning algorithm to train the classifier is Random Forest (RF) [15]. At first, RF constructs multiple decision trees using training data. After that, it is identified which of the four walking patterns the input test data corresponds, using plurality in the decision results of the decision trees. Each of the decision trees corresponds to one of the four walking patterns. It identifies each of the decision trees identify whether its corresponding walking pattern is occurring or not. RF outputs the walking pattern with the largest number of detection as the identification result. In this way, calculation using RF is divided into learning phase and identification phase. In the learning phase of this method, training data of the four-walking patterns to be identified is learned beforehand. In the identification phase, one of the four walking patterns is detected in real-time with the current walking characteristics acquired from the pedestrian as the explanatory variables.
4. Prediction of Distracted Pedestrian Crossing
4.1. Experimental Purpose and Overview
An experiment was conducted to estimate whether a pedestrian is distracted or not and predict whether he will cross a driveway or not from 3-D acceleration / angular velocity data of the pedestrian's head and waist. The total number of the subjects was 18, including 13 males and 5 females aged 20 to 24. In this experiment, in order to acquire 3-D acceleration / angular velocity data of the head and waist, acceleration sensors were attached to the subject's head and waist (Fig. 2), and the acceleration / angular velocity data of each of the sensor was acquired every 15 ms. Both acceleration and angular velocity were acquired in three dimensions. When people walk on the street, they usually pay attention to circumstances to some extent, even if they do not pay meticulous attention. We refer to this state as normal state in this study. On the other hand, we refer to state that people do not pay attention to circumstances as distracted state. Figure 6 shows the experimental section of this experiment.Considering the safety when the subjects crossed the driveway, the driveway inside Ritsumeikan University in which we could control the traffic of cars was virtually regarded as the driveway in the city area. The subjects walked one by one in the experimental section of Fig 6. The subjects randomly walked on the following patterns 1 and 2 at respectively 6 times in normal state and 6 times in each distracted state.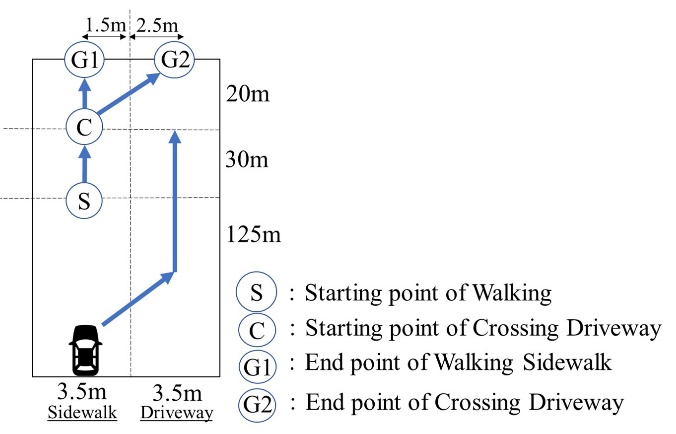 | Figure 6. Experimental Section |
Pattern 1: A subject walked from the starting point of walking (S point in Fig. 6) to the end point of walking sidewalk (G1 point in Fig. 6)Pattern 2: A subject walked from the starting point of walking (S point) and crossed the driveway from the start point of crossing driveway (C point) to the end point of crossing driveway (G2 point)For G1 point, we assumed that the pedestrian walked on the sidewalk without crossing the driveway. For G2 point, we assumed that the pedestrian obliquely crossed the driveway without crosswalk. The subjects walked along walking patterns 1 and 2 in normal and distracted states of the subjects, so that 3-D acceleration / angular velocity data of the four-walking patterns described in Subsection 3.1 were acquired. Prior to starting this experiment, the subjects practiced walking in the experimental section until they were satisfied to walk as usual. Also, we did not designate the walking speed and the timing of the backward confirmation toward the subjects. We asked the subjects to walk on the sidewalk and cross the driveway as usual. In this experiment, it is necessary to let the subject walk in distracted state. Listening to music with earphones was mentioned as a factor that pedestrians become distracted [16]. In addition, by making the subject walk while answering a recalling task, the subject walked in a distracted state [10].
4.2. Strategy to Make the Subjects Walk Similarly in Real Roads
This experiment was conducted on a driveway where we could control the traffic of cars in the university to take safety into account when walking in the pattern 2. Figure 7 shows the image of the driveway on which this experiment was conducted.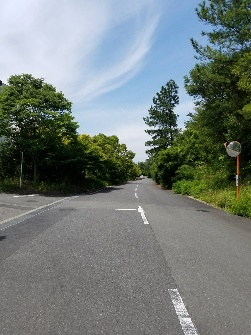 | Figure 7. The driveway where this experiment was conducted |
In this experiment, in order to make the subjects conscious of the traffic of the car as well as the real driveway, we ran the car at random during the experiment. The vehicle was driven at a timing of collision with a subject if the subject crosses at a general walking speed of 4.0 km/h [17]. The running speed of the car was 30 km / h at the maximum, and we instructed the drivers to brake at 50 m before C point in order not to collide with the subject. We did not notify the subjects when the car was running. As factors that pedestrians are aware of approaching cars on real driveways, there are visual confirmation and running sounds of cars. Therefore, we used a gasoline-powered vehicle so that the subjects can hear running noise in this experiment.
4.3. Result of Experiment
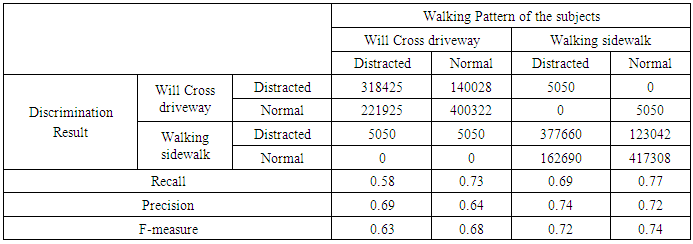
In this experiment, a classifier was constructed using Random Forest which is supervised learning. For fair evaluation, 18 cross validation was carried out. In walking of humans, a certain amount of time is required from the start to stabilization. During this period, calculated walking characteristics contains a lot of noise. In order to eliminate the noise at the start of walking, the data section handled to predict crossing was taken from 5m after S point to C point. The explanatory variables were the walking characteristics described in Subsection 3.3, and the objective variable was the walking pattern described in Subsection 3.1. Random Forest uses many decision trees learned by randomly sampled training data. Therefore, bias in random sampling sometimes cause bias of the discrimination result. In order to reduce the influence due to this bias, we acquired sum of 100 discrimination results acquired with Random Forest 100 times. Table 1 shows sum of the 100 discrimination results. From Table 1, the lowest recall in four-walking patterns was 0.58 at distracted state and “will cross driveway”, and many of the misidentified results were normal state and “will cross driveway”. The lowest precision in four-walking patterns was 0.64 at normal state and “will cross driveway”, and many of the misidentified results were distracted state and “will cross driveway”. The F-measure value in four-walking patterns were around 0.70 in general. Even the lowest F-measure was 0.63 at distracted state and “will cross driveway”.Table 1. Result of Random Forest with walking characteristics in head and waist
 |
| |
|
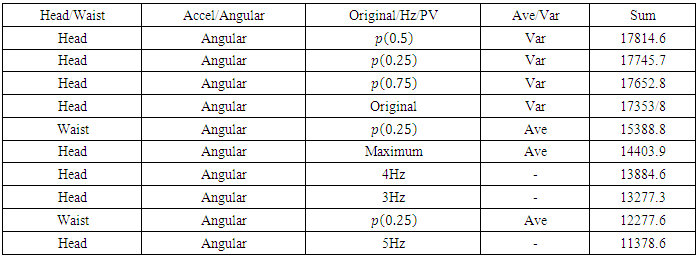
Table 2 shows the variable importance of Top 10 acquired at Random Forest. Table 2 shows that among the explanatory variables included in the top 10 significant variables, the eight types are the walking characteristics of the head. Therefore, we found that walking characteristics of pedestrian's head are more useful than walking characteristics of waist in estimation of four-walking patterns.Table 2. Top 10 Significant Walking Characteristics of head and waist
 |
| |
|
5. Discussion
5.1. Possibility to Estimate Four-walking Patterns when Reducing Explanatory Variables
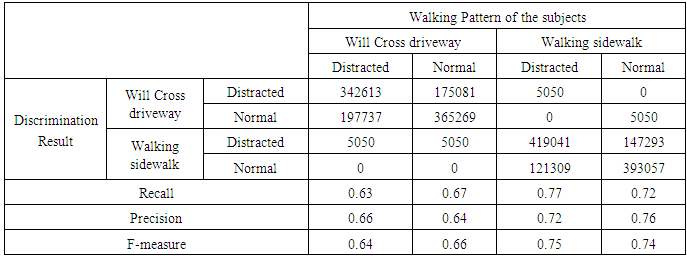
In this section, we consider whether type of data acquired from the subjects can be reduced or not. Based on Table 2, the eight types of the top 10 significant variables were walking characteristics of head. Therefore, we acquire the discrimination result using Random Forest 100 times again using only the head walking characteristics as the explanatory variables. We also confirm possibility to estimate whether a pedestrian is distracted and will cross a driveway or not from the head walking characteristics. Table 3 shows the result of discrimination by explanatory variables of only the head. Table 3. Result of Random Forest with walking characteristics in head
 |
| |
|
From Table 3, the lowest recall in four-walking patterns was 0.63 at distracted state and “will cross driveway”, and many of the misidentified results were normal state and “will cross driveway”. The lowest precision in four-walking patterns was 0.64 at normal state and “will cross driveway”, and many of the misidentified results were distracted state and “will cross driveway”. The F-measure value in four-walking patterns were around 0.70 in general. Even the lowest F-measure was 0.64 at distracted state and “will cross driveway”. As this result is about the same as the result of the walking characteristics of the head and waist as explanatory variables, it is possible to predict four-walking patterns about the same accuracy from only the head walking characteristics. Therefore, since data to be acquired from a pedestrian can be reduced to only the head, it can be said that it is possible to reduce equipment and cost to be worn by the pedestrian. Table 4. Result of Random Forest with walking characteristics in waist
 |
| |
|
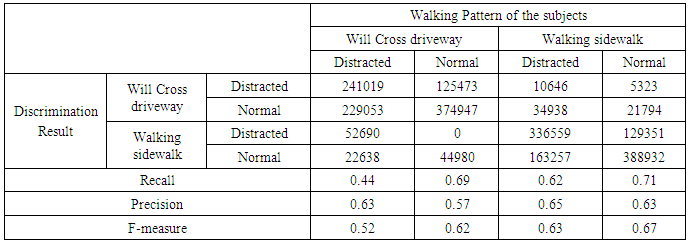
Similarly, Table 4 shows the discrimination results when only the waist characteristics are used as explanatory variables. From Table 4, the lowest recall in four-walking patterns was 0.44 at distracted state and “will cross driveway”, and many of the misidentified results were normal state and “will cross driveway”. The lowest precision in four-walking patterns was 0.57 at normal state and will cross driveway, and many of the misidentified results were distracted state and “will cross driveway”. The F-measure value in four-walking patterns were around 0.60 in general. The lowest F-measure was 0.52 at distracted state and “will cross driveway”. Based on these results, when only the gait characteristics of the waist are used as explanatory variables, the F-measure decreases about 0.1 compared with the case when the walking characteristics of the head and waist are used as explanatory variables. Therefore, it is considered to be difficult to estimate four-walking patterns from only the waist walking characteristics.
5.2. Limitation
Some limitations exist in this study. First, this method uses a hearable device and smartphone of pedestrians to acquire 3-D acceleration / angular velocity data of the heads and waists Therefore, in order to apply this method to pedestrians, it is necessary that they have these devices. In order to apply to more pedestrians, we should consider how to acquire these data of the heads and waists with other devices or image processing. Second, in the experiment, the subjects were listening to music with their earphones and walking while answering a recall task in order to let them walk in distracted state. Therefore, it is not clear that this method can identify which walking pattern a pedestrian is toward for distracted pedestrians to be caused by other factors or shallow distracted pedestrians. Finally, this experiment was conducted on a drive way where we could control the traffic of cars in Ritsumeikan University. Therefore, it is not clear that this method can estimate which walking pattern the pedestrians is in real road with general pedestrians and cars.
6. Conclusions
This paper has proposed the method to estimate whether a pedestrian is distracted or not and predict whether he will cross a driveway or not from the walking characteristics of his head and waist in order to prevent collision accidents with distracted pedestrians and cars. The walking characteristics of head and waist are calculated from 3-D acceleration / angular velocity sensors attached to the heads and waists of pedestrians. Acquiring walking characteristics such as wandering of gait in the left and right direction and head movement due to safety confirming of the backwards by swinging their heads, the method estimates whether a pedestrian is distracted or not and whether he will cross the roadway or not. From result of Random Forest, the method can predict four-walking pattern of pedestrians with F-measure of about 0.70. Even when only the walking characteristics of the head were used as explanatory variables, it was possible to predict four-walking patterns with about the same degree of F-measure as the walking characteristics of the head and waist as explanatory variables. As a result, when the method acquires walking characteristics of a pedestrian's head with a hearable device or the like, it is predicted in which of the four-walking patterns the pedestrian is. A system that does not impair convenience and practicality can be realized by corresponding respond according to the walking pattern that discriminate a pedestrian. In future works, we will clarify the cause of the lowest F-measure of distracted state and “will cross the roadway” with attention to pedestrian walking characteristics and individual differences. We will also verify whether it is possible to improve the accuracy of prediction of four-walking patterns or not from the cause of misidentification that we will clarify.
References
| [1] | World Health Organization. "More than 270 000 pedestrians killed on roads each year." Retrieved March 1, (2013). |
| [2] | Matsui, Yasuhiro, et al., "Car-to-pedestrian contact situations in near-miss incidents and real-world accidents in Japan.", 22nd International Technical Conference on the Enhanced Safety of Vehicles (ESV), pp. 11-0164 (2011). |
| [3] | Chen, Ping-Ling, Pai, Chih-Wei, "Smartphone gaming is associated with pedestrians’ head-turning performances: an observational study of street-crossing behaviors at uncontrolled intersection in Taipei.", International Journal of Sustainable Transportation just-accepted, 12 (2018), issue 1, pp. 12-18. |
| [4] | Schwebel, David, et al., "Distraction and pedestrian safety: how talking on the phone, texting, and listening to music impact crossing the street." Accident Analysis & Prevention, 45, pp. 266-271 (2012). |
| [5] | Wells, Hayley, et al., "Distracted pedestrian behavior on two urban college campuses.", Journal of community health, 43(1), pp. 96-102 (2018). |
| [6] | Baddeley, Alan., “Working memory: theories, models, and controversies, Annual review of psychology”, 63, pp. 1-29 (2012). |
| [7] | Benjamin, Barton, David, Schwebel, “The roles of age, gender, inhibitory control, and parental supervision in children’s pedestrian safety”, Journal of Pediatric Psychology, 32 (5), pp. 517-526 (2007). |
| [8] | Benjamin, Barton, Barbara, Morrongiello, “Examining the impact of traffic environment and executive functioning on children’s pedestrian behaviors, Developmental Psychology”, 47 (1), pp. 181-192 (2011). |
| [9] | Mark, Neider, et. al., “Pedestrians, vehicles, and cell phones”, Accident Analysis & Prevention, 42(2), pp. 589-594 (2010). |
| [10] | Uemura, Yoshihiro, et al., "Estimating distracted pedestrian from deviated walking considering consumption of working memory." Computational Science and Computational Intelligence (CSCI), 2016 International Conference on. IEEE, pp. 1164-1167 (2016). |
| [11] | Andreas, Schulz, Rainer, Stiefelhagen, “Pedestrian intention recognition using latent-dynamic conditional random fields”, In Intelligent Vehicles Symposium (IV), 2015 IEEE, pp. 622-627 (2015). |
| [12] | Hamaoka, Hidekatsu, et al., “A study on the behavior of pedestrians when confirming approach of right/left-turning vehicle while crossing a crosswalk.", Journal of the Eastern Asia Society for Transportation Studies, 10, pp. 2109-2122 (2013). |
| [13] | Makoto, Tachibana, et al., "Method of checking earphone wearing state.", U.S. Patent, No. 9351090, 24 May 2016. |
| [14] | Rudolph, Kalman, “A new approach to linear filtering and prediction problems”, Journal of basic Engineering, 82(1), pp. 35-45 (1960). |
| [15] | Leo, Breiman, “Random Forests”, Journal of Machine Learning, 45, pp. 5-32 (2001). |
| [16] | Corey, Basch, et al., “Pedestrian behavior at five dangerous and busy Manhattan intersections”, Journal of community health, 40(4), pp. 789-792 (2015). |
| [17] | Perry, Jacquelin, Jon, Davids. "Gait analysis: normal and pathological function." Journal of Pediatric Orthopaedics, 12(6), pp. 8-15 (1992). |

 Abstract
 Reference
 Full-Text PDF
 Full-text HTML