Yoshihiro Uemura1, Yusuke Kajiwara2, Hiromitsu Shimakawa2
1Graduate School of Information Science and Engineering, Ritsumeikan University, Shiga, Japan
2College of Information Science and Engineering, Ritsumeikan University, Shiga, Japan
Correspondence to: Yoshihiro Uemura, Graduate School of Information Science and Engineering, Ritsumeikan University, Shiga, Japan.
| Email: |  |
Copyright © 2017 Scientific & Academic Publishing. All Rights Reserved.
This work is licensed under the Creative Commons Attribution International License (CC BY).
http://creativecommons.org/licenses/by/4.0/

Abstract
This paper proposes a method to estimate the distraction degree of pedestrians, using the acceleration and the angular velocity while walking. This method uses an acceleration sensor attached on the back of the pedestrian. The acceleration and the angular velocity are obtained while the pedestrian is walking. In addition to that, walking features are calculated based on the obtained data. Some studies point out distraction of the pedestrian relates to consumption of working memory. We assume considering the relationship between consumption of working memory and walking behavior suggests the effectiveness to estimate distraction of the pedestrian. When each pedestrian is walking while consuming working memory, for example thinking about something, their walk changes. A machine Learning method, Random Forest, is applied to classify whether the pedestrian is distracted using features of walking. An experiment suggests the method estimates the distraction degree of the pedestrian with 20% error. The result indicates the method can find distracted pedestrians whose working memory is consumed. We discuss why we can estimate the distraction degree of the pedestrian from walking feature components with the variable importance. We found some features appeared in the middle and high frequency bands. Finally, we discuss the feasibility of our proposed method.
Keywords:
Gait, GIS, Distraction, Pedestrian, Driver, Sensor
Cite this paper: Yoshihiro Uemura, Yusuke Kajiwara, Hiromitsu Shimakawa, Figuring out Distraction Degree from Working Memory Consumption for Pedestrian Safety, International Journal of Internet of Things, Vol. 6 No. 1, 2017, pp. 1-8. doi: 10.5923/j.ijit.20170601.01.
1. Introduction
Traffic accidents kill more than 270,000 pedestrians every year in the world according to the announce of World Health Organization. Two kinds of negligence affect traffic accidents involving pedestrians. One of them is drivers' problem. For example, phone-call during driving causes a traffic accident. The other is pedestrians' negligence. One of the pedestrians' negligence is attention deficit. While walking, if they do some other tasks, such as thinking about specific things, they distract their attention.To prevent traffic accidents caused by drivers, Geographic Information System (GIS) is proposed. GIS is a technology which visualizes and manages pluralistic data in real environment. It leads drivers deep analysis and rapid preventive decision. In the field of transportation, GIS reflects some statistical information such as traffic accident history and sudden braking cases on an actual map. Some applications utilize the information in GIS. Safety Map [1] is one of the systems which visualizes traffic accident history to reduce the number of traffic accidents. Waze [2] depends on user's comments, which are shared with both users and drivers. However, the current systems only utilize statistical information or user's comments. They do not consider the current states of pedestrians on the street and in the intersection. We propose a method which finds distracted pedestrians to prevent traffic accidents involving pedestrians. To prevent traffic accidents, pedestrians need to pay attention to the surroundings. This study finds the pedestrian who is doing several tasks at the same time. The method distinguishes whether he/she is distracted. In addition, it calculates the degree of the distraction to provide the suitable alerts to the pedestrian. To find a distracted pedestrian, this method measures the walking of pedestrians using acceleration sensors. When the system finds distracted pedestrian, the rough position is reflected to GIS to be shared with drivers, for example, through a car navigation system. The driver recognizes the road where pedestrians are distracted. At the same time, the system calls attention to the distracted pedestrians according to the distraction degree. This method can prevent traffic accidents so that people should enjoy a safe and secure society.In the paper, section 2 introduces existing works. Section 3 explains our method to calculate the feature of pedestrians' walking behavior. In Section 4, we indicate the experiment and evaluation. In Section 5, the paper discusses significant features of pedestrians' walking behavior. Section 6 summarizes our work.
2. Existing Works
Several studies are proposed to grasp the distraction of persons. Hamaoka et al. detected whether a pedestrian confirms an approach of right/left-turning vehicles or not using acceleration sensors [3]. Since the sensor is attached on the head of the user, it is a large burden for the user. Music et al. detected texting while walking from the standard deviation of meter readings from acceleration sensors [4]. However, all pedestrians are not necessarily distracted because of texting while walking. Gallahan et al. estimated the distraction of the car drivers using Kinect [5]. Kinect needs a place to install. We cannot assume such an environment in the outside. Mizoguchi et al. estimated distracted drivers while driving based on the eye-movement [6]. It is difficult to measure the eye-movement of the pedestrian in the outside. Zaki et al. detected distracted pedestrians based on the video analysis using cameras [7]. Cameras are poor at shielding by obstacles such as vehicles and other pedestrians. Killane et al. grasped the distraction of the user while walking using the Electroencephalogram (EEG) [8]. However, EEG is expensive. In addition, we can apply it to only limited environments. Therefore, we need a system which realizes the low burden for the user, the low cost to install. We must also avoid the problems above. There are no study that estimates the distraction degree as a continuous value.
3. Estimating Degree of Distraction
3.1. Method Overview
We aim at achieving a system to estimate degree of distraction of a pedestrian. The method considers gait changes using an acceleration sensor, and estimates degree of distraction accordingly. When pedestrians are distracted while walking, their walking features differ from normal [9]. For example, when pedestrians are thinking about something deeply, they lose their consciousness about walking, then their walking pace gets changed. The service which utilizes the method is shown in Figure 1.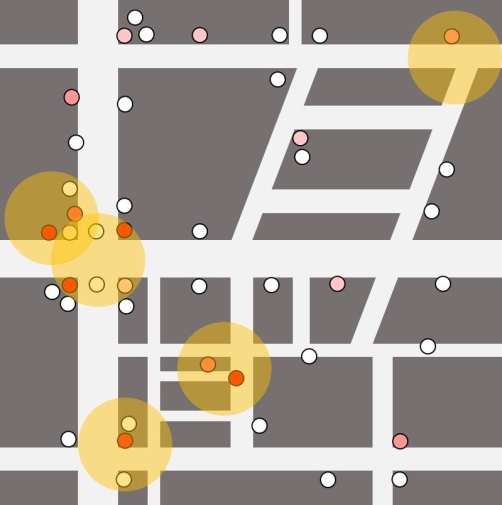 | Figure 1. Service overview |
The small circles and the big circles represent each pedestrian and dangerous area, respectively. Degree of distraction is shown light and shade of red color. Deep red means “highly distracted”, and white means normal state. When the system finds a distracted pedestrian based on the walking, the rough position of the pedestrian, which protects his/her privacy, is reflected to a GIS. The position is regarded as a dangerous area and shared with drivers. To consider the road information, drivers can drive more safely. In addition, the system alerts the pedestrian who is distracted. The alerts depend on degree of distraction. This procedure prevents traffic accidents. Moreover, by storing long-term histories, it is possible to find localized reasons of distraction. It can be utilized such as urban design.The system estimates degree of distraction of a pedestrian based on the walking conditions using an acceleration sensor. The conventional method [10], which classifies whether the user stays in a distracted state, conducts high dimensional machine learning. In this study, we assume the method is applied to many pedestrian in real time at the same time. Therefore, high dimensional machine learning has a heavy load on computers. This study performs dimension reduction. The method to estimate degree of distraction is shown in Figure 2.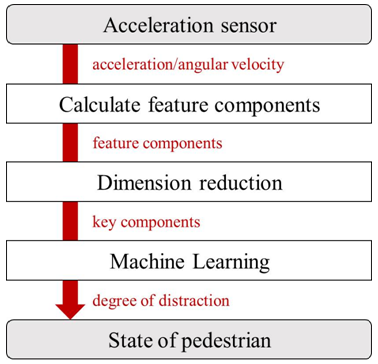 | Figure 2. Method overview |
The method follows the procedure below.1. The acceleration sensor grasps acceleration and angular velocity periodically.2. The system calculates feature components which represent walking conditions.3. Dimension reduction is applied to feature components, and generate key components.4. The system constructs a classifier based on key components.5. The system estimates degree of distraction of the user.A new user’s degree of distraction is estimated based on the acceleration and the angular velocity while walking.
3.2. Grasping Gait Features using Acceleration Sensor
An acceleration sensor grasps 3-D acceleration and 3-D angular velocity. Some existing works introduce the method to grasp walking features. Kurihara et al. estimated walking exercise intensity based on the values of 3-D acceleration sensors [11]. Gafurov et al. constructed a system for gait authentication using acceleration sensors [12]. These existing works grasps features of body movement using acceleration sensor. Typical smartphones and some wearable devices contain acceleration sensors, and are widely used all over the world. Their utilization prevents users from additional devices, which achieves cost reduction. In this study, the user attaches the acceleration sensor on his/her back shown in Figure 3.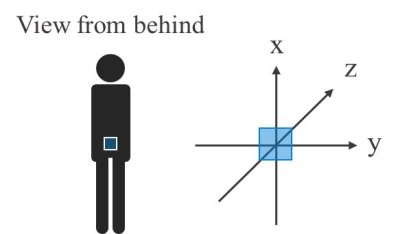 | Figure 3. Acceleration Sensor attached by user |
When the user walks, the acceleration and the angular velocity are obtained periodically. At this time, the sample rate of the acceleration sensor is 10 ms per detection. The general walking speed is about 4.0 km/h [4], and the stride which is the distance between the current step and the next one is about 120 to 180 cm. When dividing the stride by walking speed, the time per stride is calculated to be about 1.1 to 1.6 seconds. Therefore, we assume that walking can be sufficiently detected with this sample rate.
3.3. Definition of Distraction
It is said persons use their working memory (WM), when they consider something in their minds. WM is a pseudo memory, consumed when people do something. Its capacity is limited. Its utilization is managed by their brain. The capacity of WM depends on each person. When it is highly consumed, people face trouble. For example, by talking with a mobile phone during driving, the driver cannot concentrate on driving and accidents occur easily. Besides, standing a pot on a fire while talking with a neighbor for a long time causes fire. Figure 4 shows Baddley’s working memory model [14]. | Figure 4. Baddley’s Model of Working Memory |
The internal structure of the working memory is divided into four parts, Phonological loop (PL), Visuo-spatial sketch-pad (VSSP), Episodic Buffer (EB), and Central Executive (CE). PL, VSSP, EB are short-term processing mechanisms responsible for the processing of voice information, visual information and stored information, respectively. These depend on the actual human behavior and are controlled by the CE. The CE also controls the attention at the same time [14]. Therefore, if processing requests to PL, VSPP, EB are excessive, that is, requests to process various operations at one, the CE loses control of the attention. That means, the person falls into distracted. Therefore, in this study, we estimate the degree of consumption of WM and define its degree of consumption as degree of distraction. Some studies refer to the relationship between working memory and distracted state [14-16].
3.4. Generation Feature Components of Acceleration and Angular Velocity
A distracted pedestrian is expected to have a different walking pace than a normal pedestrian. This is because attention to other things, such as thinking about something, prevents them from being conscious about the walking. In order to acquire such features, we define feature components shown in Figure 5.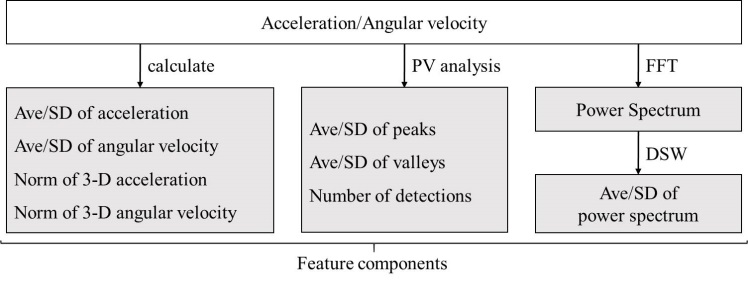 | Figure 5. Feature components |
Ave and SD in the figure refer to average and standard deviation, respectively. We obtain 3-D acceleration and 3-D angular velocity in a fixed interval. We assume the proceeding direction of the user is the positive direction of the z-axis, and based on the z-axis, the direction of up-down is the x-axis, the direction of right-left is the y-axis. We refer to acceleration vector  as a grasped acceleration,
  as a grasped angular velocity (Equation 1, 2). Each components of the feature component represents acceleration/angular velocity of the x-axis, y-axis, and z-axis, respectively.
 | (1) |
 | (2) |
In addition to them, this paper defines following components to consider the attaching angle of the sensor.  and
and  represent the norm of 3-D acceleration and 3-D angular velocity, respectively (Equation 3, 4).
 | (3) |
 | (4) |
The average and standard deviation of these components are defined as the feature components. In addition to these walking features, the following features are calculated.Ÿ Power spectrum of each element of the acceleration vector, each element of the angular velocity vectorŸ Peaks and valleys of each element of the acceleration, each element of the angular velocityAcceleration and angular velocity acquired rapidly change due to body movement. In order to acquire this change, this study applied peak/valley analysis (PV analysis) on each acceleration and angular velocity (see Figure 6).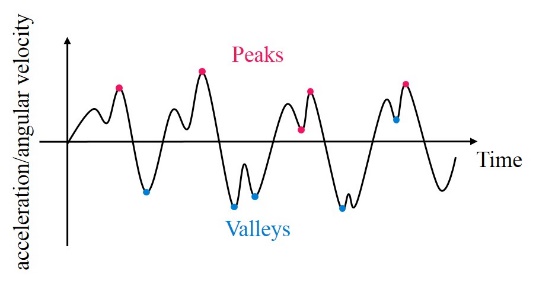 | Figure 6. Peaks and Valleys of walking features |
The method detects peak and valley based on difference of adjacent acceleration and angular velocity. When this difference is greater than the threshold, it is detected as peak or valley. To calculate the threshold, let diff be the difference from the maximum value of the feature components and the minimum one. Letting len vary 25, 50, 75, and 100, the threshold is derived in Equation 5. | (5) |
The average, the standard deviation, and the number of detection of these factors are generated as feature components.In order to take the characteristics of the waveform data into consideration, power spectrum is calculated based on each element of the acceleration vector, each element of the angular velocity vector using Fast Fourier Transform (FFT). We assume that the change in walking pace when it the pedestrian becomes distracted appears in the power spectrum of a specific frequency band. The power spectrum represents the intensity of the wave in a specific frequency band in the waveform data. The power spectrum is calculated based on the input acceleration and angular velocity, respectively. To consider the characteristics on a specific frequency band, 3 sizes of windows are prepared and slid from low frequency to high frequency (see Figure 7). | Figure 7. Dynamic Sliding Window (DSW) |
In this time, the frequency band for calculating the power spectrum is 0 to 4.0 Hz and the window sizes are 0.1 Hz (small), 0.5 Hz (medium), 1.0 Hz (large). The slide size is a half of the window size. In each window, average and standard deviation of the power spectrum are calculated as feature components.
3.5. Dimension Reduction
This method generates a total of 1968 dimensional feature components. As shown in Figure 2, the degree of distraction is estimated using a machine learning method. For such high dimensional data, when applying machine learning, the load on the computer is large. Therefore, this study proposes a real-time attention degree estimation method considering the load on the computer. To consider the load, the method performs a dimension reduction method. Principal component analysis is mentioned as a method of dimension reduction [17]. Principal component analysis calculates n-dimensional principal components from n-dimensional data representing a certain objective variable. Each of the principal components has a contribution rate indicating how much the objective variable is expressed. Dimension can be reduced by extracting the principal component with high contribution ratio. In addition, since the noise is eliminated, there is a possibility that the identification accuracy is improved. Therefore, in this study, principal component analysis is applied to the computed 1968 dimensional feature components to reduce the dimension and construct a system with a lower load on the computer.
3.6. Learning and Identification
We examine relationships between walking features (gait vector) and distracted state. Among various machine learning methods which are widely used, this paper uses the Random Forest (RF). RF computes multiple decision trees during the training of the data. It predicts the class, taking the node of the individual trees. Some studies introduce RF provide high generalization capability. This method has two steps; the learning step and the identification step. In the learning step, it creates models from a pair of a gait vector and the states of the user (distracted or not) presented as an instruction signal. In the identification step, it identifies whether the user is distracted corresponding to a new gait vector through the model generated in the learning step. The identification step is only applied, only when the new person uses the system.
4. Possibility of estimating Degree of Distraction
4.1. Experimental Purpose and Overview
An experiment was conducted to estimate the degree of user distraction in Section 3 from the acceleration and the angular velocity while their walking. We used a 3-D acceleration sensor, and its communication frequency is 10 ms. Subjects were 14 males and 6 females whose age ranges from 21 to 25. Each of them wore an acceleration sensor on the point 5.0 cm upper from the coccyx. The acceleration sensor attached to the user was connected to a laptop PC with Bluetooth. The walking range was 14.0 m × 3.0 m as Figure 8 shows. | Figure 8. Experimental Environment |
A subject starts walking from the position of the figure and goes straight ahead 14 m. At the start of walking, the tester loads the subtask presented in Section 4.2. The subject continued to respond to his/her subtask until the walking ended. We acquired the number of responses. Each trial was repeated 20 times. Every subject took a rest for about 5 minutes after 10 trials to prevent fatigue from affecting on a specific person.
4.2. Uniform Distraction
To artificially make subjects run into a distracted state, uniformly in each trial, we imposed a sub-task on them. Calculation tasks and reading tasks are proposed as a sub-task [18]. However, since the subject is walking, it is difficult to send visual information to the walking subject. Lundin-Olsson et al. presented that some subjects stopped walking when a recalling task are imposed. It suggests that the subject’s attention resources are greatly consumed by the task so that he/she cannot continue walking [19]. Therefore, in this study, a recalling task is loaded as a sub-task. The tester gives one specific topic to the subject at the start of walking. The subject starts to walk, at the same time, he/she mentions something applicable for the topic as many as possible. For example, when a topic is “White Flower”, the subjects answer “Lily”, “Chamomile”, and so on, while their walking. At the same time, the following features appear.Ÿ Subject repeats the word "White Flower" given by the tester in his/her mind many times. It means PL described in Section 3.3 is used.Ÿ VSSP is used to envision the image of "White Flower" in his/her mind.Ÿ In order to remember what the tester said, EB which controls short-term memory is consumed.As a result, the CE gets busy. Since the CE is also responsible for controlling attention resources, its control function gets weakened, which makes the subject distracted. We regard the fewer number of answers applicable to the topic, the more distracted the subject.
4.3. Experimental Result
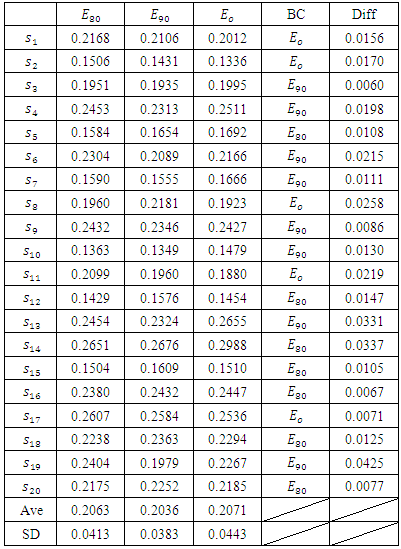
This study refers the number of responses to the recalling task to the distraction degree. This is because subjects concentrate on responding when they cannot find any answer. The number of responses in the recalling task is normalized from 0 to 1, considering individual differences. The normalized responses are taken as the response variable of RF. Using 20 data sets, each of which is acquired from an individual subject, we take 20-fold cross-validation in estimations. This study only considers data acquired when the subject walked around the central of the walking range, to prevent noises around the start point and the end point. RF is trained with 19 groups, while its performance is measured with the remaining group. We evaluate estimation error E calculated with the following formula. Where Nr and D represent the number of responses and the estimated distraction degree, respectively.We set the estimation error when the cumulative contribution rate is 80% and 90% in the principal component analysis to
  and
and  , respectively.
  is calculated with 14 dimensional principal components, and
  is calculated with 31 dimensional principal components. In addition, let
  be the estimation error in the case the principal component analysis is not applied.
  is calculated with 1968 dimensional principal component. The estimation error for each subject is show in Table 1.
  represents each subject, where the gray line shows female subjects. The item, BC, in the table, represents Best Classifier. The last item, Diff, in the table head is the difference between the maximum value and the minimum value of the estimation error in the same subject.
Table 1. Estimation Error in each subject
 |
| |
|
Even when the principal component analysis is applied to reduce the dimensions, the estimation error is less than the same as before the reduction  . Table 2 shows the average value of the estimation error between the male subjects and the female subjects.
Table 2. The Estimation Error between Males and Females
 |
| |
|
We tested the null hypothesis as “there is no difference in the estimation error between males and females” with Mann–Whitney U test, and the null hypothesis was not rejected. Therefore, we cannot say error difference between males and females.
5. Discussion
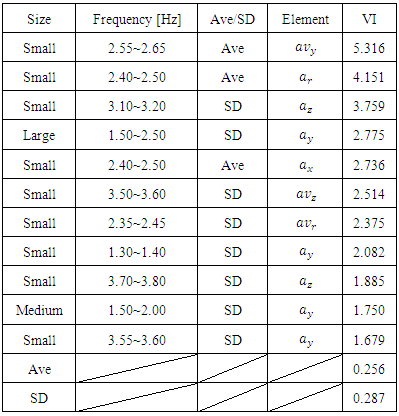
Let us discuss what components strongly affected the estimation. We consider the variable importance (VI) of top 10 feature components shown in Table 3.Table 3. Top 10 Significant Feature components
 |
| |
|
All of these components are average and standard deviation of the power spectrum generated with FFT. Differences appear during periodic motion within a certain walking interval. Fig 8 shows the summary of frequency bands. The darker the red color band, the more significant components appear.Features appear in the middle frequency band or in some parts of the high frequency band. In other words, it is implied that another minute movement appears in their walking when pedestrians are distracted. In order to confirm it, we consider  and
and  as representatives of 3D acceleration and 3D angular velocity, respectively. The distraction degree is divided into three levels;
 ,
,  ,
,  . The values in each level are shown in Table 4.
 | Figure 9. Important Frequency band |
Table 4. Feature of Acceleration and Angular Velocity
 |
| |
|
 mainly represents the movement in the direction of walking,
  includes the movement of some body parts. The table has revealed the following features.Ÿ When the distraction degree is high, the acceleration is moderate, but the angular velocity becomes increased. That is, the body is deviated. It implies that the subject needs to recall something with great efforts, which changes the movement of some body parts in walking motion.Ÿ When the pedestrian walks with middle level of distraction, the acceleration and the angular velocity are both moderate. Therefore, it is comparatively stable walking compared to the case of High and Low. It implies that, when the environment provides fair prospects, the subject only concentrates on the recalling tasks, switching off the CE.Ÿ When the degree of distraction is low, the acceleration and the angular velocity gets higher. In other words, the gait becomes faster and the body gets deviated. It implies the subject increases walking speed because the task is simple. It affects him/her sot that their body movement gets deviated.Since the above features can be acquired with the acceleration sensor, we can conclude the method can estimate distraction degree. Even in the case of the principal component analysis is applied, it is assumed that the features of these frequency bands remain as components of a high contribution ratio. It explains similar features can be seen in
  and
and  .
.
6. Conclusions
This paper has proposed the method to estimate the distraction degree of the pedestrian for preventing traffic accidents caused by the negligence of pedestrians. In order to find a pedestrian concentrating on other task at the same time as their walking, we have focused on the gait of pedestrians which is obtained using an acceleration sensor attached on their back. We have focused on the working memory consumed when they engage in concurrently performing multiple tasks. To reflect this, we have constructed the model that assumes the distraction degree gets high when the consumption of working memory is high. For the estimation, Random Forest, a machine learning method, has been applied. Through the experiment, we have proved the method estimates the distraction degree with an error of about 20%. As a result, GIS can show the rough position of distracted pedestrians, which is helpful to avoid traffic accidents. In addition, the system alerts the pedestrians who are distracted. The alerts depend on the degree of distraction.In this study, we loaded the recalling tasks. The way to consume working memory depends on the behavior of a pedestrian. We must consider other behaviors, such as talking with someone while walking and so on, as future works. In addition, we will also conduct evaluation experiments not only in open spaces but also in intersections as a more complicated environment. For example, when the signal changes red at an intersection, the pedestrian needs to stop. However, when he/she is distracted, signal recognition will be delayed. Considering gait changes like this case, the estimation will get accurate. Combining distractions in various environments proves the applicability to real environments. Since it may be a burden to the user to attach the acceleration on the back, we should verify the possibility to use the acceleration sensor in the smartphone. In addition, it is necessary to consider services according to the degree of specific attention distraction.
References
| [1] | Honda: Safety Map, https://safetymap.jp/ [retrieved: January, 2017] (in Japanese). |
| [2] | Waze Mobile: Waze: Free Community-based Mapping, Traffic & Navigation App, 2017, https://www.waze.com/ [retrieved: January, 2017]. |
| [3] | Hamaoka, H., et al.: A study on the behavior of pedestrians when confirming approach of right/left-turning vehicle while crossing a crosswalk, Intelligent Vehicles Symposium (IV), 2013 IEEE, 2013, pp. 106-110. |
| [4] | Music, J., et al.: Is it possible to detect mobile phone user's attention based on accelerometer measurement of gait pattern?, IEEE Symposium on Computers and Communications (ISCC), 2013, pp. 522-527. |
| [5] | Gallahan, S., et al.: Detecting and mitigating driver distraction with motion capture technology: Distracted driving warning system, IEEE Systems and Information Engineering Design Symposium (SIEDS), 2013, pp. 76-81. |
| [6] | Mizoguchi, F., et al: A new approach to detecting distracted car drivers using eye-movement data, IEEE International Conference on Cognitive Informatics & Cognitive Computing (ICCI*CC), 2014, pp. 266-272. |
| [7] | Zaki, M., et al: Exploring walking gait features for the automated recognition of distracted pedestrians, IET Intelligent Transport Systems, Vol. 10, No. 2, 2016, pp. 106-113. |
| [8] | Killane, I., et al: Measurement of attention during movement: Acquisition of ambulatory EEG and cognitive performance from healthy young adults, Annual International Conference of the IEEE Engineering in Medicine and Biology Society (EMBC), 2013, pp. 6397-6400. |
| [9] | Woollacott, M., et al.: Attention and the control of posture and gait: a review of an emerging area of research, Gait & Posture, Volume 16, Issue 1, 2002, pp. 1-14. |
| [10] | Uemura, Y., et al.: Estimating Distracted Pedestrian from Deviated Walking Considering Consumption of Working Memory, International Conference on Computational Science and Computational Intelligence, 2016 (to issue). |
| [11] | Kurihara, Y., et al.: Estimation of Walking Exercise Intensity Using 3-D Acceleration Sensor, IEEE Transactions on SMC, 2012, pp. 495-500. |
| [12] | Gafurov, D., et al.: Biometric Gait Authentication Using Accelerometer Sensor, Journal of Computers, 2006, pp. 51-59. |
| [13] | Perry, J. et al.: Gait Analysis: Normal and Pathological Function, Chapter 20, Slack Inc., 2010. |
| [14] | Alan Baddeley: Working Memory: Theories, Models, and Controversies, Annu. Rev. Psycol., 2012, pp. 1-29. |
| [15] | Konstantinou, N., et al.: Working memory load and distraction: dissociable effects of visual maintenance and cognitive control, Attention, Perception, & Psychophysics, Volume 76, Issue 7, 2014, pp 1985–1997. |
| [16] | Liu, Y., et al.: How Does Distraction Task Influence the Interaction of Working Memory and Long-Term Memory?, International Conference on Engineering Psychology and Cognitive Ergonomics, 2007, pp. 366-374. |
| [17] | Vasan, K., et al.: Dimensionality reduction using Principal Component Analysis for network intrusion detection, Perspectives in Science, Vol. 8, 2016, pp. 510-512. |
| [18] | Lyu, Y., et al.: Measuring Photoplethysmogram-Based Stress-Induced Vascular Response Index to Assess Cognitive Load and Stress, CHI '15 Proceedings of the 33rd Annual ACM Conference on Human Factors in Computing Systems, pp. 857-866, 2015. |
| [19] | Lundin-Olsson, L., et al.: “Stops walking when talking” as a predictor of falls in elderly people, THE LANCET, Volume 349, Issue 9052, 1997, p. 617. |


 as a grasped acceleration,
  as a grasped angular velocity (Equation 1, 2). Each components of the feature component represents acceleration/angular velocity of the x-axis, y-axis, and z-axis, respectively.

 and
and  represent the norm of 3-D acceleration and 3-D angular velocity, respectively (Equation 3, 4).


 Where Nr and D represent the number of responses and the estimated distraction degree, respectively.We set the estimation error when the cumulative contribution rate is 80% and 90% in the principal component analysis to
  and
and  , respectively.
  is calculated with 14 dimensional principal components, and
  is calculated with 31 dimensional principal components. In addition, let
  be the estimation error in the case the principal component analysis is not applied.
  is calculated with 1968 dimensional principal component. The estimation error for each subject is show in Table 1.
  represents each subject, where the gray line shows female subjects. The item, BC, in the table, represents Best Classifier. The last item, Diff, in the table head is the difference between the maximum value and the minimum value of the estimation error in the same subject.
 . Table 2 shows the average value of the estimation error between the male subjects and the female subjects.
 and
and  as representatives of 3D acceleration and 3D angular velocity, respectively. The distraction degree is divided into three levels;
 ,
,  ,
,  . The values in each level are shown in Table 4.
 mainly represents the movement in the direction of walking,
  includes the movement of some body parts. The table has revealed the following features.Ÿ When the distraction degree is high, the acceleration is moderate, but the angular velocity becomes increased. That is, the body is deviated. It implies that the subject needs to recall something with great efforts, which changes the movement of some body parts in walking motion.Ÿ When the pedestrian walks with middle level of distraction, the acceleration and the angular velocity are both moderate. Therefore, it is comparatively stable walking compared to the case of High and Low. It implies that, when the environment provides fair prospects, the subject only concentrates on the recalling tasks, switching off the CE.Ÿ When the degree of distraction is low, the acceleration and the angular velocity gets higher. In other words, the gait becomes faster and the body gets deviated. It implies the subject increases walking speed because the task is simple. It affects him/her sot that their body movement gets deviated.Since the above features can be acquired with the acceleration sensor, we can conclude the method can estimate distraction degree. Even in the case of the principal component analysis is applied, it is assumed that the features of these frequency bands remain as components of a high contribution ratio. It explains similar features can be seen in
  and
and  .
. Abstract
 Reference
 Full-Text PDF
 Full-text HTML


