-
Paper Information
- Paper Submission
-
Journal Information
- About This Journal
- Editorial Board
- Current Issue
- Archive
- Author Guidelines
- Contact Us
International Journal of Information Science
p-ISSN: 2163-1921 e-ISSN: 2163-193X
2017; 7(1): 12-15
doi:10.5923/j.ijis.20170701.02

A Decision Support System to Cluster a Priority Development Sub Town in Education Field with K-Means Clustering Algorithm (Case Study Center Java Province of Indonesia)
 Abstract
 Reference
 Full-Text PDF
 Full-text HTML
Nursikuwagus Agus, Hartono Tono
Information System, Faculty of Technic and Computer Science, Indonesia Computer University, Indonesia
Correspondence to: Hartono Tono, Information System, Faculty of Technic and Computer Science, Indonesia Computer University, Indonesia.
| Email: |  |
Copyright © 2017 Scientific & Academic Publishing. All Rights Reserved.
This work is licensed under the Creative Commons Attribution International License (CC BY).
http://creativecommons.org/licenses/by/4.0/

Education is one field in many countries that has been supporting to help the people growth. In the knowledge manner, education is importance activity to endorse and increase the people in economic and development culture. In the sub town, the problem of government policies is choosing a priority where the sub town that has a high priority and essential to realize their development in education. The purpose of the research is applying K-Means Clustering algorithm and cluster the education data, such as population, class room, and teacher. This process has been useful to cluster the data in education field. The high priority in the system, it can be supported by government firstly. In clustering process, we have been using 35 data that has been distributed in central java. The algorithm that has processing conducted by cluster technic that includes three terms such as weak frequency (cluster 1), middle frequency (cluster 2), and tight frequency (cluster 3). So, we have been setting for K-Means value is three clusters. The conclusion of the research is the sub town that has a high priority would be endorsed in education development firstly is around Magelang with 11 districts.
Keywords: K-Means, Decision Support, Clustering, Education, Development
Cite this paper: Nursikuwagus Agus, Hartono Tono, A Decision Support System to Cluster a Priority Development Sub Town in Education Field with K-Means Clustering Algorithm (Case Study Center Java Province of Indonesia), International Journal of Information Science, Vol. 7 No. 1, 2017, pp. 12-15. doi: 10.5923/j.ijis.20170701.02.
Article Outline
1. Introduction
- Clustering is an unsupervised technique based analysis and data mining techniques. Many studies were using this technique, to solve the problems in obtaining the desired results. (Fahmida Afrin, 2015). Past research on K-Means algorithm has been made to the customer segmentation (Fahmida Afrin, 2015). Meanwhile (Archana Singh, 2013) using the K-Means technique to divide the data into K clusters, calculation of the distance between a predetermined point become a factor in cluster point has been obtained. (Farhad Soleimanian Gharehchopogh, 2012) using the K-Means to determine infiltration activities in a computer network. (Rajagopal, 2011) was using the K-Means to cluster customers with high-profit categories on, high value and low risk to the customer. (Soumi Ghosh, 2013) using the K-Means to determine clusters of business transactions conducted by the company.Development education is one of the main priorities in the national development agenda and was instrumental in achieving progress in many areas of life such as social, economic, political and cultural. Education is one of the strategic areas that need serious attention as a means to enhance human intelligence and skill.The purpose of this study is to implement the K-Means algorithm to a decision that involves the total population, the number of classrooms, and the number of teachers in a region in prioritization of assistance in the field of education. As a limitation, in the boundary of the problem is the data from the local government that includes cities/regencies in Central Java. In addition, the test parameters or variables that have been used are the population of the region, the number of classrooms and teachers. The amount of data used is as many as 35 districts / cities. The expected outputs of this research are clustered several districts /cities in Central Java were considered by the government which must first be assisted in improving education.
2. Literature Review
- K-Means AlgorithmK-Means or Hard C-Means clustering is basically a partitioning method applied to analyze data and treats observations of the data as objects based on locations and distance between various input data points (Soumi Ghosh, 2013). Partitioning the objects into mutually exclusive clusters (K) is done by it in such a fashion that objects within each cluster remain as close possible to each other but as far as possible from objects in other clusters. (Soumi Ghosh, 2013). Each cluster is characterized by its centre point i.e. centroid. The distances used in clustering in most of the times do not actually represent the spatial istances. In general, the only solution to the problem of finding global minimum is exhaustive choice of starting points. But use of several replicates with random starting point leads to a solution i.e. a global solution (Soumi Ghosh, 2013). In a dataset, a desired number of clusters K and a set of k initial starting points, the K-Means clustering algorithm finds the desired number of distinct clusters and their centroids. A centroid is the point whose coordination. The algorithm have been pursued by (Archana Singh, 2013), it can be seen at the below.Algoritma K-Means Euclidian Distance (Archana Singh, 2013):Let X = {x1,x2,x3,……..,xn} be the set of data points and V = {v1,v2,…….,vc} be the set of centers.1. Select ‘c’cluster centers randomly.2. Calculate the distance between each data point and cluster centers using the Euclidean distance metric as follows:
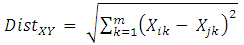 | (1) |
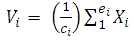 | (2) |
3. Research Model
- In (Fahmida Afrin, 2015), they have succeed implement the K-Means algorithm for clustering the customer segmentation. Another research which has succeeded too for implementation of K-Means is (Budiarti, 2006) (Navjot Kaur, 2012) (Rajagopal, 2011) (Farhad Soleimanian Gharehchopogh, 2012). In (Budiarti, 2006), she was succeeding in clustering method for prediction of student graduate. In (Navjot Kaur, 2012), he was explained about meaningful of K-Means algorithm for ranking method. (Farhad Soleimanian Gharehchopogh, 2012), clustering about intrusion in network computer system from unknown intruder. In association with research before, it is possible to implement about decision system using K-Means algorithm. We are proposed for this research model, that the population, classroom needs, and teacher needs can be parameterized model to justify the cluster, especially in development of education in Central Java. We can been seen at the figure 1, we can be shown the correlation between parameters in X,Y,Z graphics.
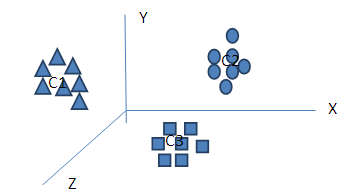 | Figure 1. The Clustering Model for population (C1), classroom (C2), and teacher needs (C3) |
4. Data Analysis
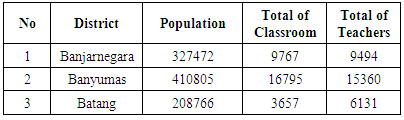
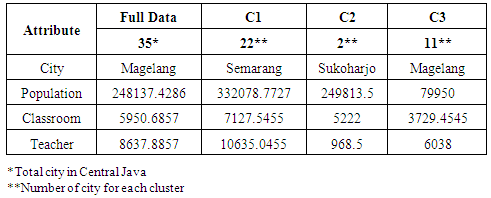
- The process for clustering has been collected from the district government data. There are 35 districts with various parameters that consisted of population, classroom, and teacher amount. Every parameter or variable is defined as numeric value. The K-Means algorithm, have a criteria for the process such as centroid value. In that algorithm, we have been conducting the process as a sequential process for every stage. At the table 1, is shown about distribution value for every variable.
|
|
5. Discussion
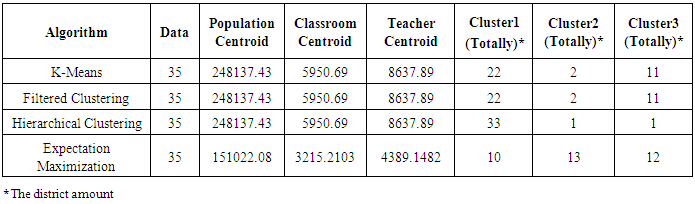
- On the process that has been executed and model proposed, it can be stated that the model clustering can be constructed in the cases above. Population, classroom, and teacher amount can aid to determine the priority support in education field. The table 3, comparison with other cluster model. We have found that the clustering algorithm give the same result with two cluster that has predefined, especially for hierarchical clustering algorithm.
|
6. Conclusions
- In research process above, we can be told that the K-Means algorithm has supporting by clustering the data. The parameters, which have defined, were giving the significant value for clustering, such as population, classroom, and teacher. At the end, we can be concluded that 11 districts which have a high priority to support in education field, and clustered around in Magelang. The 22 districts have clustered around Semarang in low priority and 2 districts in medium priority around in Sukoharjo.