-
Paper Information
- Next Paper
- Previous Paper
- Paper Submission
-
Journal Information
- About This Journal
- Editorial Board
- Current Issue
- Archive
- Author Guidelines
- Contact Us
International Journal of Information Science
p-ISSN: 2163-1921 e-ISSN: 2163-193X
2013; 3(3): 57-62
doi:10.5923/j.ijis.20130303.02
Usability Assessment of Web Interfaces User Testing
 Abstract
 Reference
 Full-Text PDF
 Full-text HTML
Ana Paula Afonso1, Jorge Reis Lima2, Manuel Pérez Cota3
1Informática, Polytechnic of Porto, Porto, Portugal
2Informática, Universidade do Porto, Porto, Portugal
3Informática, Universidade de Vigo, Vigo, Espanha
Correspondence to: Ana Paula Afonso, Informática, Polytechnic of Porto, Porto, Portugal.
| Email: |  |
Copyright © 2012 Scientific & Academic Publishing. All Rights Reserved.
The assessment of the Web usability aims to identify specific problems on the interface. It is a process which uses several techniques and methods. One of those techniques, theuser testing, is here exposed throughaexecution of a set of tasks that intend to observe and measure the user’s interactionwith the interface. In the case presented the research issue was developing a plan of a user testing which permits to get insights about the easiness of a set of real user’s interaction with the website of a secretariat of a school of higher education. This was built based on a sequence of interviews with real and representative users of the community which uses the Website regularly, some of them daily. From the interviews came the definition of several user profiles. The three most relevant profiles (professor, staff and student) were posteriorly selected to participate on the test, in order to perform a set of ten tasks. In order to obtain quantitative information, times of execution were measured as well as the errors committed, tips from the moderator and the completion of the tasks were also registered. Additionally, three open questions were included which, along the comments made by the participants during the test permitted to obtain subjective information as it is, for example, the user’s satisfaction. The outcomesindicated that the Website’s usability is quite reasonable. We can conclude that in general, the most part of the users execute their tasks quite easily, faster and with satisfaction.
Keywords: Interfaces, Dynamic Websites, Usability, Human-Computer Interaction, Usability Assessment Techniques, User Test
Cite this paper: Ana Paula Afonso, Jorge Reis Lima, Manuel Pérez Cota, Usability Assessment of Web Interfaces User Testing, International Journal of Information Science, Vol. 3 No. 3, 2013, pp. 57-62. doi: 10.5923/j.ijis.20130303.02.
Article Outline
1. Introduction
- The usability’s evaluation of the Websites’ interfaces aims to detect problems with the interface and, if possible, to suggest alternatives that would enhance the performance and assure that a Website’s interface meets the users’ expectations, particularly in terms of ease of navigation and quicker access to content.This study was conducted at the School of Accountancy and Administration of Porto, ISCAP1, where the majority of the necessary teaching and administrative duties are executed at distance, that is, through a virtual secretariat. The Website can be visited by anybody as a guest.The interest and importance of the study are directly related to the satisfaction of the users of the Website.The response times are one of the biggest obstacles to the success of a Website (Nielsen, 2010). Google has recently released a free application named Google PageSpeed2 which turns possible the analysis of the performance of the access to the Web pages of any Website. Accordingly with Nielsen, J. (2010, 2012) there are three limits to the response time:● 0.1second gives the feeling of instantaneous response —that is, the outcome feels like it was caused by the user, not the computer. This level of responsiveness is essential to support the feeling of direct manipulation ● 1 second keeps the user's flow of thought seamless. Users can sense a delay, and thus know the computer is generating the outcome, but they still feel in control of the overall experience and that they're moving freely rather than waiting on the computer. This degree of responsiveness is needed for good navigation. ● 10 seconds keeps the user's attention. From 1–10 seconds, users definitely feel at the mercy of the computer and wish it was faster, but they can handle it. After 10 seconds, they start thinking about other things, making it harder to get their brains back on track once the computer finally does respond. A 10-second delay will often make users leave a site immediately. And even if they stay, it's harder for them to understand what's going on, making it less likely that they'll succeed in any difficult tasks.The use and importance of a virtual office does not allow long response times. Many of the school bureaucratic and administrative tasks are performed through the Website. For example, class contents, the release of grades and absences, the assignment of the responsible for curricular units, inscriptions in exams, queries, among many others, are accomplished at the virtual secretariat in real time. It would be unsustainable in the daily functioning that these operations took too long. To give an idea of the number of the accesses, during the last month of December 2012, seasonally the least used, the number of visits was about 20,0003.
2. Literature Review
- A computer system’s interface must primarily facilitate the interaction with the user, making it natural and intuitive. HCI has become an interdisciplinary focus of a challenging test in the application and development of psychology and the social sciences in the context of technology development and use.Usability is a central term in HCI and various interpretations have been developed to explain its meaning: from “the capability of a system to be used by humans easily and effectively” (Shackel, B., & Richardson, S. J., 1991) to the definition of standards ISO 9241-11:1999, depicting the extent to which a computer system can be used by users in order to achieve specific goals effectively and efficiently and satisfaction in a given context (1998). This is the key question in HCI: improve the usability of interactive systems for them to be effective, efficient and easy to use. The investigations in this context originated a set of guidelines to improve the usability of the systems (Smith, S., & Mosier, J., 1986), methods to predict problems of usability (Madan, A. et al., 2012), techniques to test the usability of systems (Lewis, J., 2006) and led to several discussions concerning the measure or assessment of the usability (Nielsen, J. & Levy, J., 1994), (ISO, 1998), (Frøkjær et al., 2000), (Wilson, C., 2007), Hornbaek, K., 2006).A major challenge in the development of computer systems to be usable by people is how to make the transition between what can be done—functionality— and how it should be done—usability— with the objective of satisfying the user’s necessities. The assessment of an interface’s usability is a process that looks linear and simple, comprising a set of steps leading to more usable interactive systems. However, problems arises in selecting the most appropriate method, that is, the method which turns out to be most effective in the diagnosis of usability issues on a concrete interface.In general, the UA methods are classified into three major groups: inspection methods (involves usability professionals), user Testing (involves usability professionals and users) and methods based on software (Hasan, L., Abuelrub, E. (2013).In this paper we are going to explore the second group: The user Testing applied to a case-study of a school virtual secretariat.
3. Research Methodology
- The research methodology used in this study, to assess a Website’s usability through the user Test was initiated by a set of interviews to real users and Website representatives.
3.1. Interviews
- The interviews were a preliminary approach to the Website’s users, contributing to the definition and selection of the Website’s users profiles, a list of tasks and three open-ended questions.The profiles defined were teacher, staff, student, visitor, roaming and external entity. Bearing in mind that the user profiles visitor, roaming and external entityuse the website rarely, the profiles considered relevant on this studytoobtain important insights about the website were teacher, staff and student. From now on we only refer those three profiles.Accordingly with the exposed in Nielsen’s alertboxes (2012, 2012b) and a study of Sauro (2010), the tasks were selected based on the interviews performed to the selected profiles and in the type of user (frequent or casual) and are representative of the tasks that each user executes regularly. Some tasks deemed critical, especially associated with search of information were also chosen, in order to observe the degree of facility the user’s performance, leading to conclusions about the usabilityof the “search” function.The duration of the task’s completion,Sauro (2010) must be within thirty seconds and seven minutes. The number of selected tasks should be calculated based on the duration of the usability test. It should not be longer than 90 minutes (Nielsen, 2005) to avoid performance degradation due to fatigue of the participants. We have decided to develop a short test, not more than an hour of length. How was the length of the test estimated? From a set of tasks that each user profile performs often, the author executed each one, registering and summing the time consumed, till the total duration was approximately an hour.After that he chooses the tasks that compose the whole test.On the end there’s an idea, much close to real, of how much time an expert would spend performing the entire test that can be used as a benchmark in future work. In this study and based on the above, ten taskswere selected for each user profile. In fact, threewere common to allprofiles, in order to be able to compare all of them statistically. The remaining seven specifics tasks to each user profile, allowed comparisons statistical between profiles.
3.2. User Testing
- The user Test’s main objective is to observe the interaction of users with the interface being tested Hasan, L., Abuelrub, E. (2013). The test was conducted individually, on a private room equipped with a computer, and lasted an average of thirty minutes.
3.2.1. Selection of the Usability Test Participants
- The methodology of investigation used included a selection of a representative group for each of the most frequent user profiles participating on the study: teacher, staff and student.The number of users that Nielsen (2010) found on his alertbox, “why you only need to test with 5 users”, as being satisfactory to identify 85% of the usability problems was five. However, existing highly differentiated user profiles, the number should lie between three or four per profile. “You need to test additional users when a Website has several highly distinct groups of users. The formula only holds for comparable users who will be using the site in fairly similar ways. (…) 3-4 users from each category if testing two groups of users or 3 users from each category, if testing three or more groups of users (you always want at least 3 users to ensure that you have covered the diversity of behavior within the group)” (Nielsen, 2010).
3.2.2. Task Execution
- In the user Testing, the participants were asked to complete a set of ten tasks previously selected ― the most frequently used by each type of user ― following the respective profile. Three of the tasks were common to all users being all the remaining seven distinct. The evaluator measured the tasks’ runtime, the errors committed and the completion or not of the task.
3.2.3. Registration of the Participants’ Comments
- Throughout the execution of the test it was used the “Think Aloud” protocol, each participant told what he thought as he performed the task. These comments were recorded and later related to information obtained in the previous section.
4. User Testing Scheme
- In this case-study, the virtual secretariat of a higher education school, the several stages of the application of the user Testingcan be observedin the diagram depicted in figure 1.
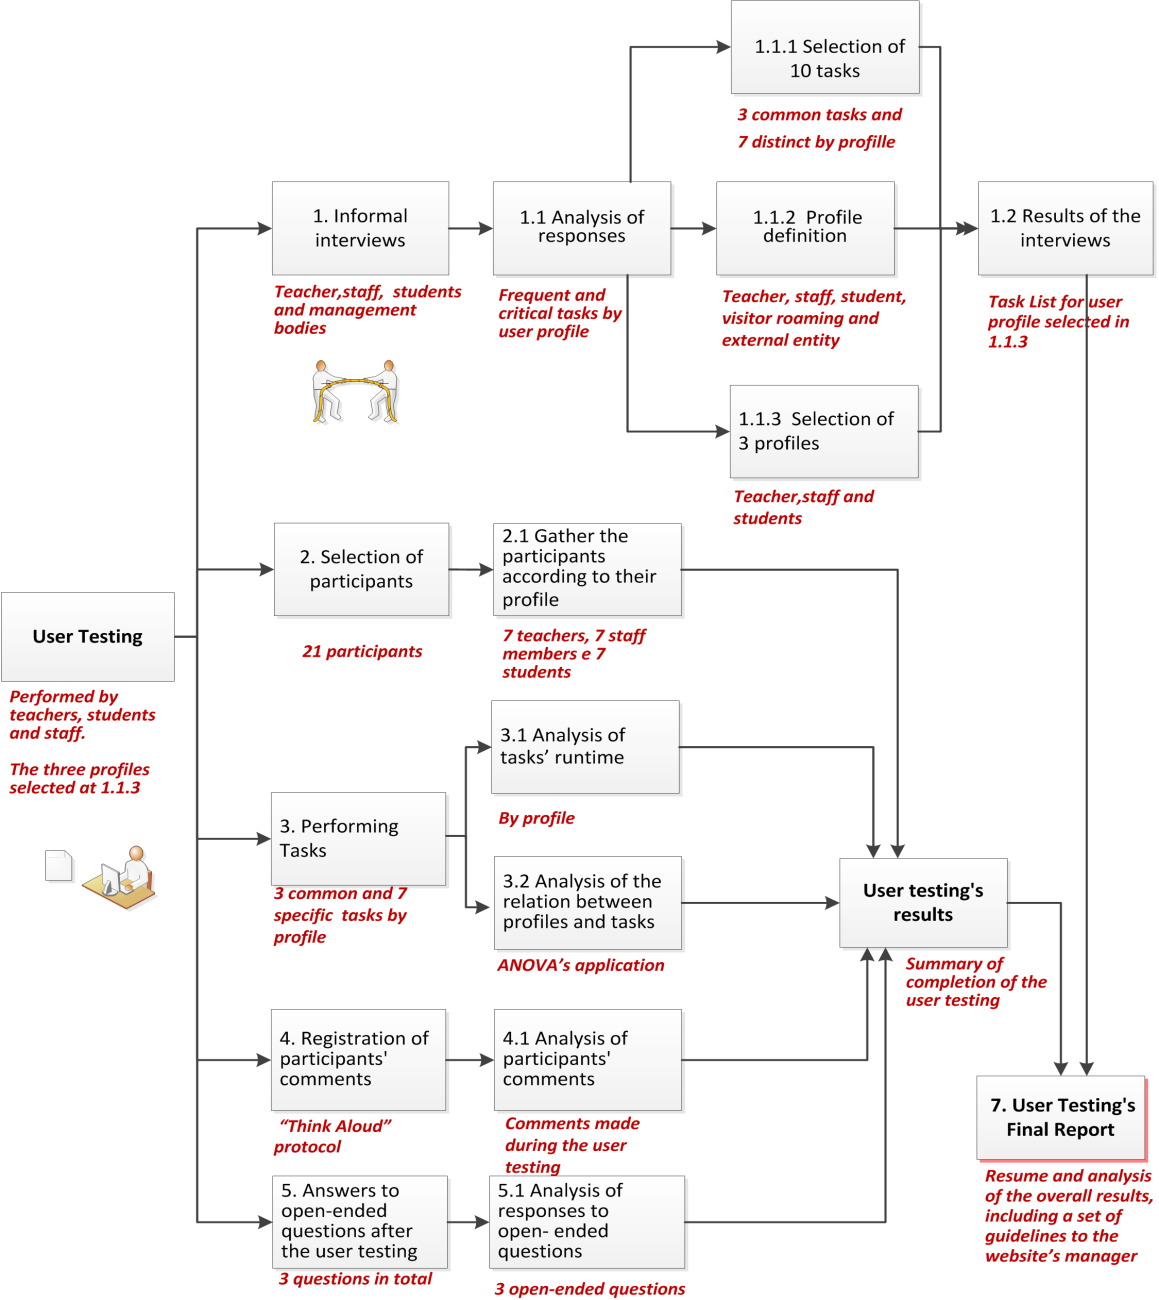 | Figure 1. Scheme of the application of user Testing |
5. Results of the Study
- The user Testing was applied in this case-study of the virtual school secretariat and the results obtained with the methodology described in the previous section 3, are presented next.
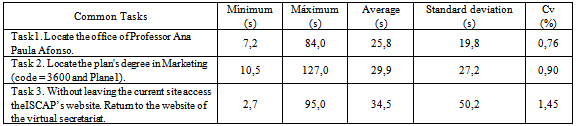
5.1. Quantitative Assessment Results
- To make an analysis of the results each participant was asked to complete a set of ten tasks being three of those tasks common to all profiles.The average time, measured in seconds, that the twenty one participants took to complete the three common tasks can be consulted on the table 1, fourth column.
|
5.2. Qualitative Assessment Results
- The qualitative data obtained in the User Testing are mainly obtained from the user’s comments during the execution of each task and the answers given on the open-ended questions after the execution of the list of tasks.The three open-ended questions here considered (see table 3) are related to the following aspects: the tasks executed, informationaccessand the interface.
|
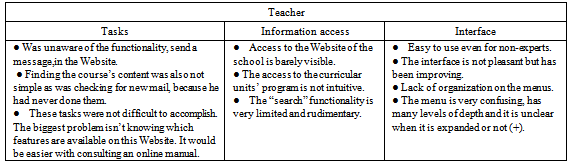
5.1.1. Qualitative Assessment of the Teacher Profile
- The analysis of the responses (see Table 3) shows that in general, teachers had no difficulty in performing the tasks they hadpreviously done. Some were unaware of the existence of certain features which led to higher runtimes or even to non-completion of tasks. The access to information is not entirely satisfactory, particularly using the search functionality. The interface showed no major problems although they would prefer to use menus with fewer levels of depth.
|
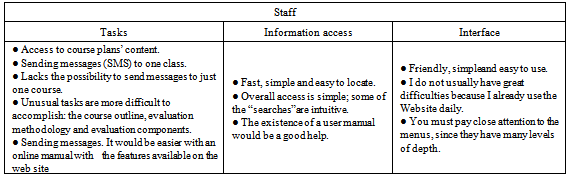
5.1.2. Qualitative Assessment of the Staff Profile
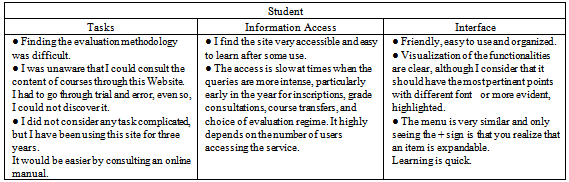
5.1.3. Qualitative Assessment of Student Profile
- By analyzing the answers given (see Table 5) it was verified that more experienced students, i.e., the oldest students had no difficulty in performing the tasks (some students were enrolled on the first year and some on the second year). The less experienced students, beginning their first year, were unaware of some of the features and took longer to find the requested information.The students also considered that the access is seasonally slow, particularly at the beginning of the school year or at the time of intense grades consultation.They considered the interface simple, quick to learn, but suggested a menu with the main options highlighted from the secondary options.
|
6. General Results of the User Testing
- User Testing led to conclusions about the ease with which the Website can be used and determine the main difficulties encountered by the user, diagnosing usability problems. Studying three different types of user —teacher, staff and student —allowed comparing results obtained in performing common tasks and obtainingresults by individual profile.
7. Conclusions and Future Work
- The research presented in the previous sections corresponds to an application of User Testing, resulting in a report with the detected problems and suggestions to minimize or eliminate these issues.Generally, it is possible to conclude that the use of human-computer interaction techniques on the assessment of the functionality and usability of the Website was essential to present suggestions that conducted to a better usability, efficiency and enhance the degree of satisfaction to most users (teachers, staff, students and possibly even the less relevant profiles as guests, roaming and external entity). Several possible developments as well as clarification of the method’s limits and expansions are being considered, in particular, repeating the user Testing after the application of the suggestions made in the final report presented to the Website’s manager.The divulgation of the study about the usability of a complex Website with a large number of users, here described and analyzed, namely exposing factors that contribute to a greater or lesser user satisfaction allows us to easily extrapolated or evaluate similar situations.
Notes
- 1. Available at http://www.iscap.ipp.pt.2. Fromhttps://developers.google.com/speed/pagespeed/insights3. From http://stats.iscaippt/awstats/awstats.pl?config=secretaria.iscaippt
References
| [1] | Frøkjær et al., (2000) Measuring Usability: Are Effectiveness, Efficiency, and Satisfaction Really Correlated? CHI Letters, 2, 1, 345-352. |
| [2] | Hasan, L., Abuelrub, E. (2013). Usability Testing for IAJIT OpenConf Journal. Journal of Software, vol. 8, no. 2, February 2013. ACADEMYPUBLISHER.doi:10.4304/jsw.8.2.387-396. |
| [3] | Hornbaek, K. (2006). Current Practise In Measuring Usability: Challenges to Usability Studies and Research. International Journal of Human Computer Studies, pp 79-102. |
| [4] | ISO 9241-11. Ergonomic requirements for office work with visual display terminals (VDTs) G. on usability (1998). |
| [5] | ISO (1998). International Standards. Obtained on 5 of February of 2011 and available athttp://www.usabilitynet.org/tools/r_international.htm. |
| [6] | Lewis, J. (2006). Usability Testing. IBM Software Group. Obtained on 15 of April of 20102 and available at http://drjim.0catch.com/usabilitytesting-ral.pdf. |
| [7] | Madan, A. et al. (2012). Usability evaluation methods: a literature review. International Journal of Engineering Science and Technology (IJEST).ISSN: 0975-5462. Vol. 4 No.02 February 2012 592. Obtained on 10 of March of 2012 and available atwww.ijest.info/docs/IJEST12-04-02-143.pdf. |
| [8] | Nielsen, J. & Levy, J. (1994). Measuring usability: Preference vs. Performance. Communications of the ACM, 37, 66-75 |
| [9] | Nielsen, J. (2005). Time Budgets for Usability Sessions (Jakob Nielsen’s Alertbox, September 12, 2005). Consultado em Janeiro deJunho de 2013 e disponível em http://www.nngroup.com/articles/time-budgets-for-usability-sessions/ |
| [10] | Nielsen, J. (2010). Website Response Times (Jakob Nielsen’s Alertbox).Obtained on 28 of October of 2010 and available at http://www.nngroup.com/articles/Website-response-times/. |
| [11] | Nielsen, J. (2012). How Long Do Users Stay on Web Pages? (Jakob Nielsen’s Alertbox). Obtained at 8 of February of 2012 and available athttp://www.useit.com/alertbox/page-abandonment-time.html. |
| [12] | Nielsen, J. (2012). Why You Only Need to Test with 5 Users. (Jakob Nielsen’s Alertbox, March 19). Obtained on 23 of December of 2010 and available athttp://www.useit.com/alertbox/20000319.html. |
| [13] | Nielsen, J. (2012b). How Many Test Users in a Usability Study? (Jakob Nielsen’s Alertbox, June 4). Obtained on 5 of June of 2012 and available athttp://www.useit.com/alertbox/number-of-test-users.html |
| [14] | Sauro, J. (2010). How to conduct a quantitative Usability test. 72 questions and answers for measuring Usability. A Measuring Usability LLC Premium Report. Obtained on 20 of January of 2010 and available athttp://www.MeasuringUsability.com. |
| [15] | Shackel, B., & Richardson, J. (1991). Human Factors for Informatics Usability. Cambridge University Press |
| [16] | Smith, S., & Mosier, J. (1986). Guidelines For Designing User Interface Software. Obtained at 12 of March of 2012 and available athttp://dfki.de/~jameson/hcid/papers/smith-mosier.pdf. |
| [17] | Wilson, C. (2007). Taking Usability Practitioners to Task. Interactions Vol. 14, pp.48-49. 2007. |