-
Paper Information
- Paper Submission
-
Journal Information
- About This Journal
- Editorial Board
- Current Issue
- Archive
- Author Guidelines
- Contact Us
International Journal of Information Science
p-ISSN: 2163-1921 e-ISSN: 2163-193X
2013; 3(2): 25-36
doi:10.5923/j.ijis.20130302.01
An Imperialist Competitive Algorithm for 1-D Cutting Stock Problem
 Abstract
 Reference
 Full-Text PDF
 Full-text HTML
Shirin Nozarian, Majid Vafaei Jahan, Mehrdad Jalali
Computer Engineering Department, Islamic Azad University of Mashhad, Mashhad Branch
Correspondence to: Majid Vafaei Jahan, Computer Engineering Department, Islamic Azad University of Mashhad, Mashhad Branch.
| Email: |  |
Copyright © 2012 Scientific & Academic Publishing. All Rights Reserved.
Minimizing trim-loss is an important matter in many industries such as steel and paper. Sometimes making small changes in cutting pattern can createconsiderable benefits in different areas such as production costs. In recent studies this matter has been looked into from a different point of view. Inour approach trim-loss concentration has been introduced as a solution to trim-loss problem based on simulated annealing (SA) algorithms using a new kind ofvirtual cost. Trim-loss concentration problem and credibility of the virtual cost theory has been studied in this paper, as well as reviewing literature onresolving cutting-stock problem. Furthermore, a solution based on Imperialist Competitive Algorithm (ICA) has been presented that reduces the wastage as well asconcentrating them on the minimum number of stocks. The benchmark data has been randomly generated using CUTGEN 1 application.In most of the experimental results, ICA proved to produce more accurate results compared to other algorithms.
Keywords: Optimization, Cutting Problem, One Dimensional Cutting Stock, Cutting Stock Concentration, Imperialist Competitive Algorithm
Cite this paper: Shirin Nozarian, Majid Vafaei Jahan, Mehrdad Jalali, An Imperialist Competitive Algorithm for 1-D Cutting Stock Problem, International Journal of Information Science, Vol. 3 No. 2, 2013, pp. 25-36. doi: 10.5923/j.ijis.20130302.01.
Article Outline
1. Introduction
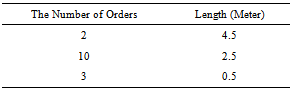
- The Cutting Stock Problem (CSP) is used in many industries, such as steel, paper, plastic, glass and wood[1-3].In one dimensional cutting Stock problems, a part or some parts of the material (stock) might not be reused, when a piece is cut out of a bigger part. It happens due to applying various patterns freely. Recently, cutting problem has attracted the attention of many researchers all over the world[4-7]. Choosing a cutting pattern and its consequences is put forward by cutting problems. Sometimes cutting problems are too complicated, and it is not easy to find an optimized response for them. In such a case, even the smallest improvement in cutting pattern, may lead to a considerable economizing in raw material, which are used over and over in mass quantity.Most standard problems that are related to one dimensional cutting problem are known as NP-complete problems. However it is possible in many cases to model them by mathematical programming and find a solution via accurate or approximate methods. The goal of this research is applying an algorithm that is ordered for cutting problems in order to change them into other ordered pieces, in a way that having the minimum wastage.On the basis of H. Dyckoff’s typology, the one dimensional problem can be explained as 1/V/D/R whenever sufficient materials are available. "1" stands for one dimensionality of the problem. "V" means that all required items should beproduced by a selection of big consuming pieces; in other words, although some parts of stocks (big pieces) are only used, all orders will be produced. "D" means that there are several big consuming pieces in different sizes. And "R" represents the number of items, considering the limited variety.Dyckoff classifies the solution of the one dimensional problems into two classes: Item-Oriented and Pattern-Oriented methods. In item-oriented method, every ordered piece (item) is cut out of the big piece independently. Then another cutting will be executed on the rest of the big piece. It continues up to a point, in which no cutting is possible anymore. After that the next big piece will be prepared for cutting. In pattern-oriented method, firstly the length of ordered stocks is combined in cutting pattern. The number of cuts is determined on the basis of predetermined cutting pattern for affording the order in order to find the answer. Existing limitations in this method are prepared according to an algorithm by P. C. Gilmore and R. E. Gomory[12 - 15]. The item-oriented method is applied to solve the understudy problem, because the pattern-oriented method is applicable in a condition that all items have the same length or several standard lengths, and the item-oriented method is applied whenever the length of items are different.The first related formula to CSP was suggested by Kantorovich in 1939. It was published in English language in 1960[15], although several studies and researches had practically been conducted about 45 years before this event and different solutions are suggested for solving CSP problem up to now. However various innovative solutions are suggested in real world in order to solve the CSP problems, applying them is not helpful in similar problems due to the special characteristics of such problems [16].Minimizing the cutting wastage can be considered as the main purpose of CSP, some other goals can be defined for it though. 15 effective factors on being profitable were listed by Stainton in 1977. This list contains some factors that cannot be measured easily (e.g. the staff spirit and viewpoint, or obtained profit by computerized analyses)[17]. Practically, the cost of using a special cutting model and changing the cutting patterns are important ordinary factors as well as cutting wastage.In 2007, Fusson et al. modeled the cutting problem in a way that a deadline had to be determined for each small piece; according to them, each item deadline and the whole order deadline had to be considered [18].The peripheral aspects (e.g. the required energy) can be considered by an appropriate formulation and making the smallest improvement in cutting pattern[19]. It leads to a big thriftiness in stocks, which are consumed quickly and repeatedly in huge mass. Fruitlessness and costliness of manual methods, which are applied by cutting contractors, reminds the necessity of cutting automation[20, 9]. Furthermore, the potential of suggested methods can be distinguished easily, due to the impossibility of comparing the different solutions together over and over[11]. There are several algorithms and methods to calculate the one dimensional cutting wastages, considering various factors. It is suggested that minimizing the wastage is the most important factor in different methods.Principally there are three different classes for solving the CSP: 1- Algorithmic methods, 2- Innovative methods, 3- Metahuristic methods.Algorithmic methods guarantee an optimal response, despite of calculating complications. But they are time consuming, especially in big problems. That is why the complete algorithmic methods were rarely used in the past.Innovative methods get to the answer quickly, but not an optimum answer necessarily. Obtained responses via the innovative methods can be considered as ideal ones, as long as they are close to the optimum answers. Innovative methods usually are designed for special problems. Mentioned method depends on special conditions drastically, so it is not applied as a general method[16].The solution process in metahuristic methods usually is guided in lower levels, and contrary to traditional metahuristic methods, they are not limited to local optimum conditions. Some articles like[21-23] can be considered as appropriate samples for solving the optimizing problems via metahuristic methods.The amount of wastage dispersion, which is a qualitative parameter, is explained quantitatively in the second part of this article by discussing some criteria for measuring the one dimensional cutting wastage. In the third part, a related model will be explained and the optimizing parameter will be discussed. A method based on ICA will be offered in the fourth part in order to reduce the wastage in the cutting stock problem. In the fifth part, the problem will be discussed and solved in a bigger view. And results and consequences are offered in the sixth part.
2. The Criteria to Measure the Wastage Dispersion
- In research model, the target functions are posed either as minimizing the pattern numbers or minimizing the raw subgroups in one dimensional cutting problem. But both of these functions are following the same goal at the final step, i.e. minimizing the cutting wastage amount. On the other hand, two goals are following in cutting wastage concentration problem simultaneously. The first goal is reducing the cutting wastage, exactly the same as cutting problem, and the second one is concentrating the cutting wastage on the minimized consumed stocks. The second goal is considered as an important issue especially in some industries with expensive materials.Virtual cost (VC) is a parameter that is applied in order to solve the one dimensional cutting wastage concentration problem[29]. Mentioned parameter expresses the quality of wastage in concentration viewpoint on minimizing the big consuming pieces. In other words, it is tried to show the wastage concentration properly in this parameter in order to change the best quality level of wastage concentration into the quantity.This parameter can help us to search among the resulted optimum answers in one dimensional cutting problem to find the best one in cutting wastage dispersion viewpoint. Suppose that the cost of each stock differs from another. These costs are considered as virtual costs as increasing whole numbers. These virtual costs are attributed to each big stock, which is consuming in cutting process, and is multiplied in the amount of wastage in each stock. The least cost is allocated to the stock with the most wastage.
2.1. Total Virtual Cost (TVC)
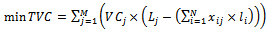
- The amount of virtual cost in each stock[(VCj)j] should be multiplied in the amount of wastage in each stock[(Wj)], then the resulted amount in each stock should be added together in order to calculate the total virtual cost (TVC). Formula (1) is used to figure out the application of total virtual cost in different wastages:
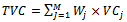 | (1) |
2.2. How to Use the Total Virtual Cost
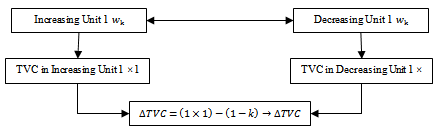
- Since the total virtual cost is a cost and we want to use it as criteria for wastage dispersion, it should be minimized. In other words, it is always tried to use some stocks with higher virtual cost for cutting process in order to reduce the increasing of virtual costs as much as possible. The process of calculating the total virtual cost is depicted in Figure 1:
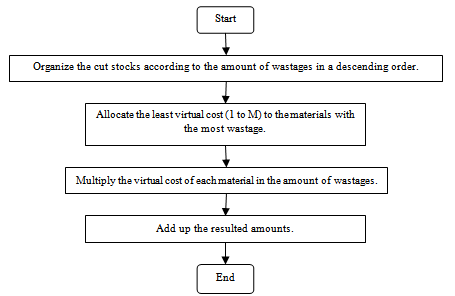 | Figure 1. A Chart to Calculate the Total Virtual Cost |
|
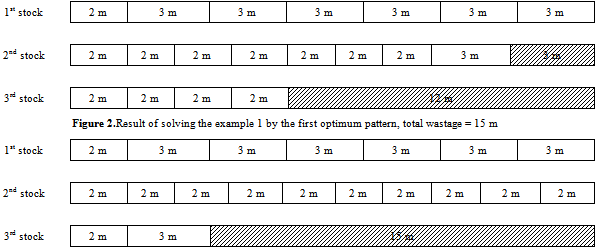 | Figure 3. Result of solving the example 1 by the second optimum pattern, total wastage = 15 m |
|
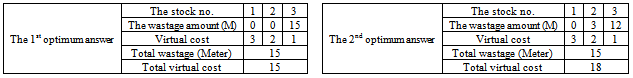
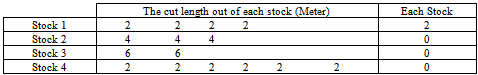
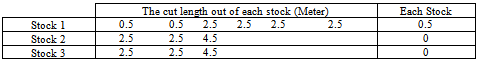
- It can be observed that the total virtual cost for the first optimum answer was less than the second one. And the wastage concentration in the first answer was better than the second answer as well. The longer length of wastages on the third stock is the exact meaning of wastage concentration.
3. The Problem Modeling
3.1. Compiling the Existing Parameters in the Problem
- The required parameters for compiling the mathematical model to solve the cutting wastage concentration problem, considering the virtual cost and calculate the minimum amount of total virtual cost are as follow:
 = the number of ordered pieces (small piece), as long as
  N = the total number of ordered pieces with different lengths
 = the length of ith ordered piece, i = 1, 2, …, N (this piece can be at the same size of other pieces.)M = the number of big pieces (consumed stocks).
 = the length of jth consumed stock, j = 1, 2, …, M.
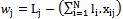
 = the wastage of jthstock.
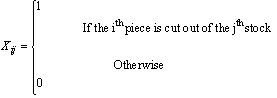 | (2) |
 | (3) |
 according to formula 4:
 | (4) |
3.2. Schematic Model of Minimizing the Dispersion in One Dimensional Cutting Stock Problem
- If we consider the cutting problem as an item-based problem, the primary amount can be offered by defining the total virtual cost as the target function in order to get to the minimum amount of total virtual cost and a cutting pattern with the best wastage concentration consequently.
3.3. The Target Function
- In this model, considering the defined parameters, the target function is defined according to the total virtual cost as follows [29]:
 | (5) |
 equals the wastage amount of jthstock
  , multiplied by
  and finally adding up the total amount of
  . It is called TVC and we are trying to minimize it.
3.4. The Model Restrictions
- The restrictions in this model can be divided into two different groups: firstly, the restrictions in the length of big pieces; and secondly, the restrictions in the number of small pieces cuttings.
3.4.1. Restrictions in the First Group
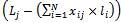
- This group of restrictions, whose numbers equal the number of big pieces, controls this point that the length of cut pieces out of a stock does not exceed the length of the same stock. According to the relation (6), this group is defined as follow:
 | (6) |
3.4.2. Restrictions in the Second Group
- This group of restrictions, whose numbers equal the number of items, controls this point that each small piece should be cut out of one stock only. According to the relation (7), this group is defined as follow:
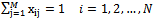 | (7) |
3.5. Evaluating the Optimization of Total Virtual Cost
- Firstly, two rules are discussed in order to evaluate the optimization in cutting wastage concentration model. These two rules should be considered in cutting the pieces. 1- Whenever one of the small pieces is cut out of a big piece, the existing wastage on the big piece decreases as long as the small piece length and whenever one of the small pieces is not cut out of a big piece, the existing wastage on the big piece increases as long as the small piece length. 2- All small pieces in the order list should be cut out of the existing big piece.Suppose that one of the small pieces is not cut out of the big piece. According to the first rule, it causes more wastage on the same stock. But according to the second rule, that small piece should be cut in the cutting process and be cut out of another stock. It leads to a point, in which according to the first rule the wastage of another big piece is decreased. Thus it can be mentioned that while changing the sequence of small pieces cutting, generally increasing or decreasing of the wastage in one of the big pieces lead to increasing or decreasing in another big piece. The amount of such an increasing or decreasing equals the length of replaced small piece (i.e. the general rule of cutting wastage concentration). In fact it can be pointed out as this word that increasing or decreasing of the wastage in one piece is in contrary to another piece. Considering this fact, which is known as the general rule of cutting wastage concentration, the optimum operation of the total virtual cost in concentrating the cutting wastage can be proved.Suppose that in a one dimensional cutting process, the virtual cost 2 is allocated to the kth stock, the virtual cost 1 is allocated to the k’th stock, and TVC is calculated according to these amounts. By replacing the ith piece as long as
 in cutting process, when the wastage of kth stock is increased
  unit, the total virtual cost will increase
 . According to the general rule of cutting wastage concentration, the increasing of cutting stock in kth stock leads to the decreasing on the k’th stock as big as
  unit. Thus the virtual cost will be decreased as big as
 . It can be observed that when the cutting wastage in unchangeable in both mentioned conditions, the virtual cost in the second condition will be increased as big as
 . By contemplating on the application of total virtual cost, it can be observed that whenever the cut stocks are organized according to the wastage in a descendant way, the best wastage concentration will be obtained, if the wastage appears on the first stocks (with less VC). It means that the items should be cut out of the stocks with more VC (i.e. last stocks) instead of the stocks with less VC (i.e. first stocks). Therefore the stocks with less VC contain more wastages and it reduces the TVC.Following scheme depicts the process of optimizing evaluation. In this diagram, it is supposed that the stocks are organized according to their wastage amount in a descendant way. And virtual cost is allocated to the stock as a whole number from 1 to M (i.e. the virtual cost in jth stock equals j). It is also supposed that: M > K > 1.If the
  changes are negative, it will be decreasing. Example 2: Suppose that big pieces are as long as 2 meters and the item order is as follow:
|
 equaled 1 and other
  amounts equaled zero. According to the amounts above, the cutting pattern was obtained as follow:
|
|
 equaled 1 and other
  amounts equaled zero. According to the amounts above, the cutting pattern was obtained as follow:
|
 | Figure 4. The Scheme of Optimizing Evaluation in Total Virtual Cost |
3.6. The Calculating Problems in this Model
- The discussed model is expected to get the minimum amount of cutting wastage concentration and its size is too big. It should be mentioned that cutting problems usually are raised in big sizes and considering increasing amount of variants 0 and 1, and increasing the restrictions consequently, solving this model at a big size is too time consuming and sometimes impossible. This model was planned to show the application of the cutting wastage dispersion problem only. It can be used to find an innovative method in order to solve the one dimensional cutting wastage dispersion problem by obtained ideas.Dependence of the model on the number of big pieces is another difficulty of this model. The exact number of required big pieces cannot be calculated before cutting. An upper bound can be supposed for the number of big pieces though. The extra big pieces can keep unused in cutting process in discussed model, but using the upper bound increases the dimensions of the problem groundlessly.The cutting process can be simulated once by a method in order to solve this problem. The approximate number of required big pieces in this model can be calculated via this simulation. A method on the basis of the metahuristic algorithms is needed to improve the searching condition of concentration in cutting wastage dispersion problems and use the discussed model to approach an answer close to an optimum amount in the logical time.
4. The Process of Optimizing Method by ICA
4.1. The ICA and its History
- The ICA is a method which has been used in many different optimizing problems since its introduction. At first, this method was introduced by Atashpaz et al. (2007) to solve the PID controlling problem[24].this algorithm is based on this logic that beside the natural aspect, the human evolution possess the social and political aspects as well. It has been the origin of the ICA phenomenon. Nowadays various activities are fulfilling to expand this algorithm usage according to the imperialism phenomenon in the world. In different researches, this algorithm has offered an optimized answer for many complicated engineering problems.
4.2. The Target Function
- As it pointed out earlier, the target function in this article is discussed as minimizing the TVC amount in relation (5). First of all, an array as long as N, containing the ordered items is formed. Another array is considered containing the length of stocks as long as M. The exact amount of M cannot be determined at first. So some changes are needed in algorithm FFD to determine the amount of M in order to get to the number of required stocks. According to such changes, when an item cannot be cut out of available stocks, one unit is added to M, and this process continues up to the end of cutting all items.The stocks will be organized according to their wastage amount after cutting all pieces and clarifying the amount of wastage in each stock. Finally the virtual costs will be allocated to the stocks. TVC is calculated in this way.
4.3. Producing the Primary Acceptable Answer
- In order to get to the primary answer, algorithm FFD executes for the current sequence after organizing the length of pieces in a descendant way. Since bigger pieces are cut out of bigger stocks first in this method, this answer looks qualified enough and it can be considered as an ideal primary answer.On the basis of this algorithm, if the length of ith piece is smaller than the rest of jth stock, it should be cut out of the jth stock
 . Otherwise if possible, it should be cut out of the next stock (i.e. stock jth + 1).The sequence of items is very important in using this method. Sometimes the wastage dispersion style (and sometimes the amount of sequences in cutting the items on the wastage dispersion) changes with such a sequence.
4.4. The Steps in Solving the Problem
- ICA has been used to solve many problems[24-27]. It was tried to improve the ICA method to solve the cutting stock problem. At first, the orders table, standard length of big pieces, the number of countries, the number of algorithm repetitions, related ratios to absorption factor, imperialist competitive and revolution are determined and put into related variants. Figure 4 depicts the chart of solving the problem.
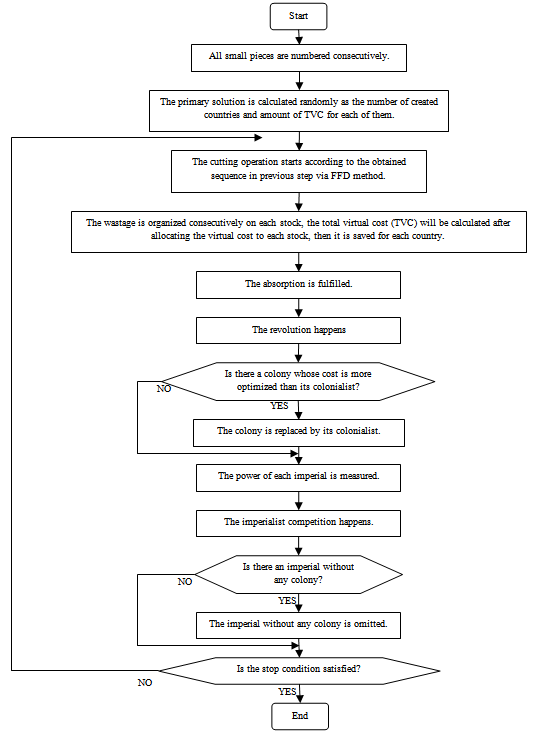 | Figure 5. The chart of solving the one dimensional cutting stock problem via ICA |
4.5. How to Stop the Algorithm
- The explained solution can be stopped under three circumstances: 1- When the wastage amount and total virtual cost equal zero, there will be no reason to continue the algorithm in this case. 2- Whenever the amount of wastage and total virtual cost are not the same. The amount of wastage will be concentrated on one big piece in this case, and it can be considered as the best wastage concentration. 3- When the number of evolved generations gets to a predetermined number in algorithm. The best possible answer on the memory is considered in this case, and it will be introduced as the best problem answer.
5. Problem Solving and Results
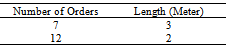
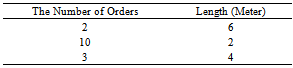
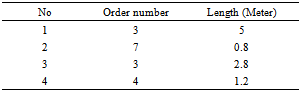
- At the first comparison, the application of ICA is compared to genetic, Tabu search and simulated annealing(SA) algorithmsfor a model in example 4 in smaller size. Suppose that big pieces are as long as 12 meters and ordered items are as following table:
|
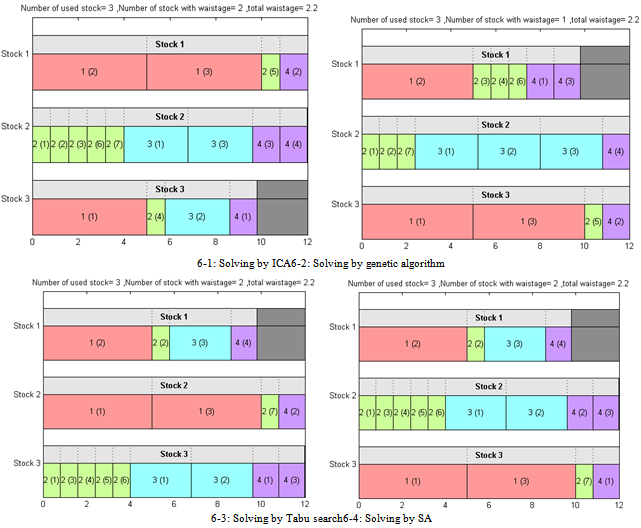 | Figure 6. Results of solving Ex. 4 via different algorithms (M) |
|
|
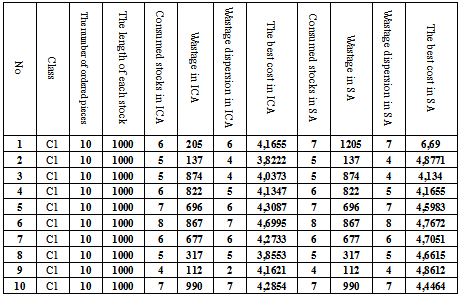
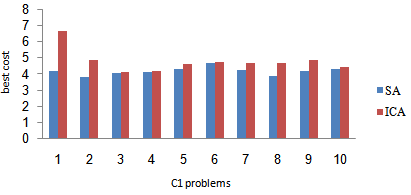 | Figure 7. Related results of solving the C1 problems |
|
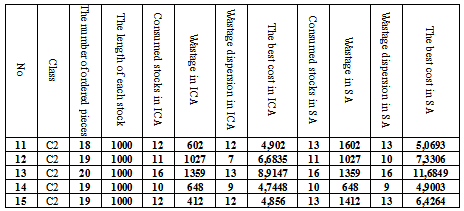
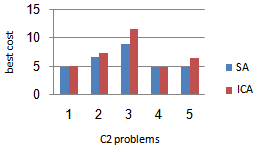 | Figure 8. Related results of solving the C2 problems |
|
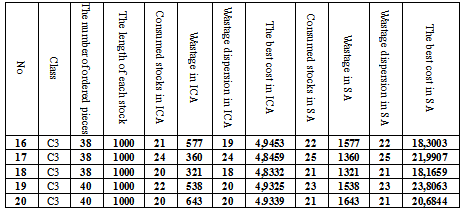
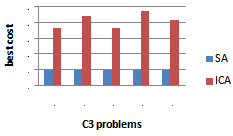 | Figure 9. Related results of solving the C3 problems |
6. Discussions and Future Works
- In this article, the extra costs were used in order to reduce the wastage dispersion and total wastage consequently among the answers of one dimensional cutting problem. A kind of virtual cost for cutting is obtained by applying the extra cost in cutting problem, which can be used as a criterion for comparing the resulted answers in order to get to better wastage dispersion. Finally, a solution was offered to solve the one dimensional cutting problem by applying ICA method and the wastage dispersion model. Comparing the resulted answers by ICA and SA methods, it was cleared that ICA is more efficient qualitatively (especially in bigger sizes that are closer to the real world models).As a suggestion for future works, it can be expressed that minimizing the cutting wastage to minimize the stock dispersion has been studied on the basis of evaluated items only. Evaluating this problem in a pattern-based condition not only can quicken the model responding, but it also is a proper background for researchers. Furthermore, applying some other algorithms, such as cuckoo search, can evaluate the model in an efficiency aspect by modern algorithms.