Alwaleed Abdelrahman 1, Omer Hamid 2
1Department of Electronics Engineering and Technology, University of Gezira, Medani,20, 2667, Sudan
2Department of Medical Equipment Technology, College of Applied Medical Sciences, Salman Bin Abdulaziz University Alkharj,422 ,KSA
Correspondence to: Alwaleed Abdelrahman , Department of Electronics Engineering and Technology, University of Gezira, Medani,20, 2667, Sudan.
| Email: |  |
Copyright © 2012 Scientific & Academic Publishing. All Rights Reserved.
Abstract
This article demonstrates a simple and robust enhancement method for breast ultrasound images based on quantizing the gray level intensities. The quantizing is performed using gray level co-occurrence matrices; that calculates the neighbor intensity interrelation according to the number of gray intensities per level. In this research we divide the gray scale to 15 levels. Gaussian and median filtrations were implemented and iterated 7 times, at each level, using a kernel size of 11x11. Finally each filtered level is translated back to its original location. This quantization technique significantly smoothes the breast ultrasound image while preserving edges. The performance of the algorithm has been compared with the standard filtering technique and evaluated using second order statistical methods. Test and synthesized images with induced speckle noise were used for technique verification and automatic edge detection. The proposed method demonstrates high filtration quality performance and edge preservation compared to the standard overall image filtration method. The textures were preserved with slight blurring. The proposed method introduces a new enhancing technique based on second order dependency matrices quantizing technique.
Keywords:
Enhancement, Gray Level Co-Occurrence Matrices, Quantizing, Breast Lesion, Ultrasound Imaging
1. Introduction
Breast cancer is one of leading death in women[1].Ultrasound imaging modality has a major role in the diagnosing of breast abnormalities due to its flexibility, safety and low cost compared with mammography. Breast ultrasound scanning is recommended rather than mammography for early detection of young females[1]. Ultrasound scanning is beset with noise such as speckle noise due the nature of ultrasound and the physics of interaction with tissues. The objective of speckle reduction is image enhancement and proper segmentation. Image noise cancellation algorithms encountered with some drawbacks such as reduction of texture details and edge blurring. Gray level co-occurrence matrices (GLCM) calculate the pixel interrelation based on particular distance in the four major directions. Several texture features extracted from the GLCM such as contrast, homogeneity, correlation and energy. Most of the time, researchers use GLCM texture feature descriptors as analysis and classification tools. A Mohd et al use GLCM to classify masses in mammo grams[2]. Hari W. et al implement GLCM and Gray-level and Run Length Matrix to classify cyst and Non-cyst in ultrasound imaging[3]. P. Babaghorbani et al, M. Vasantha et al and André Victor et al implement GLCM classification in breast ultrasound scanning to classifymalignant and benign breast tumours[4][5][6]. K. Padmavasavi et al, use the co-occurrence matrices features in thedetermination of thresholds to detect edges[7].
2. Method and Implementation
The proposed algorithm has been developed, in MATLAB environment, and tested using registered breast ultrasound from CD database[8]. Further verification of the method was done using synthesis images corrupted with noise. The sequence of image processing consists of three major stages: i- quantizing stage in which the original image is quantized into 15 correlated intensity levels ii- filtration and 7-times iteration stage that uses Median and Gaussian filters, and iii- reconstructing the image by translating each filtered quantized sub image to its original location.
2.1. Gray Level Quantizing, Using (GLCM)
The Gray level co-occurrence matrix (GLCM) computes the probability density function of image f(x,y) for all pair of pixels (i) and (j) in distance (d) with angular displacement (θ) =0,45, 90 and 135 degree[9], the calculation will compute the frequency of gray tone occurrence for angular adjacent pixels. The GLCM has been used for two purposes, quantizing the ultrasound images to improve the filtration, and extraction of features’ descriptors. In term of theory quantising or gray level slicing amounts to a multiplication by a window of a specific size in space domain. Such multiplication will translate high frequency components (edges) to baseband frequencies (low frequencies). The Median and Gaussian filters (second stage) work very well at these low frequencies.
2.2. Filtration and Iteration Stage
Several techniques for despeckling of ultrasound images have been documented[10]. The minor reflections of ultrasound wave develop the speckle noise which reduces the contrast and the small details delectability[10]. A linear Gaussian filter and a non-linear median filter were implemented to smooth the images, the size of the filters was 11x11[9]. Linear isotropic Gaussian filter is commonly used to smooth the image. A Median filter calculates the median value of the moving window and replaces it with the central window value. Median filters are effective in removing step noise[11]. The utilizing and limitation of such filters in image processing has been demonstrated[10] [11]. A Linear and non linear techniques were used for noise reduction, enhancement the contrast and preserve the edges. The proposed standard filtration techniques were iterated seven times to reduce the image noise. The iteration has no blurring effect, though it reduces noise. The filtering of each quantized level has resulted in good image filtration process with minimal edge blurring.
2.3. Translation and Image Reconstruction Stage
The original image is sliced into 15 quantized frames; each frame has the same size of the original image containing interrelated of 17 gray tones co-occurrences. Each frame is filtered 7 times and translated back to the original image location to reconstruct the filtered image.
3. Results
The nature of ultrasound interaction with tissue develop artefact, low contrast and low resolution image. The overall mechanism of the proposed filtration technique performs the low pass filtration in special manner, where the low frequency components are well filtered while preserving the high frequency components; this technique keeps the edge highlighted. In literature it is preferable to implement small size kernel low pass filter in order to preserve the fine details and image textures from bullring, our proposed technique is able to use large kernel size with less over smoothing results. Ultrasound breast image database CD is used to evaluate our proposed method. The gray quantization introduces a special technique that preserves edges; the edges are spared in different filtered levels. The proposed method is able to reduce the noise and preserve the image local and global details, which is important step in breast lesion diagnosing and classification.Figure (1) shows an example of a noisy breast ultrasound image processed by the general and the quantized filtration technique. (a) is original breast image (ORG.), (b) corrupted with speckle noise of 0.01 variance, (c) the proposed quantizing method (QZ.) result, and (d) is the standard general filtration (GRN) output. Visual inspection indicates that, the proposed filtration technique smooths the homogenous regions effectively and preserves the major edges. Another example of breast image processing is given in Figures (2) and (3). The 15 levels of quantization are found to be suitable given the limited resolution of ultrasound imaging. 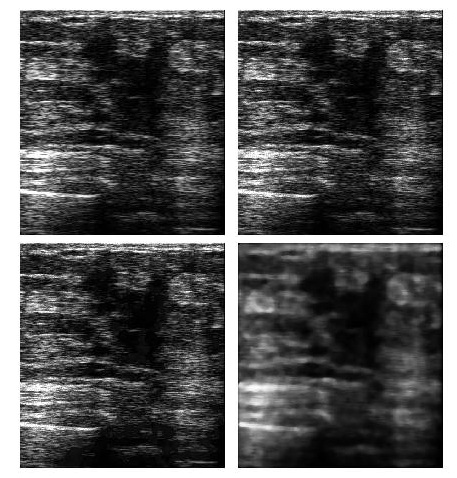 | Figure 1. Breast ultrasound image from top left the (a) original image (b) corrupted image with speckle noise of 0.01 variance (c) filtered image using quantizing technique (d) filtered image using standard general filtration |
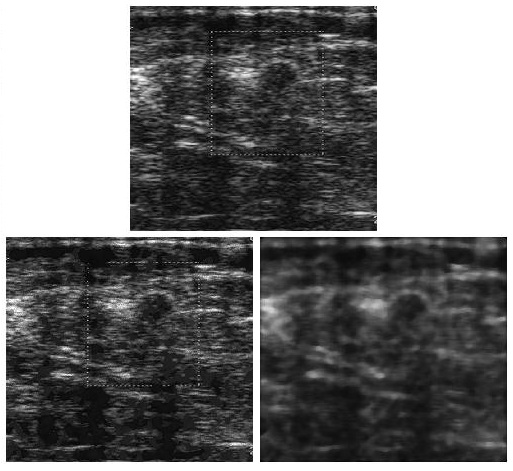 | Figure 2. Presents breast ultrasound image from top left (a) original image (b) filtered image using quantizing technique (d) filtered image using standard general filtration technique |
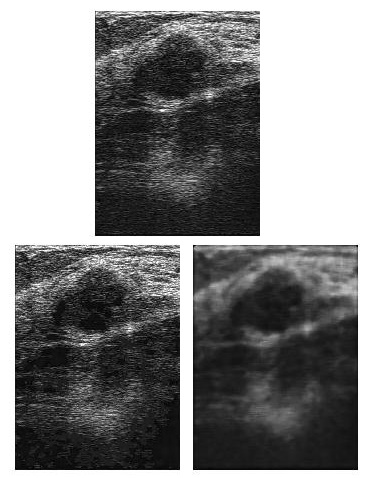 | Figure 3. Presents breast ultrasound image from top left (a) original image (b) filtered image using quantizing technique (d) filtered image using standard general filtration technique |
4. Evaluation
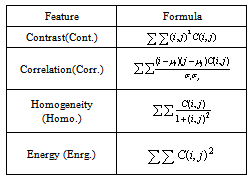
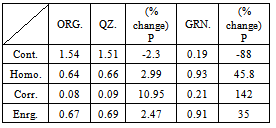
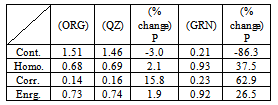
The processed image has been evaluated using visual perception and second order statistics that estimate the overall improvement in the texture. The GLCM features descriptors used in our analysis are: contrast (Cont), correlation (Corr), homogeneity (Homo) and energy (Enrg). The descriptors’ equations are given in Table (1), where C is the concurrence of gray tone at pixel (i) and pixel (j)[7][9]. The contrast descriptor which is presents the power of the intensity similarity interrelation of the image. The homogeneity feature shows progressed flatness degree of the division of co occurrence elements. The correlation descriptor shows improve linked interpixel redundancy value. The energy represents enhancement in the power of co occurrence.The evaluation was done to statistically estimate the performance (P) of the proposed method in comparison to the standard general filtration technique (GRN.). Table (2) presents the second order GLCM statistics, the proposed algorithm has remarkable texture similarity to the original image features, the interrelation is (-2.3%). The homogeneity feature shows progressed flatness co occurrence elements degree (2.99%). The correlation descriptor shows improve linked interpixel redundancy value (10.95%) and the energy represents enhancement in the power of co occurrence (2.47%). The interpretation of the GLCM features is that the low descriptors values mean high texture similarity to the original image at least 98.05% similar. Compared to the general filtration technique, the intensity interrelation is highly degraded (-88%), see Table (2). While the over smoothed image increases the homogeneity (45.8%), boosting the image correlation (142%) and energy descriptor (35%). Table 1. The Second Order Features Formula Used to Evaluate the Processed Image
 |
| |
|
Table 2. GLCM Features of the Breast Ultrasound Image
 |
| |
|
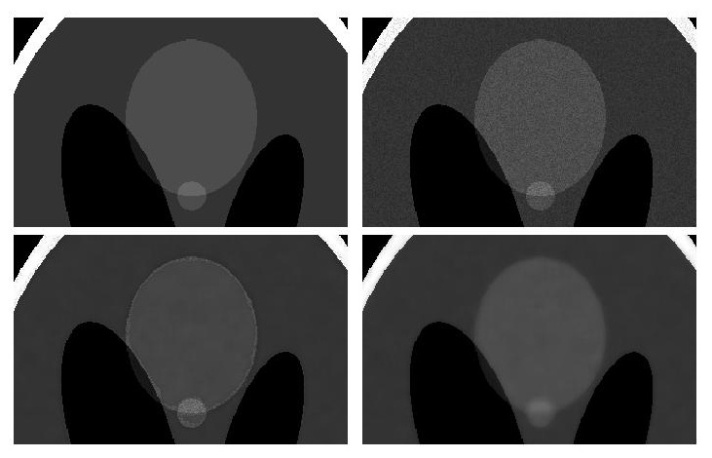
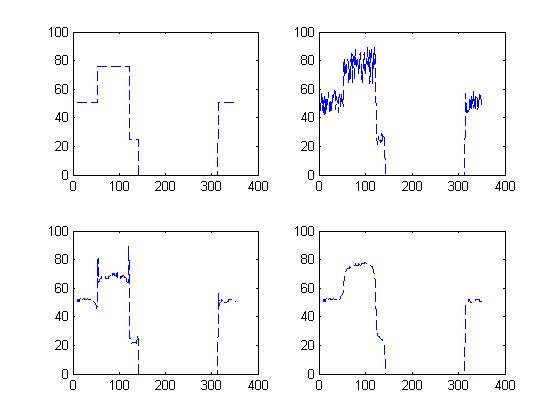
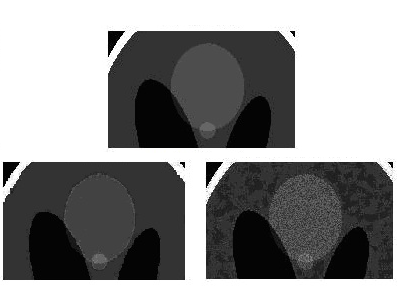
A synthetic image is used to estimate the performance of our proposed algorithm. Evaluation tools such as visual perception, N. Otus’s automatic edge detection, statistical analysis and image texture, were implemented to assess the effect of the algorithm in local and global details. Figure (4) shows a phantom image (a), corrupted with speckle noise of variance of 0.01(b), Then filtered with our method (c) and the general method technique in (d). Region of interest (ROI) has been cropped as in figure (5), enhancement in contrast is observed. Figure (6) presents a cross section of the synthesized image (a) original image (b) the quantized filtration (c) the general filtration, the result shows good image restoration with the proposed method but the general method blurred some details such as edges. Figure (7) shows the implementation of automatic N. Otsu’s edge detection of the original image (a), the proposed method effectively highlighted the edge (b), more than the general technique in (c).Statistical evaluation has been implemented to estimate the effect of the proposed method on GLCM texture descriptors presented in table (3), the proposed method adequately preserve the texture features of the syntheses image, the worst descriptors is around 16%. In other hand the common filtration dramatically deteriorate the textures features. 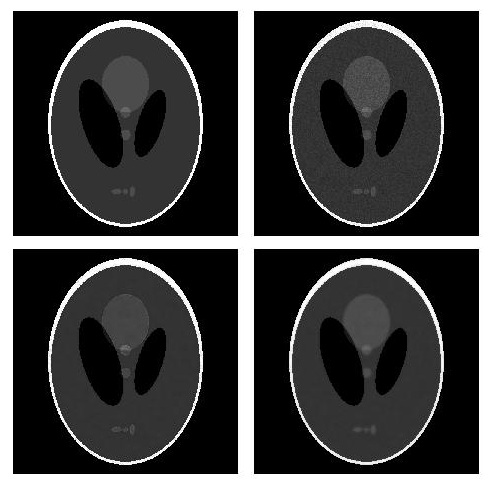 | Figure 3. A synthesized image from top left (a) original image (b) corrupted image with speckle noise of 0.01 variance (c) filtered image using quantizing technique (d) filtered image using standard general filtration technique |
 | Figure 4. A synthesized image region of interest (ROI) from top left (a) original image (b) corrupted image with speckle noise of 0.01 variance (c) filtered image using quantizing technique (d) filtered image using standard general filtration technique |
 | Figure 6. A cross section of the synthesized image region of interest (ROI) from top left (a) original image (b) section of image corrupted with 0.01 variance speckle noise (c) section of filtered image using quantizing technique (d) section of filtered image using general standard filtration |
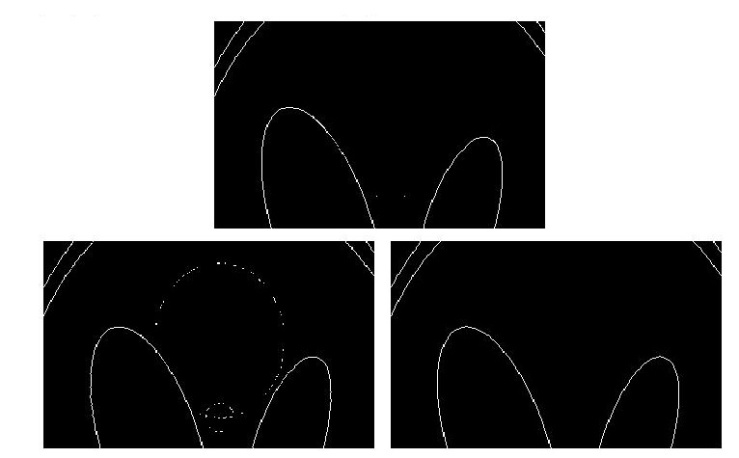 | Figure 7. A synthesized image region of interest (ROI) auto edge detection of corrupted image with speckle noise of 0.01 variance, from the left (a) edge of original image (b) edge of filtered image using quantizing technique (c) edge of filtered image using general standard filtration technique |
 | Figure 8. A synthesized image region of interest (ROI) from top left the (a) original image (b) filtered image, corrupted with speckle noise, using gray slicing filtration technique (c) filtered image using quantizing technique (d) filtered image using standard general filtration technique |
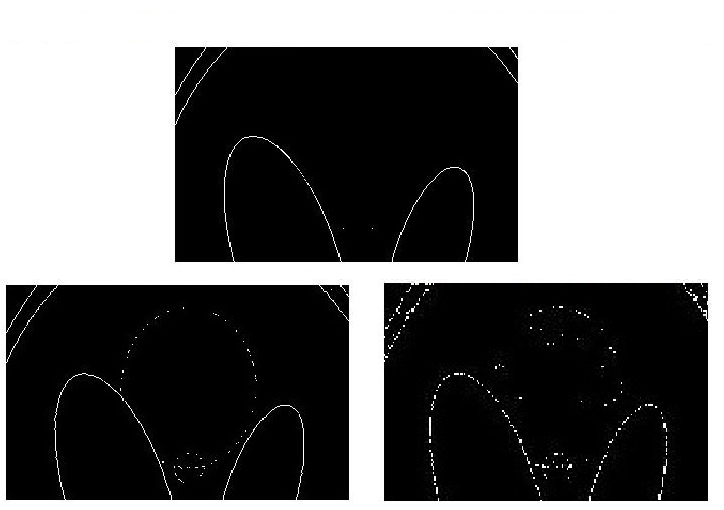 | Figure 9. Visual comparison between the GLCM quantizing and gray slicing techniques. Edge detection of (ROI) of an image corrupted with speckle noise, from the left (a) edge of original image (b) edge of filtered noisy image using GLCM quantizing technique (c) edge of filtered noisy image using gray intensities threshold (gray slice) |
Table 3. GLCM Features of the Whole Synthesized Image
 |
| |
|
Gray slicing technique (GS) which is based on direct threshold selection of scaled gray tone levels has been implemented as a control in the evaluation of the quantizing technique. Figure (8) shows a region of interest cropped from the ultrasound synthesized image (top) and the corresponding filtrated images from left the quantizing technique and gray slicing technique respectively, figure (9) the corresponding automatic edge detection .The visual perception shows better noise reduction and texture features preserving when GLCM quantization is used. Table (4) presents the statistical evaluation of the gray slicing and quantizing filtration, the overall performance (P) of the gray quantizing looks better than the gray slicing technique.| Table 4. Quantizing and Gray Slicing Technique Glcm Features % Change |
| | Feature | QZ | GS | | Cont. | -3.0% | -14.3% | | Homo. | 2.1% | 2.4% | | Corr. | 15.8% | 7.8% | | Enrg. | 1.9% | 4.9% |
|
|
5. Conclusions
Gray tone quantizing technique has been proposed to enhance the filtration performance and preserve the image texture. Quantizing the image into 15 levels proved to be adequate for ultrasound scan. Registered breast ultrasound image data base and synthetic images were used to implement the proposed method. Gray threshold technique or gray slicing results were compared to the quantization technique performance. Second order statistic calculations have been implemented to evaluate the image texture features. The proposed method of the gray quantizing technique produces novel results. The proposed method establishes a new technique for edge preservation. The proposed method effectively reduces the noise, preserves the texture and edges. Future work will include the analysis of the method in the space and frequency domain and the effect of the slice thickness on the image enhancement.
References
| [1] | Breast cancer, Understanding Breast Cancer Riskhttp://www.breastcancer.org/risk/understanding. |
| [2] | A Mohd. Khuzi, BEng, R Besar, WMD Wan Zaki, MEngSc, NN Ahmad ” Identification of masses in digital mammogram using gray level co-occurrence matrices” Biomed Imaging Interv, J 2009, 5(3):e17 2. |
| [3] | Hari Wibawanto, Adhi Susanto, Thomas Sri Widodo and S. Maesadji Tjokronegoro ”Discriminating Cystic and Non Cystic Mass using GLCM and GLRLM-based Texture Features” International Journal of Electronic Engineering Research ISSN 0975 – 6450, Volume 2 ,Number 4, (2010) pp. 569–580. |
| [4] | P. Babaghorbani ,AR. Ghassemi ,S. Parvaneh and K. Manshai” Sonography Images for Breast Cancer Texture classification in Diagnosis of Malignant or Benign Tumors” in 4th International Conference on Bioinformatics and Biomedical Engineering (iCBBE), 2010 . |
| [5] | M.vasantha, v.subbiah bharathi, dhamodharan”Medical Image Feature, Extraction, Selection and Classification” International Journal of Engineering Science and Technology Vol. 2(6), 2071-2076, 2010. |
| [6] | André Victor Alvarenga,a Wagner C. A. Pereira,b and Antonio Fernando C. Infantosic and Carolina M.Azevedo ”Complexity curve and grey level co-occurrence matrix in the texture evaluation of breast tumor on ultrasound images” Med. Phys. 34 ,2, 0094-2405/ February 2007. |
| [7] | K. Padmavasavi, N. Udaya Kumar, E. V. Krishna Rao, M. MadhaviLatha” Performance Evaluation of Adaptive Statistical Thresholding Based Edge Detection Using GLCM in Wavelet Domain under Noisy Conditions” ICGST-GVIP Journal, Volume 10, Issue 3, August 2010. |
| [8] | Breast –ultrasound CD.ROM database,http://www.breast-ultrasound.com/en/index.cfm. |
| [9] | Robert M. Haralick”Statistical and Structural Approaches to Texture” IEEE Proceedings of Vol. 67, no. 5, May 1979. |
| [10] | Christos P. Loizou and Constantinos S. Pattichis, Despeckle Filtering Algorithms and Software for Ultrasound Imaging, Morgan & Claypool.USA.2008. |
| [11] | Rafael C. Gonzalez, Richard E. Woods, Digital Image Processing, Second Edition, Prentice Hall, New Jersey, 2002. |
 Abstract
 Reference
 Full-Text PDF
 Full-Text HTML