-
Paper Information
- Paper Submission
-
Journal Information
- About This Journal
- Editorial Board
- Current Issue
- Archive
- Author Guidelines
- Contact Us
International Journal of Inspiration & Resilience Economy
2022; 6(1): 1-9
doi:10.5923/j.ijire.20220601.01
Received: Nov. 17, 2021; Accepted: Mar. 28, 2022; Published: Apr. 21, 2022

Efficiency Analysis of U.S. States’ Responses to COVID-19
 Abstract
 Reference
 Full-Text PDF
 Full-text HTML
Derek Aegerter, Keenan Nakagawa, Amarjit Singh
Department of Civil & Environmental Engineering, University of Hawai‘i at Mānoa, Honolulu, HI, USA
Correspondence to: Keenan Nakagawa, Department of Civil & Environmental Engineering, University of Hawai‘i at Mānoa, Honolulu, HI, USA.
| Email: |  |
Copyright © 2022 The Author(s). Published by Scientific & Academic Publishing.
This work is licensed under the Creative Commons Attribution International License (CC BY).
http://creativecommons.org/licenses/by/4.0/

The year 2020 saw the beginning of a global pandemic unlike any in the previous century. Worldwide in 2020, there were over 115 million documented infections of SARS-CoV-2 and over 2.5 million deaths from the associated COVID-19 disease. In the United States of America alone there have been over 29 million cases and at least 525,000 deaths, at the time of writing. This has resulted in varying degrees of shutdowns, resulting in at least $2.04 trillion in lost GDP and an increase in nationwide unemployment rate from 3.5% in February 2020 to 14.7% in April 2020. With the US federal government distributing nearly $500 billion to state and local business and corporations, it is prudent to examine the efficiency by which these entities were able to use these funds, along with their existing resources, to dampen the effects of the unprecedented situation. This paper will discuss the herein performed Data Envelopment Analysis (DEA) for all 50 states, and the results and limitations thereof. DEA is useful in exploring relative inefficiencies of similar but distinct systems. DEA can only identify a system which is relatively inefficient compared to a composite weighted system and cannot provide much by way of suggested improvements. A detailed discussion of each input and output is provided so that subsequent analyses may be performed by others using different variables they deem important. Using the described inputs and outputs, it was discovered that 22 states are relatively inefficient, and the contributing factors are examined.
Keywords: Data Envelopment Analysis, Linear Programming, Coronavirus
Cite this paper: Derek Aegerter, Keenan Nakagawa, Amarjit Singh, Efficiency Analysis of U.S. States’ Responses to COVID-19, International Journal of Inspiration & Resilience Economy, Vol. 6 No. 1, 2022, pp. 1-9. doi: 10.5923/j.ijire.20220601.01.
Article Outline
1. Introduction
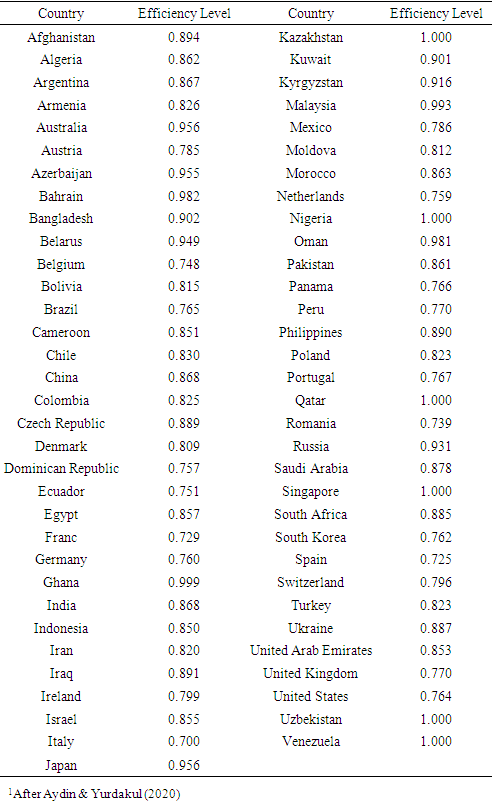
- The pandemic and respiratory disease, COVID-19, precipitated by the spread of the virus SARS-CoV-2 has impacted all aspects of human civilization in the 21st century. The virus first emerged sometime in late-2019 and arrived in the United States shortly thereafter with the first confirmed case coming in the early months of 2020. Since then, the virus has infected a recorded 74,000,000 and caused at least 1,600,000 deaths worldwide.The United States has been affected disproportionately by this virus when compared to other countries, and recent analysis has shown that the United States as a country has been particularly inefficient in responding to the pandemic, as seen in Table 1 (Aydin & Yurdakul, 2020). At the time of that study, the United States had seen over 16,000,000 documented cases of COVID-19 which have caused over 300,000 deaths. Moreover, the US has seen at least $2,040,000,000,000 in lost GDP and an increase in unemployment from 3.5% in February 2020 to 14.7% in April 2020.
|
1.1. Background
- This paper aims to investigate further the causes of the United States’ low efficiency index on a world scale by analyzing the response of each state. It has often been asked which states are performing well and which aren’t. Using Data Envelopment Analysis (DEA) it may be possible to discover systemic inefficiencies shared by states which can be improved upon at a national level, or the analysis may bring to light an outlier state responsible for a significant portion of the inefficiencies.
1.2. Objective
- The goal of this analysis is to examine the performance efficiency of each of the 50 States in the United States and identify the parameters which affect their performance. The efficiency of each state is compared to the average composite efficiency of all the states in the United States. The inefficiency of a state is identified when the composite efficiency index, E, is found to be less than 1. This means that a composite state can be found which uses relatively fewer resources than the state being compared while reacting to the pandemic. A state which can be thought of as efficient during the pandemic is one that is able to:Ø minimize the spread of the virusØ confirm suspected cases with testing Ø adequately handle positive cases Ø minimize the closure of businessesØ minimize the impact to the working publicIn order to effectively achieve these outputs, a state requires various resources of funds, prior investment, and local expertise including:Ø Primary Care PhysiciansØ Hospital InfrastructureØ Critical Care Healthcare ProfessionalsWe expect this study to shed light on areas of relative inefficiency at the state level so that further analysis can be performed to help minimize these inefficiencies. It is assumed that decreasing inefficiencies at the state level will necessarily decrease inefficiencies at a national level. A decrease in inefficiency would imply more testing, fewer cases and mortalities, increase in GDP, and a decrease in unemployment.
1.3. Scope
- This analysis considers all fifty (50) U.S. States. Out of scope of this analysis are districts, territories, and occupied zones. Specifically, it was decided to exclude the District of Columbia, Puerto Rico, U.S. Virgin Islands Guam, American Samoa, and Northern Mariana Islands because these entities are significantly different from the conterminous forty-eight (48) states in many ways which may affect the analysis and cause imprecise results.
2. Methodology
- Data Envelopment Analysis (DEA) was performed using the linear programming computer software, LINDO, a popular analytical tool (LINDO 2003). DEA is often used by professionals and academics to quantify complex systems with many inputs and outputs. A major benefit to DEA is it does not require defining input or output parameters as a function of other variables. This method allows the linear program to construct a composite system (in this case, a composite state) which has an averaged quantity of inputs and outputs. This ratio of inputs to outputs of the composite system is the composite efficiency index, E. (Anderson et al. 1991).Each system (state) can then be compared to this composite system to determine its relative efficiency. One significant drawback to DEA is that it is only able to determine if a system is relatively inefficient compared to the composite system and is unable to quantify by how much a system might be relatively efficient. Additionally, any system which has a maximum value for any given output is unable to be judged inefficient by the linear program, even if it might otherwise be so.By virtue of the equations, a higher quantity for any given input serves to decrease efficiency while a higher quantity for any given output serves to increase efficiency. For our model of a state, we have some inputs and outputs which are directly related to efficiency and others which are inversely related. For this reason, each input and output was analyzed for its most significant relationship with regards to efficiency, and if it was deemed to be inversely related the quantity was reciprocated prior to inclusion into the DEA. This process is discussed in further detail in each respective section.
3. Inputs
- Inputs are considered to be parameters that directly affect the outcomes of the states’ responses to the COVID pandemic. The input parameters are an indicator of the method and assistance that each state receives to mitigate the effects of the virus. With much consideration, we made sure that our input parameters were directly COVID-related, and all data was available. The input information will allow us to measure each state's inefficiency by comparing what each state has to the composite of all the states.
3.1. COVID-Related Federal Funds Received
- Total federal funds received in the state is considered to be the primary factor for this study and is therefore the first listed input. It is important to note, however, that DEA does not weight any input or output more than another. Initially it was surmised that only federal funds paid directly to state and local government agencies would be input to the analysis, but after further consideration it was determined that the more applicable value is total federal funds received by all entities within a state including business and non-profit organizations.Total federal funds received in the state contributes not only to testing ability and medical supplies required for COVID-19 care, but also, because the funds tallied include those funds received by private businesses, the funds should help to temper losses in GDP and increases in unemployment rates. All COVID-related federal funds data is taken from the U.S. Bureau for Fiscal Service (BFS, 2020).
3.2. Population
- Population is considered an input to the system because it affects all aspects of a state’s response. Additionally, a state’s population is correlated to the amount of federal funds it received. However, a state’s population is also directly correlated to the number of infections and deaths a state might see. For this reason, we also consider population density of a state as an input to the system. All population data is taken from the U.S. Census Bureau (UCB, 2020).
3.3. Population Density
- Population density of a state is considered to be a reciprocal input to the system. That is, as a state's population density decreases it should be expected that the number of cases and deaths also decreases, mainly because of a naturally induced social distance. It is however also likely that a less dense population would make testing efforts more difficult and costly per person. All population density data is taken from the U.S. Census Bureau (USCB, 2020).
3.4. Average Age
- Average age of a state’s population is suspected to play a factor in the rate of deaths. However, the range of average ages was 31 to 44.9, in Utah and Maine, respectively, and therefore may not be a significant input of the DEA. Average age is considered to be a reciprocal input to the system. Average age data is taken from the U.S. Census Bureau (USCB, 2020).
3.5. COVID-Applicable PCPs
- Primary care physicians (PCPs) are expected to be the lowest level of healthcare, so to speak, for an infected citizen. For this input, we analyzed the total number of PCPs in each state and subtracted the number of PCPs in fields which we did not consider to be applicable to the diagnosis or treatment of COVID-19, namely obstetricians/gynecologists, etc. This number includes registered Physicians Assistants and Nurse Practitioners. All PCP data is taken from Kaiser Family Foundation (KFF, 2020).
3.6. Staffed Hospital Beds
- Total staffed hospital beds in a state can be thought of as the initial hospital care that a patient would receive. Without enough hospital beds, patients might be unable to get the care their symptoms require and might progress to worse stages of the illness. All staffed hospital bed data is taken from the Kaiser Family Foundation (KFF, 2020).
3.7. 1st & 2nd Line HCPs
- 1st- and 2nd-line healthcare professionals are defined as ICU physicians and nurses, as well as Emergency Medical Technicians. The number of these professionals should be directly correlated to keeping hospitalized patients from dying. All data regarding 1st- and 2nd-line healthcare professionals is from Kaiser Family Foundation (KFF, 2020).
3.8. ICU Beds
- The total number of ICU beds in a state is also expected to be directly correlated to ensuring that hospitalized patients receive the care they require. All ICU bed data is taken from Kaiser Family Foundation (KFF, 2020).
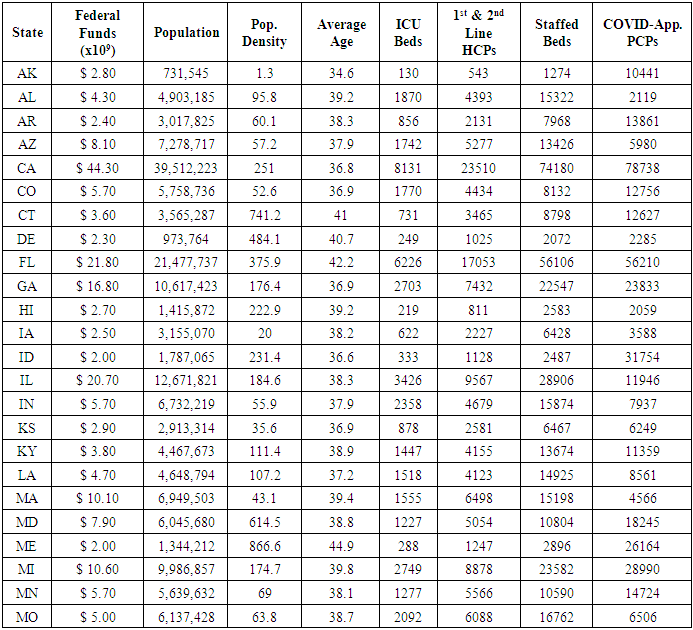
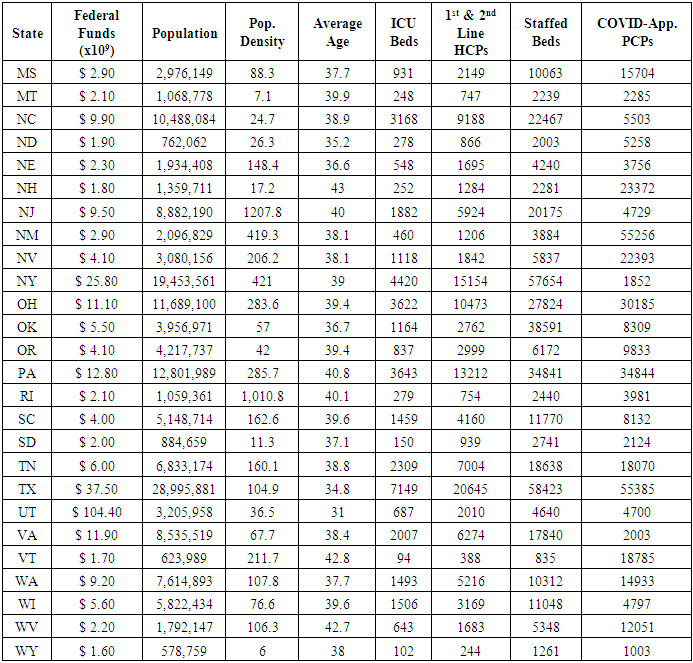
3.9. Input Summary
- All input values used in this analysis are compiled in Appendix Table 1. Reciprocals are taken for both Population Density, and Average Age, due to the inverse relationship between these values and efficiency.
4. Outputs
- Outputs are considered to be the outcome from the pandemic. The output parameters surely affect the performance of each state which makes it very important to study and identify the major effects it has on each state so that future preparation is made. The efficiency of each state is then measured from how well they were able to manage these output parameters.
4.1. Tests Performed
- The number of tests performed are directly proportional to the efficiency of a state. While testing does not guarantee that the pandemic is managed, each test performed helps ensure that those testing positive are treated, and those people potentially exposed take appropriate precautions. Testing availability and costs varied greatly from state to state and is expected to be a key indicator in a state’s efficiency. All testing data is taken from Johns Hopkins University of Medicine (JHUM, 2020).
4.2. COVID Cases
- The number of reported COVID cases is considered to be a reciprocal output of the system, since our aim is to have the least cases as possible. While increased testing will invariably lead to an increase in documented cases, increased testing also allows for the early identification and tracing of patients. This allows the state to ensure that every COVID case has the proper attention and care it requires. All COVID case number data is from the U.S. Centers for Disease Control and Prevention (CDC, 2020).
4.3. COVID Deaths
- The reported number of COVID deaths is considered to be a reciprocal output of the system. The ultimate goal of a states’ response to the pandemic is the welfare of its citizens and minimization of deaths. All COVID case number data is taken from the U.S. Centers for Disease Control and Prevention (CDC, 2020).
4.4. Change in GDP
- Behind ensuring the physical health of the citizenry, the states’ response also has the direct effect of slowing the productivity of the local economy. One measure of the productivity of a states’ economy is the total Gross Domestic Product (GDP). It is expected that, without the pandemic, the GDP for each state would have remained relatively stable throughout 2020. Therefore, we considered the percentage change in GDP in 2020 to be a reciprocal output of the system, since the least GDP decline is a better output. All GDP data is taken from the U.S. Bureau of Economic Analysis (BEA, 2020).
4.5. Change in Unemployment
- Another key indicator to economic health is the unemployment rate. Again, it is expected that without the pandemic, the unemployment rate for each state would have remained relatively stable throughout 2020. For this analysis we used percentage-points change in unemployment rate, 10/2019-10/2020, seasonally adjusted as a reciprocal output of the system. All unemployment data is taken from the U.S. Bureau of Labor Statistics (BLS, 2020).
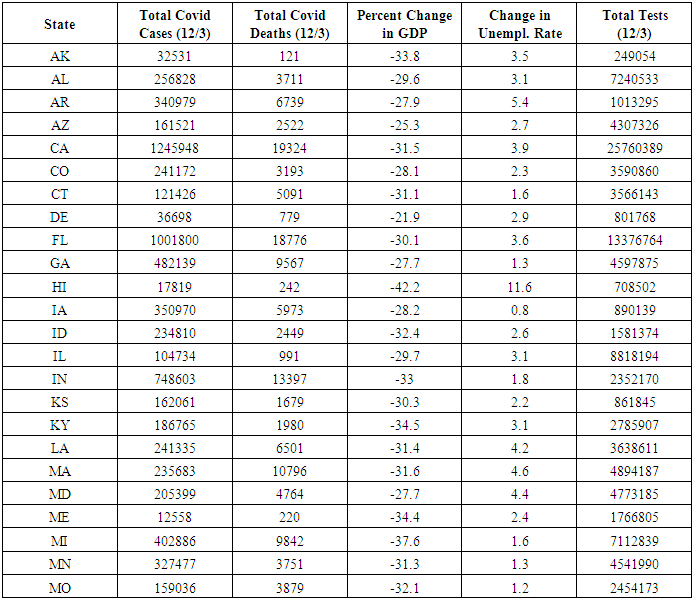
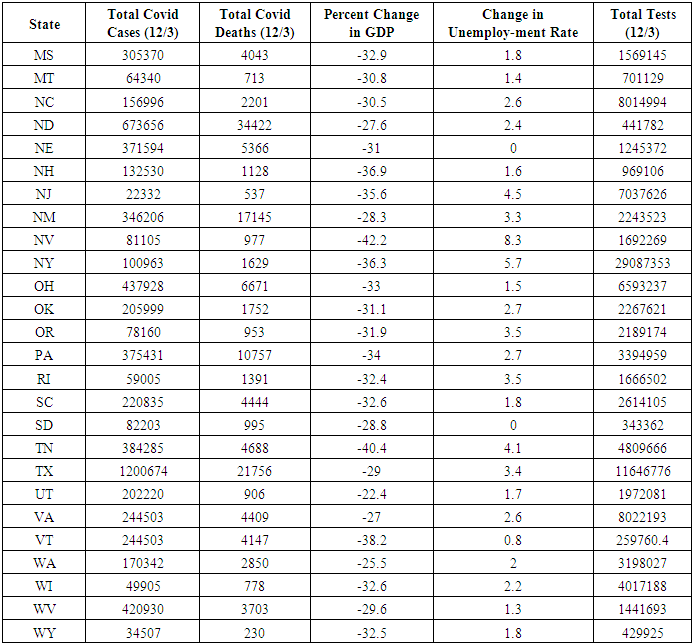
4.6. Output Summary
- All output values used in this analysis are compiled in Appendix Table 2. Reciprocals are taken for all values except for Test Performed due to the inverse relationship between these values and efficiency. There are seven states which have the highest value for any output, and therefore are unable to be properly assessed using DEA: Ø NY performed the most COVID-19 TestsØ ME reported the fewest cases of COVID-19Ø AK reported the fewest COVID-19 deathsØ NE and SD reported no change in seasonally adjusted unemployment rate, which is a reciprocated output and therefore undefined. IA reported the lowest non-zero change for unemployment rateØ DE reported the smallest decrease in GDP
5. Parameter Relationships
- The relationships between each input and output parameter are very complex, but do not need to be identified or analyzed in DEA analysis. An increase in population, for example, can simultaneously increase the number of tests (beneficial) and the number of cases (detrimental). Similarly, there are relationships between different input parameters. Broadly speaking more federal funds went to more populous states, for instance, and healthcare infrastructure and expertise is also correlated with population size.Furthermore, there are relationships between output parameters. As mentioned previously, an increase in the number of tests performed can lead to an increase in the number of cases. Certainly, unemployment rates and GDP are correlated.These complex relationships need not be considered while performing DEA, which makes this method particularly suited for this problem.
6. Formulation of the Linear Program
- DEA is a common analytics tool to identify which systems within a group of systems are performing relatively inefficiently with a given set of inputs and outputs (I/O). In order to define the system, we must first assign a unique weighting variable to each of the 50 states. It is logical to use each state’s two-letter abbreviation for the weighting variable. For example:
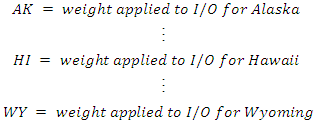 By doing this, the linear program employed in DEA can weight each system appropriately to determine an average composite system, subject to a variety of constraints.
6.1. Objective Function
- The DEA linear program attempts to find a weighted composite system which allows for the smallest value of the composite system efficiency index, E. If a solution can be found such that E<1, it can be interpreted that the composite system requires less input to generate the same output as the system being analyzed. This would mean that the composite system is more efficient than the system (state) being analyzed Therefore, the objective function can be simply stated as:

6.2. Constraints
- Constraints serve to limit the governing equations in order to best address the target problem. A DEA performed without constraints would simply set
 and be finished with the analysis. Instead, mathematical relationships are required which associate the various inputs and outputs with E. Additionally, it is vital to define each weighting variable to be non-negative, as no input or output can conceivably be negative. Additionally, all constraint equations were scaled to avoid floating point errors in LINDO which occur for values below 10-5 (LINDO, 2003).
6.2.1. Non-negativity Constraint
- If weighting variables are allowed to be negative, the analysis will fail to converge. Therefore, it is critical that each is defined as such:
 Owing to the structure of LINDO, each variable must be individually assigned a non-negativity constraint in the set of input equations. This may make the equations bulky, but they do the needed work.
6.2.2. Weight Constraint
- In order to form the composite system, the DEA adjusts the weighting variables such that the sum of the weighting variables is equal to 1. This is easily understood by the fact that the entire system constitutes the composite system. This constraint allows the composite system to be directly compared to any other system in the analysis. The equation governing this constraint can be stated:

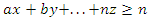
6.2.3. Input Constraints
- Generally speaking, input constraints to a DEA take the form:
 where z is the weighting variable being analyzed against the composite system and n is the value of that constraint applicable to z. For example, the constraint equation for the input of Federal Funds Received when analyzing Alaska’s relative efficiency takes the form-
 where the dollar input of federal dollars to Alaska was $2.8 billion. The values for all states are available in Tables 1a and 1b of the Appendix. The linear programming software being utilized to perform this DEA, LINDO, has a specific syntax which requires that all variables be on the left hand side of the comparator. Also, LINDO interprets a
  sign to be the same as
  and similarly for greater-than. Therefore, each input inequality is rearranged to take the form:
 Our analysis for each state requires eight input constraint equations, two of which are reciprocated: population density, and average age.
6.2.4. Output Constraints
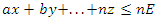
- Generally speaking, output constraints to a DEA take the form:
 where, again, z is the weighting variable being analyzed against the composite system and n is the value of that constraint applicable to z, the weighting variable for the system being analyzed. For example, the constraint equation for the output of Total COVID Tests Performed when analyzing Alaska’s relative efficiency takes the form-
 Where 2.49 represents the 249,000 tests performed in Alaska. The values for all states are available in Tables 2a and 2b of the Appendix.Our analysis requires five output constraint equations, only one of which is not reciprocated – the one for total tests performed.Hence, there were a total of 101 input equations and 50 output equations for each DEA run.
7. Results
- DEA was performed using a distinct linear program for each state based on that state’s input- and output-constraint equations as defined previously. Forty-three (43) DEAs were performed in total, as it was already deemed unnecessary to examine New York (NY), Maine (ME), Alaska (AK), Nebraska (NE), South Dakota (SD), Iowa (IA), and Delaware (DE). Each of these states has a maximum quantity for some output and therefore the DEA will trivially find an optimal solution at E=1. These states are however still included in the analysis of every other state, contributing their weight to the composite state.Forty-three (43) non-trivial states analyzed and twenty-two (22) states were deemed to be relatively inefficient, E<1, and twenty-one (21) were deemed to be not relatively inefficient, E=1. Seven (7) states cannot participate in this exercise owing to the limitations of DEA.
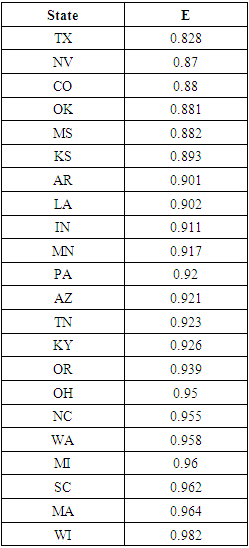
7.1. Relatively Inefficient States
- The twenty-two states deemed to be relatively inefficient are shown in Table 2, in ascending order of E. Any state that does not appear in Table 2 was identified as E=1, not relatively inefficient.
|
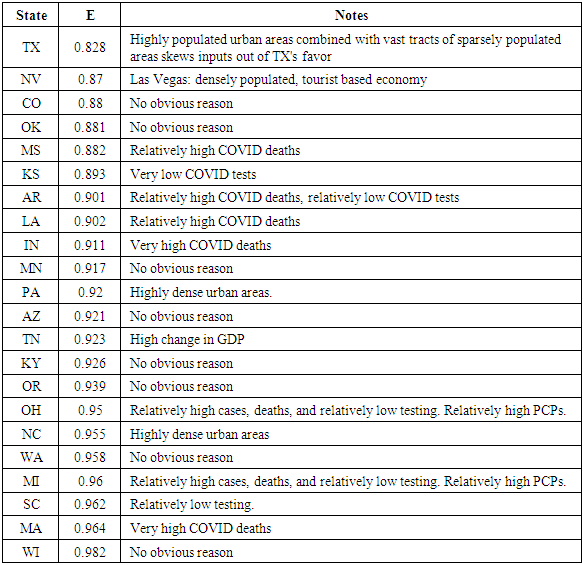
7.2. Slack/Surplus
- Slack/surplus quantities identify underutilized input and output resources. For each state where E<1, the slack or surplus of each constraint was briefly analyzed and, along with basic knowledge of U.S. geography and culture, commented upon in Table 3. For example, it is noted that Texas has highly populated urban areas (Houston, Dallas/Ft. Worth, San Antonio, Austin) which, when combined with vast tracts of sparsely populated areas, skews inputs out of Texas' favor.
|
8. Analysis
- Of the forty-three (43) non-trivial states analyzed, twenty-one (21) were deemed to be relatively efficient, E=1, and twenty-two (22) states were deemed to be relatively inefficient, E<1. This result is expected as roughly half of all states should be worse than average and half should be better. Due to the large sample size, n=50, any one state which is significantly more- or less-efficient than any other state should be averaged out and a largely normal distribution is expected. If, contrarily, it was determined that a significantly different number of states were relatively efficient versus relatively inefficient, this might indicate an error in the input/output data.Unfortunately, there do not seem to be obvious systemic inefficiencies identified by this analysis which might be able to be addressed at a federal level. The DEA indicates that it is up to each state, relatively inefficient or otherwise, to recognize, analyze, and address their own inefficiencies if the impacts of the COVID-19 pandemic are to be tempered.
9. Summary and Conclusions
- DEA has been employed to analyze each of the fifty (50) U.S. states to determine their relative inefficiencies in reacting to the SARS-CoV-2/COVID-19 pandemic which has consumed the world in 2020. The analysis described herein considered only the following variables as inputs:• Federal Funds Received• State Population• State Population Density (reciprocal)• Average Age (reciprocal)• COVID-Applicable Primary Care Physicians• Total Staffed Hospital Beds• Total ICU Beds• Total Critical Care Healthcare ProfessionalsThe analysis performed in this study considered the following variables as outputs:• Total COVID-19 Tests Performed• Total COVID-19 Cases (reciprocal)• Total COVID-19 Deaths (reciprocal)• Percent Change in State GDP (reciprocal)• Percentage Point Change in State Unemployment (reciprocal)Correspondingly, this analysis concluded that twenty-two (22) states are relatively inefficient with regards to the amount of input required to produce a given amount of output. Twenty-two (22) states represent 51.2% of the total analyzed states, which is expected by nature of DEA, as well as in a normal distribution. Moreover, twenty-one (21) states were deemed to not be relatively inefficient and an additional seven (7) states produced a maximum quantity for a given output and could not be meaningfully analyzed using DEA.The goal of this investigation was to determine if there are systemic inefficiencies at the state level contributing to the inefficiencies associated with the United States at a country level in other studies. This analysis was unable to identify a specific factor at the state levels which might be causing this anomaly. However, this study was able to discover several areas for improvement, identified by the input parameters, and measured by the output parameters, in states identified as relatively inefficient.This study is beneficial for improving medical response in future for oncoming diseases and health emergencies. Hospital administrators and state agencies will know what to look for to improve the performance of their response. Hence, the study has practical implications for the future.