| [1] | The WHOQOL Group, 1998, Development of the World Health Organization WHOQOL-BREF quality of life assessment. The WHOQOL Group, Psychol Med, 28(3), 551–558. |
| [2] | Farquhar, M., 1995, Definitions of quality of life: A taxonomy, J Adv Nurs, 22(3), 502–508. |
| [3] | van der Lippe, T., and Bäck-Wiklund, M., 2011, Quality of life and work in a changing Europe., In M. Bäck-Wiklund, T. Lippe, L. D. van der Dulk, A. Doorne-Huiskes, T. van der Lippe, and L. den Dulk (Eds.), Quality of life and work in Europe (pp. 1–13), Palgrave Macmillan, London. |
| [4] | Sirgy, M. J., 2012, The psychology of quality of life, Springer, Dordrecht. |
| [5] | Lindström, B., and Eriksson, M., 2010, A salutogenic approach to tackling health inequalities, In A. Morgan, E. Ziglio and M. Davies (Eds.), Health assets in a global context (pp. 17–39), Springer-Verlag, New York. |
| [6] | Fernández-Ballesteros, R., 2011, Quality of life in old age: Problematic issues, Appl Res Qual Life, 6(1), 21–40. |
| [7] | Cummins, R. A., 1996, The domains of life satisfaction: An attempt to order chaos, Soc Indic Res, 38(3), 303–328. |
| [8] | Cummins, R. A., McCabe, M. P., Romeo, Y., Reid, S., and Waters, L., 1997, An initial evaluation of the comprehensive quality of life scale-Intellectual disability, Int J Disabil Dev Educ, 44(1), 7-19. |
| [9] | Singh, A. B., and Tiwari, P. S. N., 2013, Factors affecting quality of life of rural population, Indian Journal of Health and Wellbeing, 4(5), 1197–1198. |
| [10] | Diener, E., and Diener, C., 1995, The wealth of nations revisited: Income and quality of life, Soc Indic Res, 36(3), 275–286. |
| [11] | Rojas, M., 2012, Quality of life in Latin America and the Caribbean. In K. C. Land, A. C. Michalos and M. J. Sirgy (Eds.), Handbook of social indicators and quality of life research (pp. 529–545), Springer, Dordrecht. |
| [12] | Egedy, T., 2012, The effects of global economic crisis in Hungary, Hungarian Geographical Bulletin, 61(2), 155–173. |
| [13] | Somarriba Arechavala, N., Zarzosa Espina, P., and Pena Trapero, B., 2015, The economic crisis and its effects on the quality of life in the European Union, Soc Indic Res, 120(2), 323–343. |
| [14] | Spyridakis, M., and Feronas, A., 2014, The impact of the economic crisis on the quality of life for residents of Attiki area. The experience from the City of Marousi, Social Cohesion and Development, 9(1), 5–28. |
| [15] | Abbott, P., and Wallace, C., 2012, Social Quality: A way to measure the quality of society, Soc Indic Res, 108(1), 153–167. |
| [16] | Mavridis, S., 2018, Greece’s economic and social transformation 2008–2017, Social Sciences, 7(1), 9. |
| [17] | International Labour Organization., 2014, Studies on growth with equity. Greece. Productive jobs for Greece, International Labour Organization, Geneva. |
| [18] | European Bank for Reconstruction and Development., 2016, Life in transition. A decade of measuring transition, European Bank for Reconstruction and Development, London. |
| [19] | Mitrakos, T. M., 2014, Inequality, poverty and social welfare in Greece: Distributional effects of austerity, J Hell Stud, 22(1), 65–94. |
| [20] | Sussan, F., and Hall, R., 2019, Quality of life determinants for retirees, In B. W. Sloboda, C., Putcha, and S., Rana (Eds.), Interacting factors between physical health, mental health, and a long quality life (pp. 294-330), Balboa Press, Bloomington. |
| [21] | Nakou, S., 2001, Measurement of quality of life in the health care field. Applications in child health, Archives of Hellenic Medicine, 18(3), 254-266 (In Greek). |
| [22] | Lehman, A. F., 1995, Measuring quality of life in a reformed health system, Health Aff, 14(3), 90-101. |
| [23] | Pandelica, A., Didea, I., and Diaconu, M., 2013, Are you panicked? Economic and health consequences of the economic crisis: A psychological approach in Romanian context, Scientific Bulletin-Economic Sciences, 12(1), 39-49. |
| [24] | European Foundation for the Improvement of Living and Working Conditions., 2013, Third European Quality of Life Survey—Quality of life in Europe: Trends 2003–2012, Publications Office of the European Union, Luxembourg. |
| [25] | Power, M., 2003, Development of a common instrument for quality of life, In A. Nosikov and C. Gudex (Eds.), EUROHIS: Developing Common Instruments for health surveys (pp. 145–163), IOS Press, Amsterdam. |
| [26] | Menard, S., 2010, Logistic regression: From introductory to advanced concepts and applications, Sage, London. |
| [27] | Miles, J., 2014, Tolerance and Variance Inflation Factor, Wiley StatsRef: Statistics Reference Online. |
| [28] | Liu, X., 2015, Applied ordinal logistic regression using STATA: From single-level to multilevel modeling, Sage, Londin. |
| [29] | Brant, R., 1990, Assessing proportionality in the proportional odds model for ordinal logistic regression, Biometrics, 46(4), 1171–1178. |
| [30] | Hilbe, J. M., 2009, Logistic regression models, CRC Press, New York. |
| [31] | Stata., 2017, Base reference manual., Stata Press, College Station, TX. |
| [32] | Lipsitz, S. R., Fitzmaurice, G. M., and Molenberghs, G., 1996, Goodness-of-fit tests for ordinal response regression models, Appl Stat, 45(2), 175–190. |
| [33] | Andreß, H-J., Golsch, K., and Schmidt, A. W., 2013, Applied panel data analysis for economic and social surveys, Springer, Berlin. |
| [34] | Putler, D. S., and Krlder, R. E., 2012, Customer and business analytics: Applied data mining for business decision making using R, CRC Press, New York. |
| [35] | Garson, G. D., 2016, Logistic regression: Binary and multinomial, Statistical Publishing Associates, Asheboro. |
| [36] | Long, J. S., 1997, Regression models for categorical and limited dependent variables, Sage, London. |
| [37] | Long, J. S., and Freese, J., 2014, Regression models for categorical dependent variables using Stata, Stata Press, College Station, TX. |
| [38] | Fagerland, M. W., and Hosmer, D. W., 2017, How to test for goodness of fit in ordinal logistic regression models, STATA J: Promoting Communications on Statistics and Stata, 17(3), 668–686. |
| [39] | Sováriová Soósová, M., 2016, Determinants of quality of life in the elderly, Central European Journal of Nursing and Midwifery, 7(3), 484–493. |
| [40] | Walker, A., and Mollenkopf, H., 2007, International and multidisciplinary perspectives on quality of life in old age. Conceptual issues, In H. Mollenkopf and A. Walker (Eds.), Quality of life in old age (pp. 3–13), Springer, Dordrecht. |
| [41] | Fodor, E., Lane, L., Schippers, J., and van der Lippe, T. (2011). Gender differences in quality of life, In M. Bäck-Wiklund, T. Lippe, L. D. van der Dulk, A. Doorne-Huiskes, T. van der Lippe, and L. den Dulk (Eds.), Quality of life and work in Europe (pp. 149-161), Palgrave Macmillan, London. |
| [42] | Mwabu, G., 2001, Health status in Africa: A regional profile, S Afr J Econ, 69(2), 319–335. |
| [43] | Dodge, R., Daly, A., Huyton, J., and Sanders, L., 2012, The challenge of defining wellbeing, International Journal of Wellbeing, 2(3), 222–235. |
| [44] | Marcum, J. A., 2008, An introductory philosophy of medicine: Humanizing modern medicine, Springer, Dordrecht. |
| [45] | Mechili, A. E., Kalokairinou, A., Kaitelidou, D., and Diomidous, M., 2015, Greece financial crisis and quality of life, In J. Mantas, A. Hasman and M. S. Househ (Eds.), Enabling health informatics applications (pp. 207-209). IOS Press, Amsterdam. |
| [46] | Ferriss, A. L., 2002, Religion and the quality of life, J Happiness Stud, 3, 199-215. |
| [47] | Koenig, H. G., 2001, Religion and medicine II: Religion, mental health, and related behaviors, Int J Psychiatry Med, 31(1), 97–109. |
| [48] | Orman, W. H., 2019, Religiosity and financial crises in the United States, J Sci Study Relig, 58(1), 20-46. |
| [49] | Goldenberg, M., Danovitch, I., and IsHak, W. W., 2014, Quality of life and smoking, Am J Addict, 23(6), 540–562. |
| [50] | Ventegodt, S., and Merrick, J., 2003, Lifestyle, quality of life, and health, The Scientific World Journal, 3, 811–825. |
| [51] | Macy, J. T., Chassin, L., and Presson, C. C., 2013, Predictors of health behaviors after the economic downturn: A longitudinal study, Soc Sci Med, 0, 8-15. |
| [52] | Beletsioti, C., Papadopoulos A., and Niakas, D., 2018, The impact of financial crisis on health and health care in Greece, Archives of Hellenic Medicine, 35(5), 686-697 (In Greek). |
| [53] | Edgerton, J. D., Roberts, L. W., and von Below, S., 2012, Education and quality of life, In K. C. Land, A. C. Michalos, and M. J. Sirgy (Eds.), Handbook of social indicators and quality of life research (pp. 265–296), Springer, Dordrecht. |
| [54] | Ferriss, A. L., 1971, Indicators of trends in the status of American women. Russell Publishing Sage Foundation, New York. |
| [55] | Raggi, A., Corso, B., Minicuci, N., Quintas, R., Sattin, D., De Torres, L., Chatterji S., Erisoni G. B., Haro J. M., Koskinen S., Martinuzzi A., Miret M., Tobiasz-Adamczyk B. and Leonardi, M., 2016, Determinants of quality of life in ageing populations: Results from a cross-sectional study in Finland, Poland and Spain, PLOS ONE, 11(7), e0159293. |
| [56] | Stansfeld, S. A., Head, J., and Marmot, M. G., 1998, Explaining social class differences in depression and well-being, Soc Psychiatry Psychiatr Epidemiol, 33(1), 1–9. |
| [57] | Drobnič, S., Beham, B., and Präg, P., 2010, Good job, good life? Working conditions and quality of life in Europe, Soc Indic Res, 99(2), 205–225. |
| [58] | Chater, S. S., 1996, The future of social security and its impact on older women, Health Care for Women Int, 17(1), vii–xiii. |
| [59] | Pukeliene, V., and Starkauskiene, V., 2011, Quality of life: Factors determining its measurement complexity, Engineering Economics, 22(2), 147–156. |
| [60] | Dahlan, A., Ibrahim, S. A. S., and Masuri, M. G., 2016, Role of the physical environment and quality of life amongst older people in institutions: A mixed methodology approach, Procedia-Soc Behav Sci, 234, 106–113. |
| [61] | Jackson, K., Pitner, R., Holschuh, J., Takahashi, R., and Waller, M., 2010, The social dimension for assessing social functioning, In J. B. Ashford and C. W. LeCroy (Eds.), Human behavior in the social environment: A multidimensional perspective (pp. 132-187), Brooks/Cole - Cengage Learning, Belmont. |
| [62] | Stewart, A. L., and King, A. C., 1994, Conceptualizing and measuring quality of life in older populations In R. P. Abeles R.P., Gift H., and Ory M. G. (Eds.). Aging and quality of life (pp. 27–54), Springer Publishing Company, New York. |
| [63] | Wrosch, C., and Scheier, M. F., 2003, Personality and quality of life: The importance of optimism and goal adjustment, Qual Life Res, 12 (Suppl. 1), 59–72. |
| [64] | Rokicka, E., 2014, The concept of “quality of life” in the context of economic performance and social progress, In D. Eißel, E., Rokicka, and J., Leaman (Eds.) Welfare state at risk (pp. 11-34), Springer, Berlin. |
| [65] | Panas, E. E., 2013, Homeorhesis and indication of association between different types of capital on life satisfaction: The case of Greeks under crisis, Soc Indic Res, 110, 171-186. |
| [66] | Papanastasiou, S., and Papatheodorou, C., 2018, The Greek depression: Poverty outcomes and welfare responses, J Econ Bus, XXI, Nos 1-2, 205-222. |
| [67] | Zavras, D., Tsiantou, V., Pavi, E., Mylona, E., and Kyriopoulos, J., 2012, Impact of economic crisis and other demographic and socio-economic factors on self-rated health in Greece, Eur J Public Health, 23(2), 206-210. |
| [68] | Hotchkiss, D. R., and Jacobalis, S., 1999, Indonesian health care and the economic crisis: Is managed care the needed reform? Health Policy, 46, 195-216. |
| [69] | Costanza, R., Fisher, B., Ali, S., Beer, C., Bond, L., Boumans, R., Danigelis, N. L., Dickinson, J., Elliott, C., Farley, J., Elliott Gayer, D., MacDonald Glenn, L, Hudspeth, T. R., Mahoney, D. F., McCahill, L, McIntosh, B, Reed, B, Turab Rizvi, A., Rizzo, D. M., Simpatico, T., and Snapp, R., 2008, An integrative approach to quality of life measurement, research, and policy, S.A.P.I.E.N.S, 1(1), 17-21. |
| [70] | De Negri Filho, A., 2008, A human rights approach to quality of life and health: Applications to public health programming, Health Hum Rights, 10(1), 93-101. |
| [71] | Kokaliari, E., 2018, Quality of life, anxiety, depression, and stress among adults in Greece following the global financial crisis, International Social Work, 61(3), 410-424. |
| [72] | Mitrakos, T., 2013, Inequality, poverty and living conditions in Greece: Recent developments and prospects, Social Cohesion and Development, 8(1), 37–58. [75] Todaro, M. P., and Smith, S. C., 2015, Economic development, Pearson, New York. |
| [73] | Todaro, M. P., and Smith, S. C., 2015, Economic development, Pearson: Boston. |
| [74] | Rauschmayer, F., Omann, I., and Frühmann, J., 2011, Needs, capabilities and quality of life. Refocusing sustainable development In F. Rauschmayer, I. Omann, and J. Frühman (Eds.) Sustainable development, capabilities, needs, and well-being (pp. 1-24), Routledge: London. |
| [75] | Costanza, R., Farley, J., and Templet, P., 2002, Quality of life and the distribution of wealth and resources, in R. Costanza, and S. E. Jørgensen (Eds.) Understanding and solving environmental problems in the 21th century (pp. 221-258). |
| [76] | Alborz, A., 2017, The nature of quality of life: A conceptual model to inform assessment, J Policy Pract Intellect Disabil, 14(1), 15-30. |

 Abstract
 Reference
 Full-Text PDF
 Full-text HTML


 is the
  found when all other predictors are regressed onto the predictor
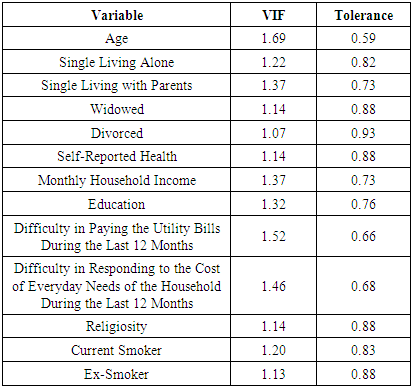
  . The reciprocal of the VIF is called the Tolerance. The VIF should not be greater than 10 and the Tolerance should not be less than 0.1 [27]. The proportional odds assumption states that each predictor has the same effects across the categories of the ordinal outcome variable, i.e., the logit regression coefficients for each predictor are the same across the ordinal categories [28]. Proportionality of odds was tested through the Brant test [29]. To test the proportionality of odds, Brant proposed an approach based on viewing the augmented model as describing a set of
  logistic regressions, for variables
  defined by:
 is a response variable with
  categories. The overall Brant test statistic is distributed as
  with
with  degrees of freedom where
  is the number of predictors, while the Brant test statistic for each predictor is distributed as a
  with
with  degrees of freedom. The assumption of the linearity of the logit with respect to the model predictors was tested through the Link Test. If
  is the model, where
  are the predictors and
  the parameter estimates, the Link Test calculates the variables
  and
and  . The model is then refitted with these two variables. If the model is specified correctly, the
  would be non-significant [30,31]. In addition, the goodness of fit of the ordinal logistic regression model was tested through Lipsitz et al.’s goodness of fit test [32]. Considering the proportional logit model:
 Lipsitz et al.’s goodness of fit test is based on scores
  assigned to each response category
  Then the predicted mean score is calculated as:
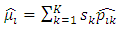
 are the predicted probabilities. The observations are then partitioned into
  groups based on the percentiles of the predicted mean score
  Given the partition of the data,
  indicator variables are then created, such that:
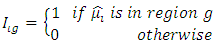
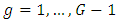 . To assess the goodness of fit, an alternative model is considered as follows:
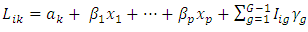
 In addition, if the model is correctly specified, the likelihood ratio statistic
  where
where  and
and  are the log likelihoods of models 3 and 6, is distributed as
  with
with  degrees of freedom. Furthermore, pseudo
  coefficients were calculated, specifically, McFadden’s
  and Nagelkerke’s
  . McFadden’s
  indicates a low fit,
  around
  indicates an acceptable fit,
  indicates a very good fit, and
  is hardly observed [33,34]. With respect to Nagelkerke’s
  , a rule of thumb is to consider values between 0 and 0.3 as weak, values between 0.3 and 0.6 as moderate, and values higher than 0.6 as strong. However, because pseudo
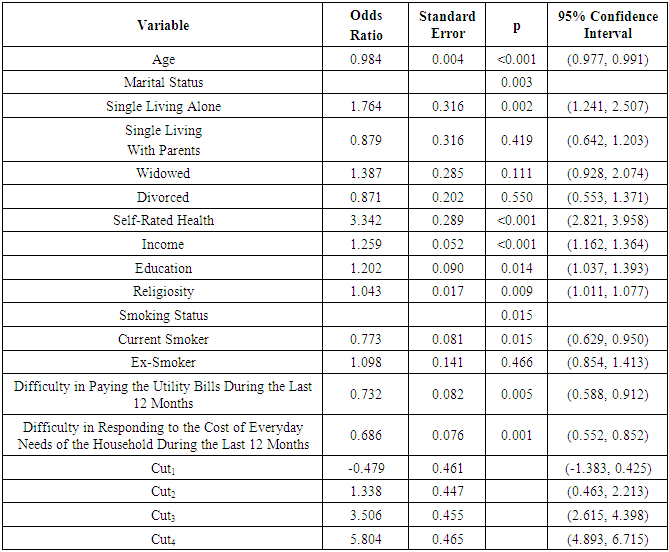
  coefficients are not “percent of variance explained” measures, they must be interpreted simply as having a weak, moderate, or strong effect size for the model in question [35]. Thus, no one measure is clearly superior and none has the advantages of a clear interpretation in terms of explained variation [36]. The independent variables that were used in the analysis are shown in Table 1.
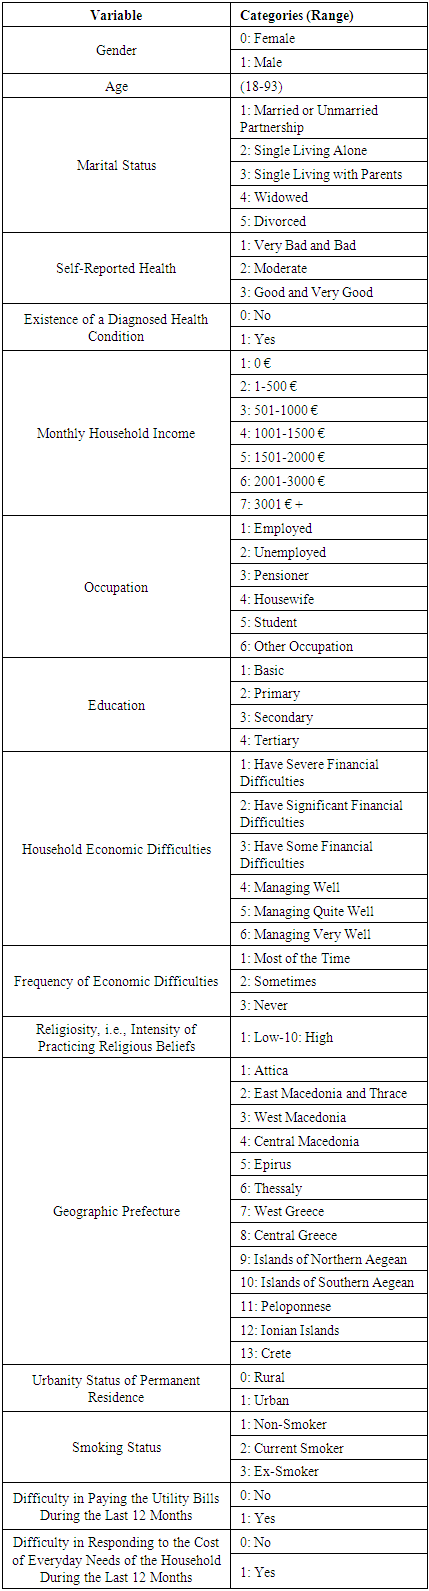
 (42.69, 39) p=0.315), the proportionality of odds assumption is valid. Based on the Link Test [30,31] (Table 5), the model is correctly specified, meaning that there is a linear relationship between the logit and the predictors.
 (5.396, 9) p=0.799), the model has a good fit. However, although, McFadden’s
  was found to be equal to 0.11, indicating an acceptable fit, Nagelkerke’s
  was found to be equal to 0.27 indicating a weak effect size. Because financial security has been found to have a great impact on wellness and QoL, the results of this study confirm the international bibliography [58].