-
Paper Information
- Paper Submission
-
Journal Information
- About This Journal
- Editorial Board
- Current Issue
- Archive
- Author Guidelines
- Contact Us
International Journal of Internal Medicine
p-ISSN: 2326-1064 e-ISSN: 2326-1072
2017; 6(1): 1-9
doi:10.5923/j.ijim.20170601.01

Relationships between Adiponectin, Osteocalcin and Insulin Resistance in Obese Egyptian Individuals: A Link between Skeleton, Obesity and Insulin Resistance
 Abstract
 Reference
 Full-Text PDF
 Full-text HTML
Ahmed A. Khoreba1, El-Sayed El-Meghawary El-Sayed2, Ahmed Salama Al Adl2, Mahmoud Saad Berengy2, Mekky A. Ali3
1Internal Medicine Department, Al-Azhar University, Faculty of Medicine, Cairo, Egypt
2Internal Medicine Department, Al-Azhar University, Faculty of Medicine, Damietta, Egypt
3Clinical Pathology Department, Al-Azhar University, Faculty of Medicine, Damietta, Egypt
Correspondence to: Ahmed Salama Al Adl, Internal Medicine Department, Al-Azhar University, Faculty of Medicine, Damietta, Egypt.
| Email: |  |
Copyright © 2017 Scientific & Academic Publishing. All Rights Reserved.
This work is licensed under the Creative Commons Attribution International License (CC BY).
http://creativecommons.org/licenses/by/4.0/

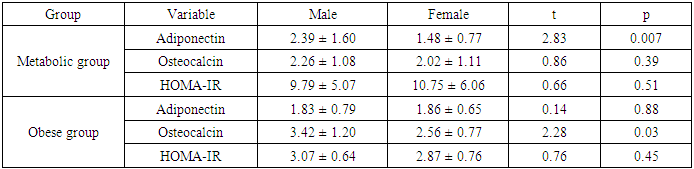
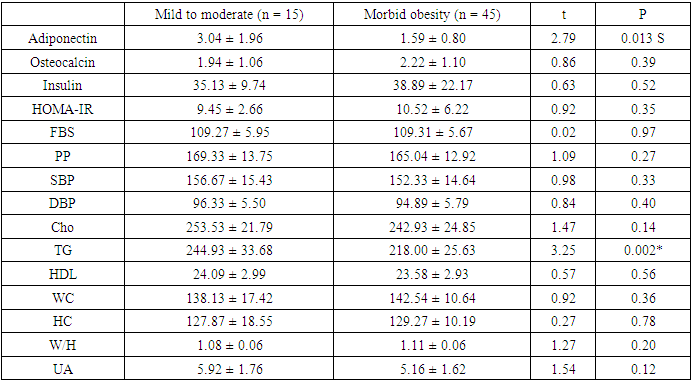
Background: Scientific interest has focused on the association between osteocalcin, ( which originates from the skeletal system) and glucose metabolism. Although the association between lipid metabolism, adiponectin, and metabolic syndrome is well known, that between obesity, insulin resistance, and osteocalcin has not been clarified yet. Aim of the work: assessment of insulin resistance in Egyptian obese persons, and to identify whether or not there is a difference between patients with or without metabolic syndrome in respect to osteocalcin and adiponectin levels and the relation of both cytokines to different parameters of metabolic syndrome. Patients and methods: This study was done at Al-Azhar University Hospital (New Damietta), Internal Medicine Department, in the period from February 2014, to October 2014, sixty obese patients (31 male and 29 female), with criteria of metabolic syndrome (group I); and thirty obese persons (16 male and 14 female) without criteria of metabolic syndrome (Group II) and thirty normal healthy volunteers (17 male and 13 female) (Control group). Patients and controls were submitted to full history taking; thorough clinical examination, waist circumference (WC), and BMI were calculated. Laboratory investigations included (serum adiponectin; serum osteocalcin; lipid profile; fasting & postprandial blood sugar, fasting insulin and HOMA-IR) were calculated. Results: When comparing metabolic syndrome group with control group, there was a statistically significant difference in all studied variables except for total bilirubin and creatinine. In metabolic syndrome group, there was a statistically significant increase of adiponectin in males when compared to females; but osteocalcin and HOMA-IR had no statistically significant difference. In obese group, there was only significant increase of osteocalcin in males when compared to females. In addition, among metabolic group; morbid obese patients had statistically significantly decreased levels of adiponectin and triglycerides when compared to mild to moderate obese patients. There was negative, mild, statistically significant correlation between uric acid and osteocalcin. And there was positive, moderate, significant correlation between adiponectin and height; while there was negative, moderate, significant correlation between adiponectin and BMI. On the other hand, in obese group; there was significant, moderate, positive correlation between osteocalcin and each of albumin and ESR; but no statistically significant correlation between adiponectin and any other variables in this group. Conclusion: Serum levels of adiponectin and osteocalcin were decreased in subjects with metabolic syndrome as well as obese subjects without criteria of metabolic syndrome. In addition, serum adiponectin and serum osteocalcin were negatively correlated with parameters of metabolic syndrome. The association of osteocalcin and adiponectin with the metabolic syndrome and atherosclerosis supports the reciprocal regulation of bone on energy metabolism, implicating that osteocalcin and adiponectin might be a new therapeutic target for the treatment of metabolic syndrome and obesity and even the associated cardiovascular complications.
Keywords: Adiponectin, Osteocalcin, Insulin resistance, Obesity
Cite this paper: Ahmed A. Khoreba, El-Sayed El-Meghawary El-Sayed, Ahmed Salama Al Adl, Mahmoud Saad Berengy, Mekky A. Ali, Relationships between Adiponectin, Osteocalcin and Insulin Resistance in Obese Egyptian Individuals: A Link between Skeleton, Obesity and Insulin Resistance, International Journal of Internal Medicine, Vol. 6 No. 1, 2017, pp. 1-9. doi: 10.5923/j.ijim.20170601.01.
Article Outline
1. Introduction
- Adipose Tissue which acts as an endocrine tissue plays an important role in the regulation of insulin sensitivity both in adipocytes and other tissue [1]. Studies have emphasized the fact that adiponectin, which is secreted from the adipose tissue increases insulin sensitivity and is remarkably low in patients with metabolic syndrome [2]. The presumed protective effect of obesity on osteoporosis has urged researchers to think about the presence of hormones that affect both the bones and energy metabolism; Studies showed that osteocalcin, which is secreted from osteoblasts increased insulin secretion as well as insulin sensitivity [3]. Lee et al. 2007 [4] demonstrated that osteocalcin is involved in glucose metabolism by increasing insulin secretion and cell proliferation in pancreatic B-cells and by up regulating the expression of the adiponectin gene in adipocytes, thus improving insulin sensitivity. In addition other study had shown an association between low osteocalcin and insulin resistance. Also, it has been reported that the skeletal system also plays a role in the regulation of energy and glucose metabolism [5]. In contrast, it is not known that, osteocalcin has a role in improved insulin sensitivity associated with plasma adiponectin levels. Hwang et al. 2012 [6] reported that the circulated osteocalcin levels associated with improved glucose tolerance and insulin secretion and also increase sensitivity independent of plasma adiponectin level. So, the association between obesity, insulin resistance, adiponectin and osteocalcin as well as the interaction between osteocalcin and adiponectin in need to be elucidated.
2. Aim of the Work
- The aim of this study is assessment of the insulin resistance in Egyptian obese persons, and to identify whether or not there is a difference between patients with or without metabolic syndrome with respect to osteocalcin and adiponectin levels and the relation of both cytokines to different parameters of metabolic syndrome.
3. Patients and Methods
3.1. Study Designs
- This study was done at Al-Azhar University Hospital (New Damietta), Internal Medicine Department, in the period from February 2014, to October 2014. The patients enrolled in this study were selected from inpatient and outpatient clinic of internal medicine department. A sixty (60) obese patients (31 male and 29 female), with criteria suggestive of metabolic syndrome (group I); and thirty (30) obese persons (16 male and 14 female) without criteria of metabolic syndrome (Group II) and thirty (30) normal healthy volunteers (17 male and 13 female) (Control group).
3.2. Ethical Aspects
- The informed consent was obtained from all participants. The research protocol did not interfere with any medical recommendations or prescriptions.
3.3. Inclusion Criteria
- Obese patients with criteria of metabolic syndrome and obese persons without criteria of metabolic syndrome Metabolic syndrome was defined according the following criteria: abdominal obesity (defined by waist circumference >102 cm in males and > 88 cm in females), in addition to two or more of the following: (Hypertriglyceridemia >150mg/dl and low HDL-c: <40 mg/dL in men and <50 mg/dL in women; high blood pressure; systolic pressure >130 or diastolic pressure >85mmHg; fasting blood glucose >100 mg/dl and < 126 mg/dl, post prandial blood glucose <200 mg/dl) [36].
3.4. Exclusion Criteria
- Presence of any concomitant systemic illness (DM, CKD, Thyroid disease, MBD, Hepatic disease), patients on any medications that affect glucose and bone metabolism, such as metformin, glucocorticoids or bisphosphonate; presence of acute illness and recent trauma, Frank Diabetics were excluded from this study.
3.5. Study Protocol
- Patients and controls were submitted to full history taking, thorough clinical examination, waist circumference (WC), weight and height were measured and BMI was calculated. Blood pressure was measured and laboratory investigations included (Serum adiponectin; serum osteocalcin concentrations were determined by immuno-enzymetric assay for the in vitro quantitative measurement of intact human osteocalcin; lipid profile; fasting & post prandial blood sugar, fasting insulin) and HOMA-IR was calculated as international formula, fasting blood sugar (mmol/L)x fasting serum insulin (μUI/ml) / 22.5 [7] Weight was measured while subjects were minimally clothed without Shoes using digital scales and recorded to the nearest 100 g. Height was measured in a standing position without shoes, using a tape meter while the shoulders were in a normal alignment [8]. Body mass index (BMI) was calculated as weight (kg) divided by square height (m2). Waist circumference was taken as the minimum circumference at umbilicus level and hip circumference as the maximum circumference at the symphysis of pubis level using non stretched tape meter without any pressure to the body surface and was recorded to the nearest 0.1 cm. [9]. Subjects rested for 15 min, following which blood pressure was measured twice in a seated position using a standard mercury sphygmomanometer; and the mean of the two measurements was considered the participant's blood pressure.
3.6. Statistical Methodology
- The data were processed and analyzed using the statistical package for social sciences (SPSS) 17.0 program. Quantitative variables were presented in the form of Mean and Stander Deviation (mean±SD), while Qualitative variables presented by relative frequency and percentage. Chi-square test was used to compare qualitative variables between groups. Unpaired t-test was used to compare quantitative variables, in parametric data. Sensitivity, specificity, positive predictive value (PPV), negative predictive value (NPV) and overall accuracy were calculated and significance level (P) value was expressed as follows: P >0.05 (Insignificant); P<0.05 (Significant); and P<0.01 (High significant).
4. Results
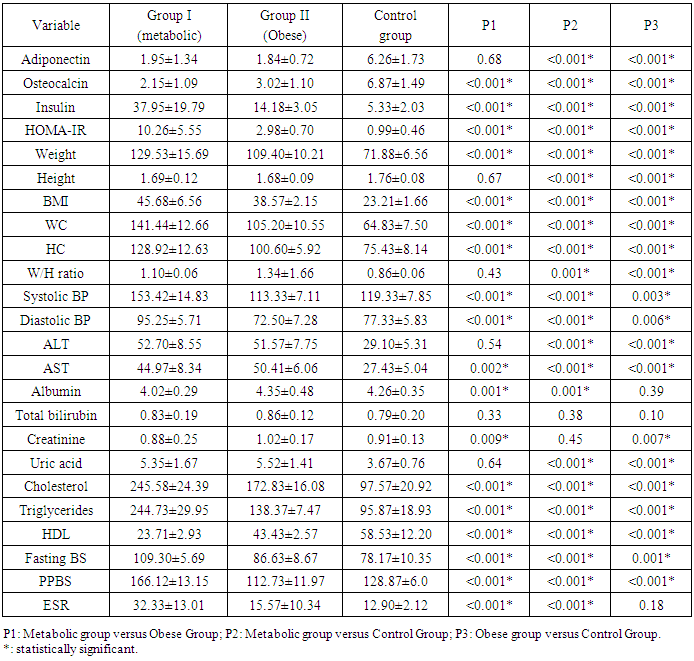
- Results of the present study were presented in tables (1) to (5). Comparing metabolic syndrome group versus obese groups; there were statistically significant differences in all studied variables except for adiponectin, height; W/H ratio, ALT, total bilirubin or uric acid. In addition, when comparing metabolic syndrome group with control group, there were statistically significant differences in all studied variables except for total bilirubin and creatinine; and when comparing obese group with control group, there were statistically significant difference between both groups for all studied variables except for albumin, total bilirubin and erythrocyte sedimentation rate (ESR) (table 1).
|
|
|
|
|
5. Discussion
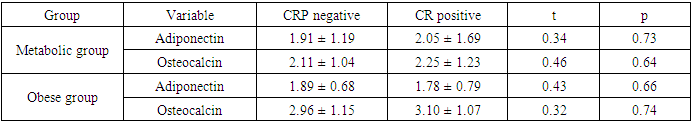
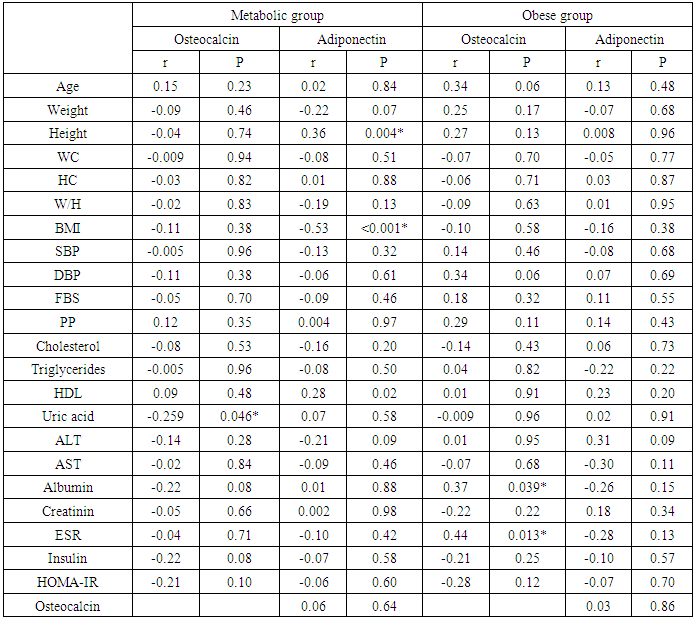
- Scientific interest has focused on the association between osteocalcin, which originates from the skeletal system, and glucose metabolism. Although the association between lipid metabolism, adiponectin, and metabolic syndrome is well known, that between obesity, insulin resistance, and osteocalcin have not been clarified yet [10]. The present study was designed to assess the insulin resistance in Egyptian obese persons, and to identify whether or not there is a difference between patients with or without metabolic syndrome with respect to osteocalcin and adiponectin levels and the relation of both cytokines to different parameters of metabolic syndrome.In the present study there was statistically significant decreased serum adiponectin (1.95 ± 1.34) in metabolic syndrome group as well as Obese group (1.84±0.72) in comparison to control group, While there was no statistical significance of metabolic syndrome group in comparison to obese group (P1 = 0.680). This is in agreement with Jeffery et al. 2008 [2] who reported that adiponectin, which is secreted from the adipose tissue and is known to increase insulin sensitivity, is found in remarkably low concentrations in patients with metabolic syndrome. It has been shown that adiponectin in vivo improves insulin resistance in many tissues. On the other hand Hung et al. 2008 [11] showed that low circulating levels of adiponectin; particularly of the high molecular weight (HMW) component are also a strong risk marker for the development of the metabolic syndrome and type-2 diabetes. In addition, Han et al. 2010 [8] reported that hypoadiponectinaemia is associated with obesity, insulin resistance and type-2 diabetes as well as atherosclerosis, hypertension and coronary artery disease. Also, Magge et al. 2011 [12] founded that adiponectin levels were significantly lower in obese persons. It has been well documented that adiponectin is positively associated with HDL, whereas it is negatively associated with TG.In the present work, there was statistically significant decreased serum osteocalcin (2.15±1.09) in metabolic syndrome group as well as Obese group (3.02±1.10) in comparison to control group, Also there was a statistical significance decrease of serum osteocalcin in metabolic syndrome group in comparison to obese group (P1 = 0.001). This is comparable to Bao et al. 2011 [13] who reported that serum osteocalcin concentration in metabolic syndrome patients was significantly decreased than in control group. Bao et al. 2011 [13] also added that, subjects with MS had serum osteocalcin concentrations ranged from 5.34 to 53.67 ng/ ml; serum osteocalcin in metabolic syndrome patients was significantly lower than in control group. In addition, our findings in agreement with, Bae et al. 2011 [29] who reported that, subjects with MS had significantly lower levels of serum osteocalcin, serum osteocalcin levels further decreased as the numbers of MS components increased. On the other hand, Kindblom et al. 2009 [14] revealed that plasma osteocalcin level was significantly and negatively associated with weight, BMI and fat mass. In the present study there was statistically significant increased serum insulin (37.95±19.79) and HOMA IR (10.26±5.55) in metabolic syndrome group in comparison to control group as well as there was statistically significant increased serum insulin (14.18±3.05) and HOMA IR (2.98±0.70) in obese group in comparison to control group. Also, there was a statistically significant increase of serum insulin and HOMA IR in metabolic syndrome group in comparison to obese group. This is in agreement with Bao et al. 2011 [13] who reported that, subjects with MS had significantly higher serum insulin and higher HOMA IR. In addition, Han et al. 2010 [8] reported that hypoadiponectinaemia is associated with obesity, insulin resistance and type-2 diabetes as well as atherosclerosis, hypertension and coronary artery disease. Also, Goran et al. 2008 [15] reported that occurrence of obesity was higher in adolescence leading to development of insulin resistance and the duration of obesity was independent risk factor for the development of type-2 DM. Furthermore, Qatanani and Lazar 2007 [16] revealed that obesity showed potential to develop insulin resistance in people having higher levels of insulin, obesity associated insulin resistance was the major risk factor for development of multiple diseases including type-2 DM and cardiovascular diseases. Finally, it was proposed that disturbed insulin sensitivity in obese has an important role in the progression of pathogenesis of obesity related insulin resistance [17]. In the present work, there were statistically significant increased body weight (129.53± 15.69), height (1.69±0.12), BMI (45.68±6.56), waist circumference (141.44±12.66), hip circumference (128.92±12.63), waist/hip ratio (1.10± 0.06) in metabolic syndrome group in comparison to control group and there were statistical significant increase of body weight (109.40±10.21), height (1.68±0.09), BMI (38.57±2.15), waist circumference (105.20±10.55), hip circumference (100.60±5.92), waist/hip ratio (1.34±1.66) in obese group in comparison to control group, Also there was statistical significance increase of weight, BMI, waist circumference, hip circumference in metabolic syndrome group in comparison to obese group. These results were in agreement with Bao et al. 2011 [13] who reported that, subjects with the MS had significantly higher BMI, waist circumference, hip circumference, and waist/hip ratio. On the other hand Zhou et al. 2009 [18] reported that there was statistical significant elevation in height, weight, BMI, waist circumference, hip circumference, W/H in patient with metabolic syndrome.In the present study, there were statistically significant increased systolic blood pressure (153.42± 14.83), diastolic blood pressure (95.25±5.71), elevated fasting blood sugar (109.30± 5.69) & postprandial blood sugar (166.12±13.15) in metabolic syndrome group as well as in Obese group there were statistical significance increased of systolic blood pressure (113.33±7.11), diastolic blood pressure (72.50±7.28), fasting blood sugar (86.63 ± 8.67) & post prandial blood sugar (112.73±11.97) in comparison to control group, Also there was statistical significance increased of systolic blood pressure, diastolic blood pressure, fasting blood sugar, & postprandial blood sugar of metabolic syndrome group in comparison to obese group. These results were in agreement with Bao et al. 2011 [13] who reported that, subjects with the MS had significantly higher systolic and diastolic blood pressure. In addition, it had been reported that, insulin directly stimulates the calcium pump in insulin sensitive tissues and promotes calcium loss from the cell, and raising cytosolic calcium levels. If a cell is resistant to insulin, the insulin-induced calcium loss from the cells would be decreased, and in vascular smooth muscle cells the resultant increase in intracellular calcium would enhance responsiveness to vasoconstrictors and increase blood pressure [19]. There were statistically significant elevated serum cholesterol (245.58±24.39), serum triglycerides (224.73±29.95), ALT (52.70±8.55), AST (44.97±8.34) and significant decreased of HDL (23.71±2.93) in metabolic syndrome group in comparison to control group as well as in Obese group there were statistically significance increase of serum cholesterol (172.83± 16.08) serum triglycerides (138.37±7.47), ALT (51.57±7.75), AST (50.41±6.06) and statistically significant decreased of HDL(43.43±2.57) in comparison to control group, Also there were statistical significance increase of serum cholesterol, triglycerides, ALT, AST and statistically significant decreased HDL of metabolic syndrome group in comparison to obese group. This is in agreement with Zhou et al. 2009 [18] who reported that there was statistically significant elevated lipid profile (serum cholesterol, TG) and showed that Men had significantly higher than women in patient with metabolic syndrome when compared to control group. In addition, Bao et al. 2011 [13] reported that, subjects with MS had significantly lower HDL levels. Also, Kyung et al. 2005 [20] founded that the metabolic syndrome is an important cause of elevated ALT concentrations in adolescents and they reported that risks for elevated ALT increase with the components of the metabolic syndrome. They also reported that hyperlipidemia, especially elevated triacylglycerol concentrations, is a primary risk factor for NAFLD, and is also an outcome of NAFLD. They also found that high triacylglycerol concentrations, as well as low HDL-cholesterol, high total cholesterol, or high LDL-cholesterol concentrations, were significantly associated with elevated ALT in the subjects. There were statistically significant elevated serum uric acid (5.35±1.67), CRP levels [17 (28.3%)] and ESR (32.33±13.01) in metabolic syndrome group in comparison to control group. In obese group there were statistically significant elevated serum uric acid (5.52±1.41), CRP levels [13 (43.3%)] in comparison to control group, While there was a statistical significance increase of ESR in metabolic syndrome group in comparison to obese group (P1 < 0.001) but there were no statistical significant difference as regard CRP (P1 = 0.155) and Uric acid (P1 = 0.641). This is in agreement with Nakanishi et al. 2010 [21] who reported that uric acid may have a pathogenic role in metabolic syndrome; Hyperuricemia is also commonly observed in metabolic syndrome and obese subjects. Also Nakanishi et al. 2010 [21] reported that hyperuricemia has been found to predict the development of both obesity and type-2 diabetes, as well as in secondary insulin resistance syndromes such as that associated with gout, diuretic usage, or preeclampsia. In addition, Facchini et al. 2011 [22] founded that hyperuricemia in metabolic syndrome to be the consequence of elevated serum insulin levels, which have been shown to stimulate renal reabsorption of uric acid, Consistent with this observation is the finding that thiazolidinediones, which improve insulin sensitivity and lower insulin levels, also reduce the level of serum uric acid in diabetic patients. On the other hand Nakanishi et al. 2010 [21] reported that decreasing uric acid with either a xanthine oxidase inhibitor or a uricosuric agent also improves insulin sensitivity as well as other features of metabolic syndrome, including hypertension, obesity, and hyper-triglyceridemia. In addition, Martin et al. 2008 [23] reported that relations of CRP and features of the metabolic syndrome suggest that inflammation is strongly associated with insulin resistance and the MS, and it supports the hypothesis that inflammation plays an important role in the pathogenesis of diabetes and atherosclerosis. Furthermore, Onat et al., 2011 [24] reported that ESR and leukocyte counts were found to be significantly higher in the MS compared with the control group, pointing to an elevated inflammatory response. This is in agreement with Youd et al. 2010 [25] who suggested that there is An important link between these conditions and obesity could be the proinflammatory cytokines produced by adipose tissue, such as tumor necrosis factor-α and interleukin-6. These cytokines can influence insulin resistance and glucose uptake promotes hepatic fatty acid synthesis, and increase hepatic CRP production. In this study there were statistically significant negative correlation between serum adiponectin levels and weight, BMI, systolic blood pressure, diastolic blood pressure, waist circumference, waist to hip ratio, cholesterol, TG, serum insulin and HOMA-IR in metabolic syndrome group this in agreement with Magge et al. 2011 [12] who showed that adiponectin levels were negatively correlated with insulin and HOMA-IR values. In addition, Riestra et al. 2011 [26] reported a negative correlation between adiponectin and fasting insulin levels, and an inverse relationship between adiponectin and TG levels. Also in the present study, there were negative correlation between osteocalcin levels and systolic blood pressure, diastolic blood pressure, height, WC, uric acid, Cholesterol, TG, FBS, ESR, serum insulin, HOMA IR in MS group. This is in agreement with Bao et al., 2011 [13] who investigate the relationship between serum osteocalcin levels and biochemical parameters that revels serum osteocalcin was negatively correlated with systolic and diastolic BP, waist circumference, FPG, and positively correlated with HDL. In addition, Chen et al. 2013 [27] reported that, serum osteocalcin correlated negatively with ALT, fasting plasma glucose and positively with, waist hip ratio, HDL cholesterol. Tan et al. 2011 [28] reported a negative relationship between serum osteocalcin and the presence of the metabolic syndrome.The inverse association of serum osteocalcin levels with MS was independent of the presence of glucose metabolism abnormalities (e.g., diabetes) or fasting glucose levels [29]. In addition Saleem et al., 2010 [30] reported that the relationship between serum osteocalcin and the MS in different ethnic groups’ serum osteocalcin was associated with the presence of the MS in either blacks or non Hispanic whites. On the other hand Yeap et al. 2010 [31] found that reduced serum osteocalcin was associated with increased risk of having the MS in older men. They also observed the inverse correlation of serum osteocalcin with adiposity, blood glucose, insulin resistance and triglycerides, as found in the present study. In contrast to our finding, Chen et al 2013 [27] reported that serum osteocalcin correlated positively with triglycerides and total cholesterol, It is well established that elevated serum cholesterol was an independent risk factor for development of cardiovascular disease also serum osteocalcin levels were significantly associated with C-reactive protein and total cholesterol levels. In the present work, there were a statistically significant negative correlation between serum adiponectin levels and weight, BMI, waist circumference, waist to hip ratio, serum insulin and HOMA in Obese group. This is in agreement with Baratta et al 2008 [32] who reported that plasma adiponectin was significantly higher in non-obese than in obese individuals, However, adiponectin have a negative correlation with BMI, waist circumference, and waist to hip ratio (WHR). In addition, Weyer et al. 2001 [33] founded that, adiponectin is now considered a marker of insulin sensitivity, and plasma concentrations of adiponectin correlate negatively with insulin resistance in obese subjects.There were a statistically significant negative correlation between serum Osteocalcin levels and weight, BMI, waist circumference, waist to hip ratio, serum insulin and HOMA-IR in Obese group. Bao et al. 2011 [13] investigated the relationship between serum osteocalcin levels and anthropometric and biochemical parameters. The analysis demonstrated that serum osteocalcin was inversely correlated with BMI, waist circumference and HOMA-IR. There was no statistically significant correlation between serum adiponectin and osteocalcin levels in metabolic syndrome group and obese group. This was comparable to Rochefort et al. 2011 [34] who reported that there is no significant correlation between adiponectin and ostecalcin levels, Also Reinehr and Roth 2010 [35] failed to show such an association between adiponectin and osteocalcin. Furthermore, Hwang et al. 2012 [6] was reported that the circulating osteocalcin level was associated with improved glucose tolerance and insulin secretion; this was independent of the plasma adiponectin level.
6. Conclusions
- The present study revealed that serum levels of adiponectin and osteocalcin were decreased in subjects with metabolic syndrome as well as obese subjects without criteria of metabolic syndrome. In addition, serum adiponectin and serum osteocalcin were negatively correlated with parameters of metabolic syndrome. The association of osteocalcin and adiponectin with the metabolic syndrome and atherosclerosis supports the reciprocal regulation of bone on energy metabolism, implicating that osteocalcin and adiponectin might be a new therapeutic target for the treatment of metabolic syndrome and obesity and even the associated cardiovascular complications.
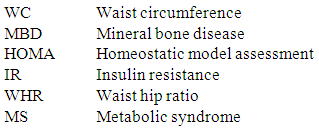
Abbreviations