-
Paper Information
- Paper Submission
-
Journal Information
- About This Journal
- Editorial Board
- Current Issue
- Archive
- Author Guidelines
- Contact Us
International Journal of Internal Medicine
p-ISSN: 2326-1064 e-ISSN: 2326-1072
2015; 4(2): 26-41
doi:10.5923/j.ijim.20150402.02

Prevalence of HCV Genotypes and Viral Load in Saudi Arabia
 Abstract
 Reference
 Full-Text PDF
 Full-text HTML
Rasha M. Al Zayed1, Nouha M. Hamdy2, Hisham H. Al-Ajlan3, Nagwa M. Aref4
1Medical Microbiology Department, AlJouf University, College of Science, Biology Department, Saudi Arabia
2Clinical Pathology Department, Faculty of Medicine (for girls), Al-Azhar University, Cairo, Egypt
3Medical Microbiology, King Saud University, Prince Sultan Military Medical City (PSMMC), Saudi Arabia
4Botany and Microbiology Department, Faculty of Science, King Saud University (KSU), Kingdom of Saudi Arabia
Correspondence to: Nagwa M. Aref, Botany and Microbiology Department, Faculty of Science, King Saud University (KSU), Kingdom of Saudi Arabia.
| Email: |  |
Copyright © 2015 Scientific & Academic Publishing. All Rights Reserved.
This work is licensed under the Creative Commons Attribution International License (CC BY).
http://creativecommons.org/licenses/by/4.0/

Genotyping is considered an important tool for epidemiological and clinical studies. The biological differences between genotypes make genotyping important for decision-making regarding disease management and therapeutic intervention. Hepatitis C virus (HCV) shows a remarkable genetic diversity, contributing to its high persistence and varied susceptibilities to antiviral treatment. Nowadays, there is not enough conducted database in Saudi Arabia for having correlated pre-treatment viral load with HCV genotypes. Therefore, this study was performed to identify the prevalence of different HCV genotypes/Subtypes and pre-treatment HCV RNA viral load in HCV infected patients from selected areas of Saudi Arabia. The aim of the study is to assess Real-Time PCR as a predictor variant for a good understanding correlation between HCV genotypes prevalence, which is required for boasting improved, and sustained virological response (SVR). Data of this study was tested for correlation between HCV RNA serum levels before and after medication. First data of viral load values in IU/ml was associated with Saudi patients who had (low-SVR.VL1). These were estimated for each HCV patients for all genotypes not less than 12 days and not more than 392 days after having the second data of viral load. There was no significant association between the responses to treatment and age and gender in genotype 1, 2, 3 and mixed. However, there was a significant association between genotype 4 in female gender (P-value=0.012) and treatment response. There was a strong positive correlation in genotype 4 patients between viral loads in low-SVR.VL1 and SVR.VL2 (r=0.636 p=0.00). In addition, there was a strong positive correlation in genotype 1 between viral loads in low-SVR.VL1 and SVR.VL2 (r=0.749 p=0.00).
Keywords: Hepatitis C virus (HCV), Genotyping, Sustained Virology Response (SVR), Viral load, Saudi Arabia
Cite this paper: Rasha M. Al Zayed, Nouha M. Hamdy, Hisham H. Al-Ajlan, Nagwa M. Aref, Prevalence of HCV Genotypes and Viral Load in Saudi Arabia, International Journal of Internal Medicine, Vol. 4 No. 2, 2015, pp. 26-41. doi: 10.5923/j.ijim.20150402.02.
Article Outline
1. Introduction
- Hepatitis C virus (HCV) infection is the leading cause for chronic liver disease. It has a wide population specific genotype variability. Genotype knowledge and viral load assessment are equally important for designing therapeutic strategies and as predictors of treatment outcome among HCV infected patients [1]. Prevalence of viral genotypes has been documented in three different patterns to date [2]. First pattern differentiates by high genetic heterogeneity and involves different geographical regions of West Africa with types 1 and 2 [3], Central Africa with type 4 [4] and Asia with types 3 and 6 [5]. Second pattern entails regions with few subtypes circulating in intravenous drugs abusers groups, e.g., subtype 3a [6]. The last pattern involves areas where a single subtype is circulated, such as in Egypt with subtype 4a [7] and South Africa with subtype 5a [8, 9].Saudi Arabia has shown an intermediate endemicity for HCV. Seroprevalence rates ranging from 0.9% to 5% had been reported among children and adults, respectively [10]. Some studies had indicated the predominance of genotype 4 in this region [11, 12]. The main aim of the present study is to evaluate the relationship between genotyping of HCV and quantitative "viral genome" in blood serum, identification and prevalence of different HCV genotypes/Subtypes.
2. Material and Methods
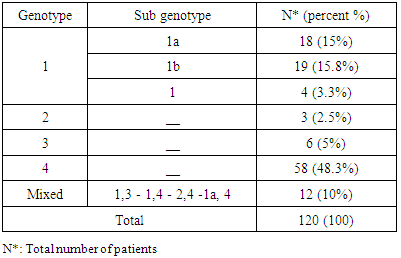
- The study was conducted from 14 April, 2013 until 14 April, 2015 at the “Regional lab”, Riyadh, Saudi Arabia. One hundred and twenty (120) HCV patients were grouped during the viral infection, and the demographic data was specified according to age and sex. These were grouped as genotype (1, 2, 3, and 4) and mixed genotype (more than one type) as illustrated in Table 1, low-SVR.VL1, as well as SVR.VL2. The duration between the two tests of viral load values was found to be not less than 12 days and not more than 392 days. There were two status categories of patients infected with HCV; some of them were acute because the viral load was less than 1000 IU/mland most of them were chronic because the viral load was more than 1000 IU/ml. Blood samples (total of 15 ml) were obtained from each patient for HCV patients. Serum was separated by centrifugation for 5 min at 5000 (RPM), and then supernatant stored in pre-labelled sterile polypropylene aliquots at -20 °C until analysis.The Abbott RT-PCR HCV assay is an in vitro reverse transcription-polymerase chain reaction (RT-PCR) assay for the quantitation of HCV-RNA in human serum and plasma from HCV infected individuals. The Abbott m2000sp provided automated sample preparation using a magnetic micro particle-based protocol (Abbott sample Preparation System) to process 0.5 ml samples (acid citrate dextrose-AN ACD-A, Citrate phosphate Dextrose (CPD) solution, potassium Ethylenediaminetetraacetic Acid (EDTA), or sodium EDTA plasma or serum). During the sample preparation protocol, HCV virions were disrupted by guanidine isothiocyanate, RNA was captured on the magnetic micro particles, inhibitors were removed by washing steps, and RNA was eluted off the micro particles. The bound nucleic acids were eluted and transferred to a 96 deep-well plate. The nucleic acids were then ready for amplification. The IC was introduced into each specimen at the beginning of the sample preparation process to demonstrate that the process was completed correctly for each specimen. The Abbott RT-PCR HCV Genotype II assay consists of two reagent kits: (a) Abbott RT-PCR HCV Genotype II Amplification Reagent Kit; (b) Abbott RT-PCR HCV Genotype II Control Kit.The data was presented as medians, and non-parametric tests including Mann-Whitney U test for univariate and Kruskall-Wallis Analysis of variance (ANOVA) for multivariate comparisons were applied. Pearson and Spearman rank tests were used for correlations analysis. Figures were performed by use of Statistical 8.0 (Stat soft, Tulsa, USA). The best cut-off of viral load titre was estimated using the area under the AUROC for evaluating specificity and sensitivity for (SVR) in each genotype. It was done by Predictive Analytics Software (PASW) Statistics [13].
3. Results
3.1. Prevalence of HCV Genotypes in Saudi Arabia
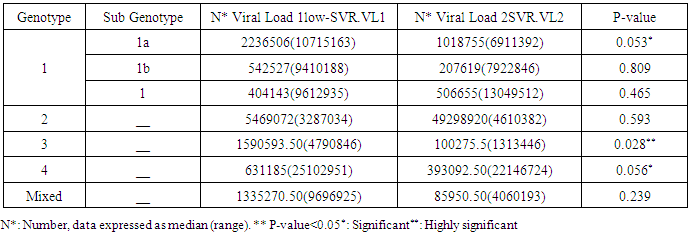
- One hundred and twenty (120) HCV patients were examined during the natural period of the virus. The demographic data was specified such as age and sex for each of them. They were grouped as genotype (1), (2), (3), (4) and Mixed genotype "more than one type"), as illustrated in Table 1. The less quantity of viral load in genotype (1) was 404143 IU/ml and the highest quantity of viral load in genotype (2) was 5469072 IU/ml (Table 2). No significant difference was demonstrated for gender ratio in all genotype, and there were significant differences in the age values between HCV genotype (4) at age group (60-70) (P= 0.052) as shown in Table 3 and Figure 2.According to the present study, the amplification inside the core region found to be highly conserved between different genotypes of HCV (Table 1). All groups were anonymous before using RT-PCR test. In addition to the five main groups of genotype (1, 2, 3, 4 and Mix genotype; 1, 3 - 1, 4 - 2, 4 and 1a, 4), there were two more sub-types for genotype (1) (1a, 1b) and genotype (4). The most prevalence percentage existed in genotype (4) was 48.3% which resembles prevalent genotype in Saudi Arabia, followed by genotype (1) (34.1%) and mix genotype (10.00 %). Consequently, genotype (3) was found 5% and finally genotype (2) was 2.5%.
|
3.2. Correlation between the Viral Loads in Low-SVR.VL1 and SVR.VL2 among HCV Patients
- Data shown in Table 2 indicates the highest median for viral load that illustrated the values at low-SVR.VL1, where it was 5469072 IU/ml for genotype (2), 2236506 IU/ml for genotype (1a). In addition, the median of viral load was 1590593.50 IU/ml in genotype (3), 1335270.50 IU/ml for mix genotype was 631185 IU/ml for genotype (4), 542527 IU/ml for genotype (1b) and 404143 IU/ml for genotype (1). The viral load RT-PCR as SVR.VL2 was significantly reduced in genotype (3), where it decreased from 1590593.50 IU/ml before medication to 100275.5 IU/ml SVR.VL2 with (P-value = 0.028). The viral load SVR.VL2 showed remarkable decrease in genotype (1a) which had (P-value = 0.053), while genotype (4) had the third position to be affected (P-value = 0.056), and with no significance for both of them. Figure 1 illustrates a significant correlation between the viral loads SVR.VL1 and SVR.VL2 among HCV patients (r=0.642 & p=0.00). The same data was expressed in logarithmic values alternatively (Log10IU/ml).Regarding the comparison of all studied genotypes and age groups prevalence, it was found that the major part group in genotype (4) was 41.38% for age group (60-70 years old), while it was 31.71% in genotype (1) for age group (50-60 years old), 50% in mix genotype for age group (60-70), 50% in genotype (3) for age group (40-50 years old), and 66.67% in genotype (2) for age group (50-60 years old). In addition, Table 3, 4 and Figure 2 show the distribution of age group categories as a total percentage in genotype 4 was 7 groups between (20-90 years old) the same as genotype 1. While the other genotype differs; for mix genotype the prevalence age indicated 5 groups between (30-80 years old); genotype 3 had 4 groups between (30-80 years old); while genotype 2 showed 2 groups between (50-80 years old).Concerning the comparison between all the studied genotypes and gender prevalence, the predominant gender in genotype (1) and mix was male with the percentage of 63.41% and 66.67% respectively (Table 4 and Figures 5 and 6). The female gender was predominant in genotypes (4) and (2) with the percentage of 55.17% and 100%, respectively. On the other hand the gender prevalence in genotype 3 was equal for both male and female.
|
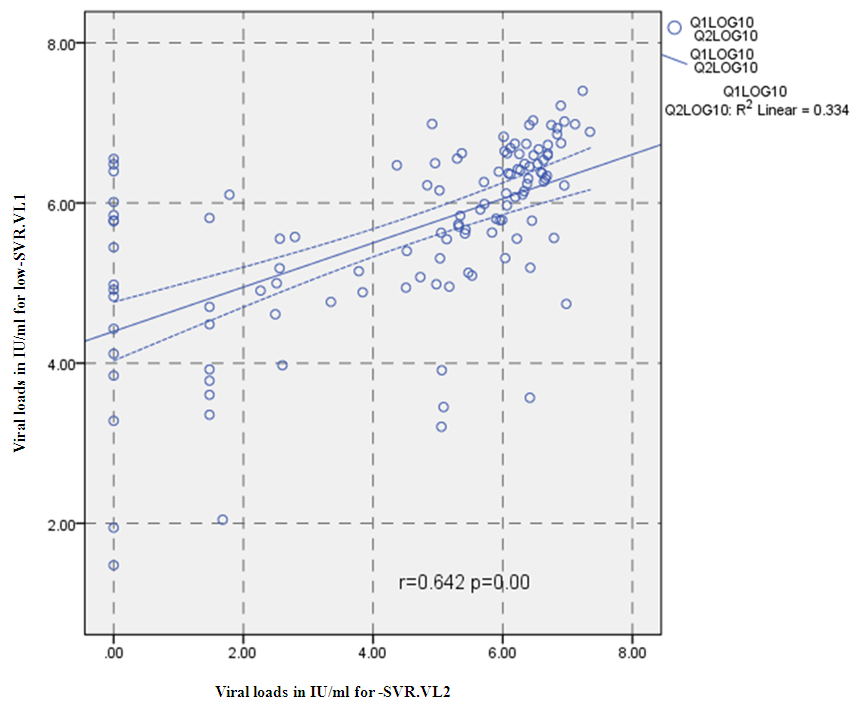 | Figure 1. Correlation between the viral loads IU/ml for low-SVR.VL1 and SVR.VL2 levels in the whole sample, P= Express the power of Test and r= Express the power of Correlation |
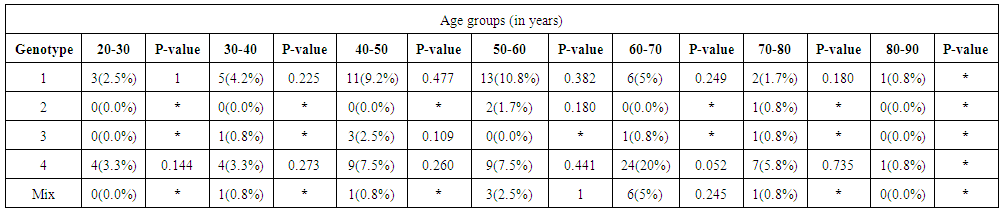 | Table 3. Demographic characteristic of the studied HCV infected patients’ splatted by age groups |
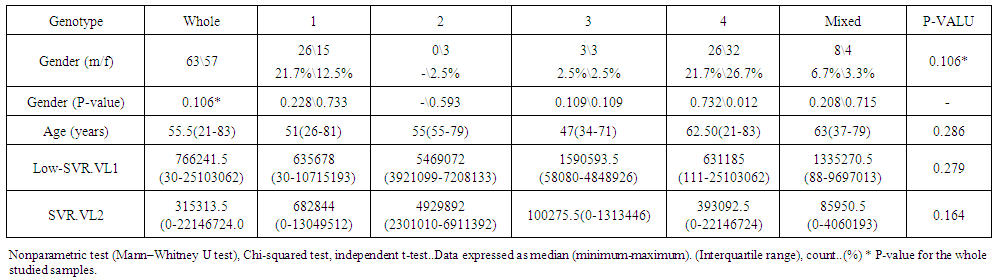 | Table 4. Correlation between Demographic Data of Cohort HCV Patients and low-SVR.VL1 and SVR.VL2 |
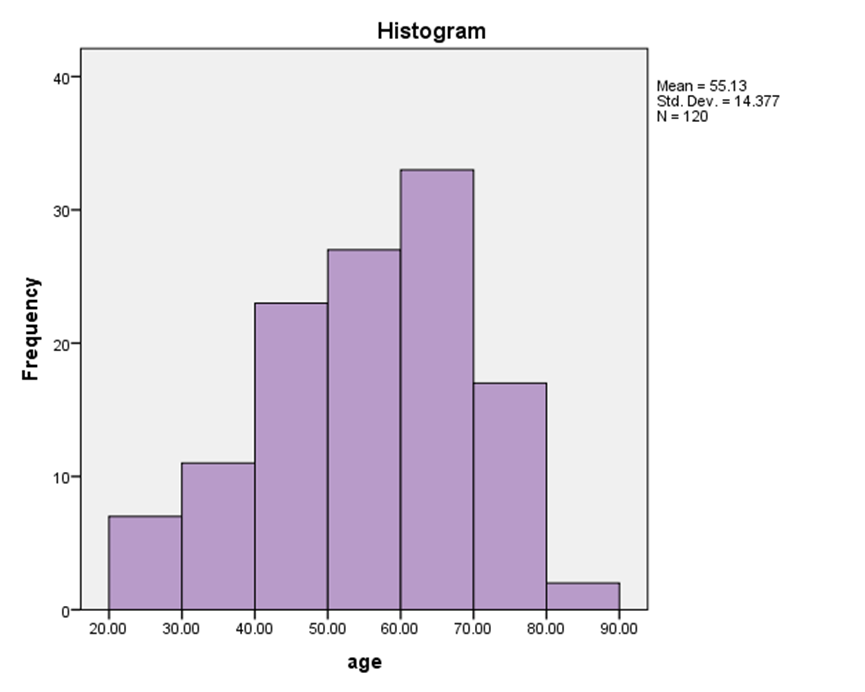 | Figure 2. Demographic characteristic distribution of the studied HCV infected patients split by age groups |
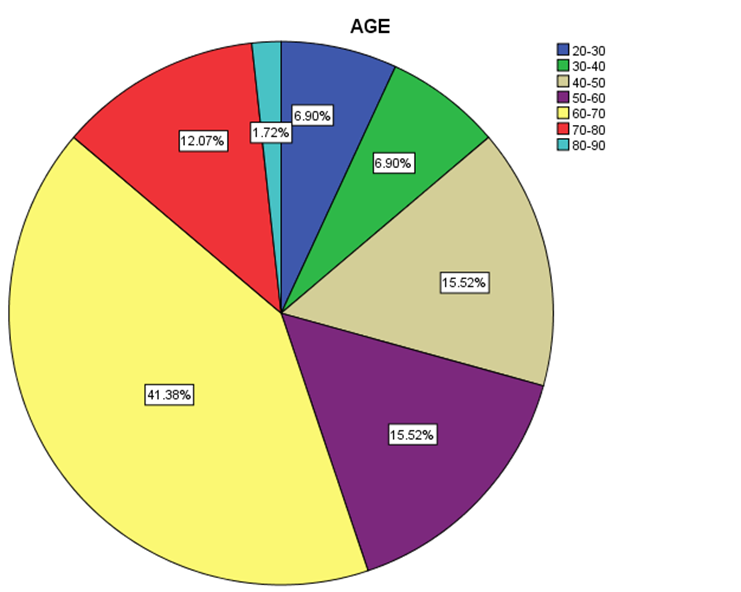 | Figure 3. Distribution percentage of genotype 4 in different age groups |
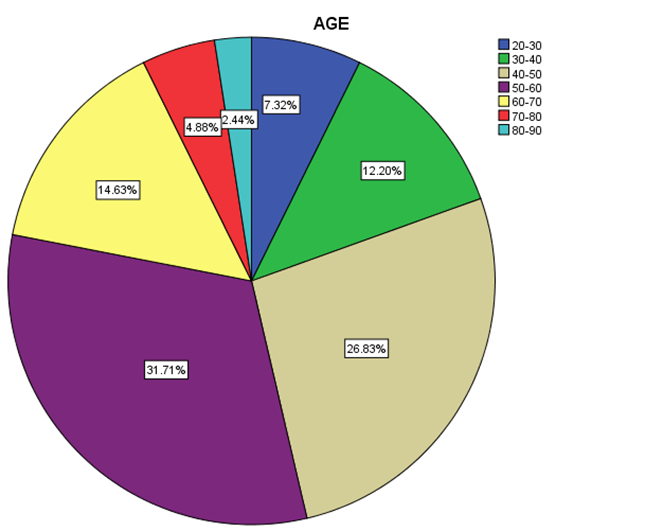 | Figure 4. Distribution percentage of genotype 1 in different age groups |
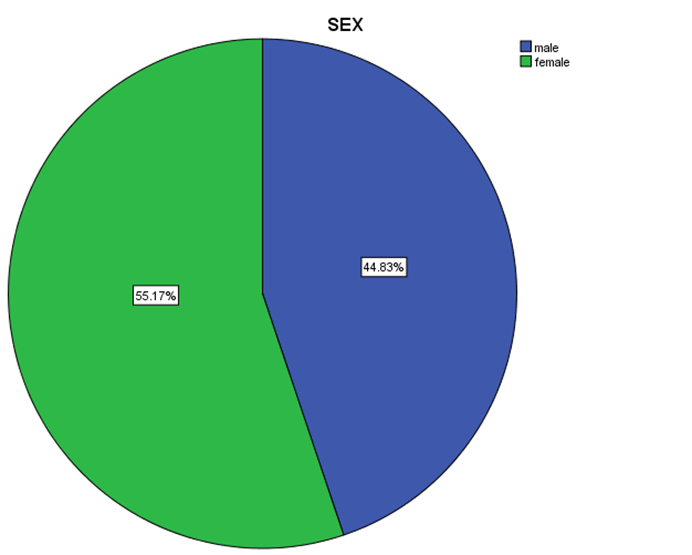 | Figure 5. Distribution percentage of genotype 4 in gender |
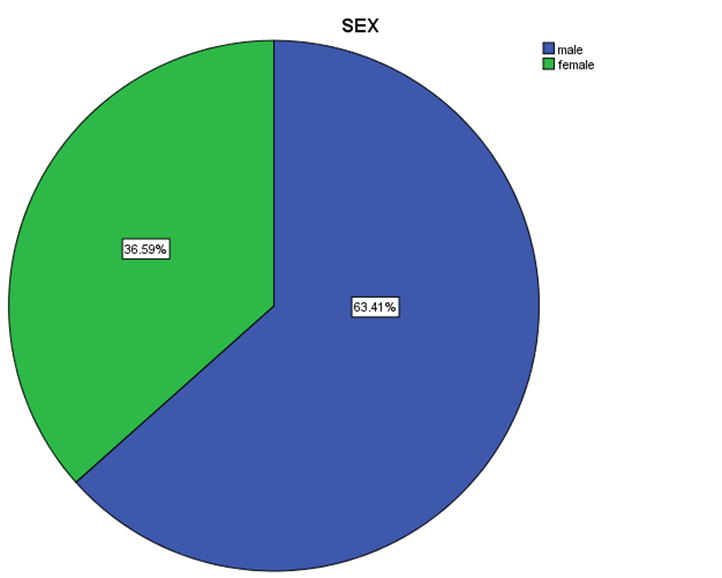 | Figure 6. Distribution percentage of genotype 1 in gender |
3.3. Viral Load Distribution and Correlation among HCV Patient inlow-SVR.VL1 and SVR.VL2 in Each Genotype
- Figure 7, 9, 13 and 15 showed comparative analysis of medians distribution of viral load low-SVR.VL1/SVR.VL2 RNA ratio along with its range (minimum-maximum) in chronic phase. GENOTYPE 4 demonstrated a strong positive correlation between viral loads low-SVR.VL1 and SVR.VL2 (r=0.636 p=0.00) in Figure 8 also. GENOTYPE 1: Figure 10 showed also a strong positive correlation between viral loads low-SVR.VL1 and SVR.VL2 (r=0.749 p=0.00). MIX GENOTYPE in Figure 12 fairly detected an association between the two viral loads low-SVR.VL1 and SVR.VL2 but insignificant (r=0.507 p=0.092). While in GENOTYPE 3, Figure 14 revealed a moderate positive correlation between viral loads low-SVR.VL1 and SVR.VL2 but insignificant (r=0.486 p=0.329). GENOTYPE 2: Figure 16 proved a moderate positive correlation between viral loads low-SVR.VL1 and SVR.VL2 and insignificant (r=0.458 p=0.697).
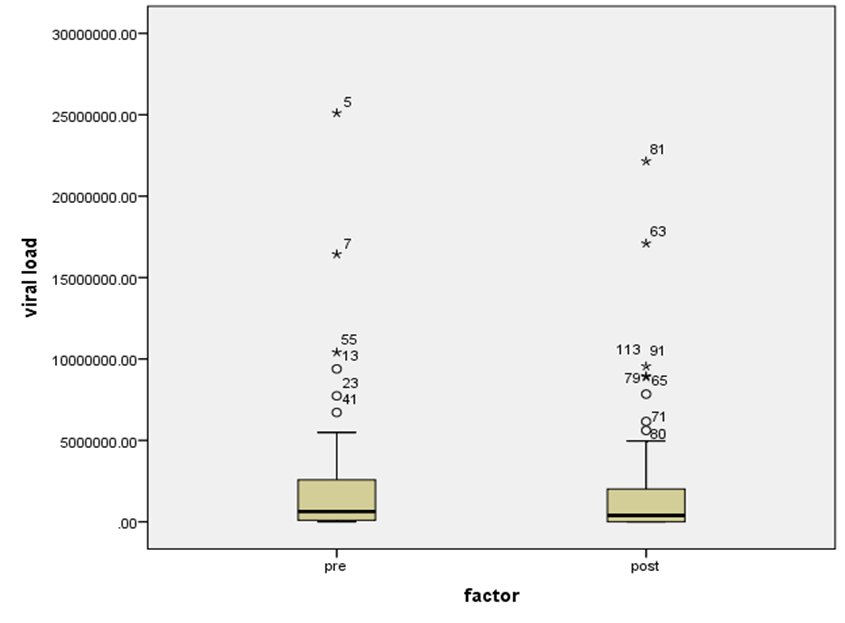 | Figure 7. HCV RNA level (viral load) in IU/ml distribution among HCV patients low-SVR.VL1/SVR.VL2. Box Plot between the viral loads for pre (low-SVR.VL1) and post (SVR.VL2) levels in the Genotype 4 |
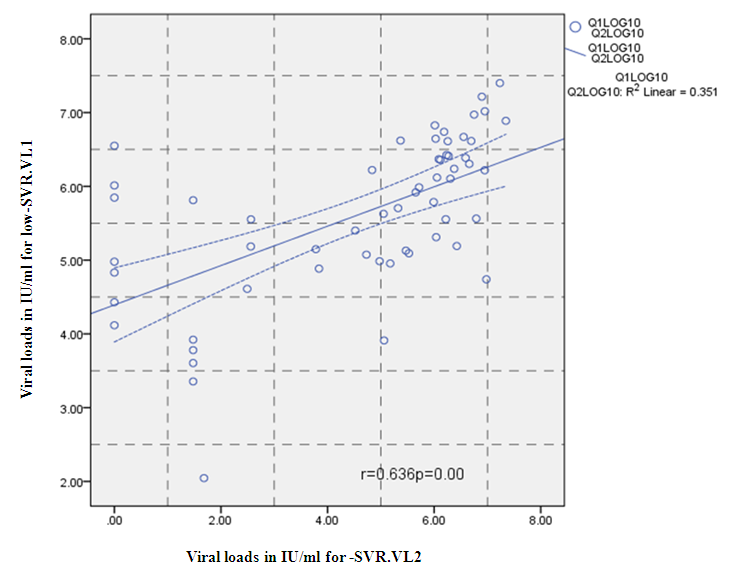 | Figure 8. Correlation between the viral load 1 and viral load in IU/ml for the Genotype 4. P = Express the power of Test and r = Express the power of Correlation |
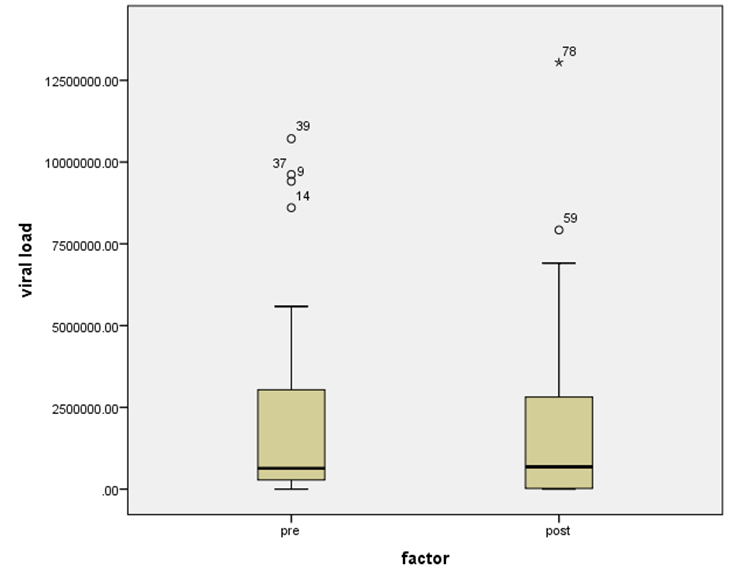 | Figure 9. HCV RNA level (viral load) in IU/ml distribution among HCV patients’ low-SVR.VL1 and SVR.VL2. Box Plot between the viral loads for pre (low-SVR.VL1) and post (SVR.VL2) levels in the Genotype 1 |
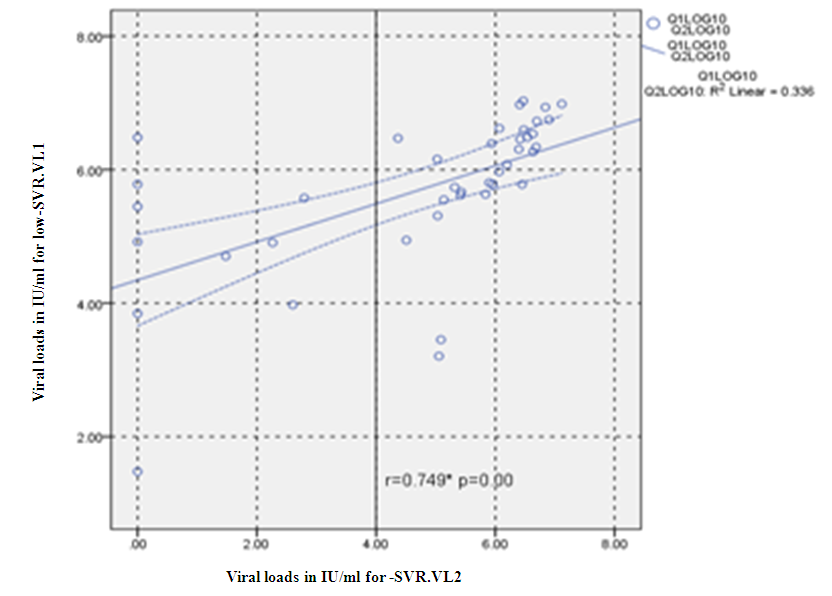 | Figure 10. Correlation between the viral load 1 and viral load (IU/ml) in the Genotype 1. P = Express the power of Test and r = Express the power of Correlation |
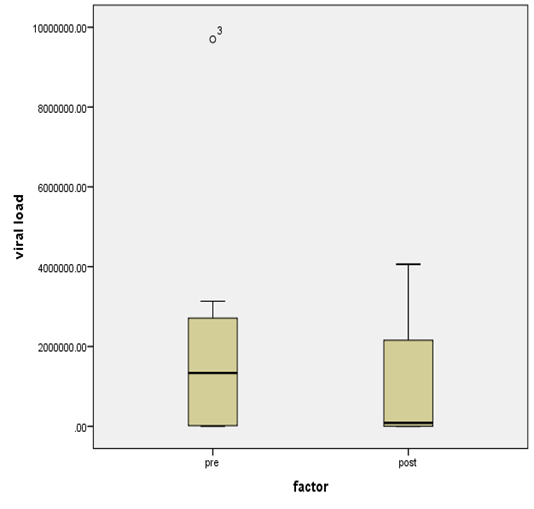 | Figure 11. HCV RNA level (viral load) in IU/ml distribution among HCV patient’s low-SVR.VL1 and SVR.VL2. Box Plot between the viral loads for pre (low-SVR.VL1) and post (SVR.VL2) levels in the Mix Genotype |
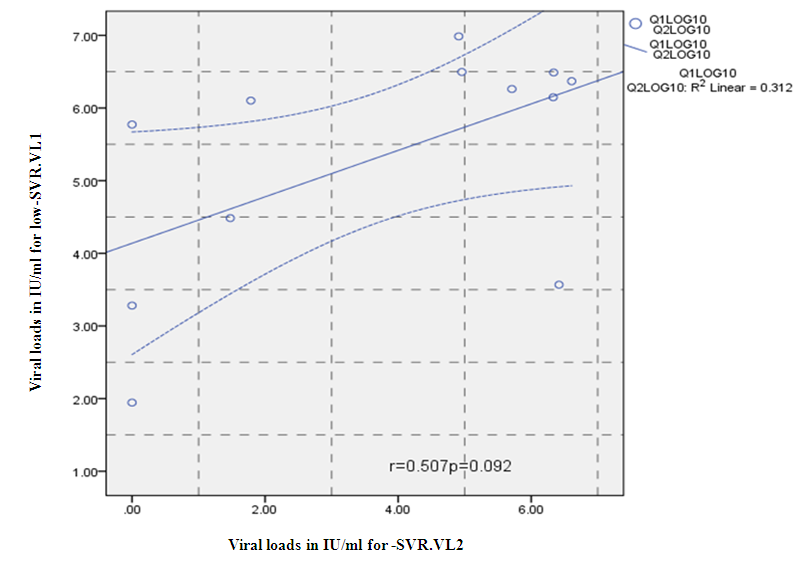 | Figure 12. Correlation between the viral load 1 and viral load 2(IU/ml) in the Mix Genotype. P = Express the power of Test and r = Express the power of Correlation |
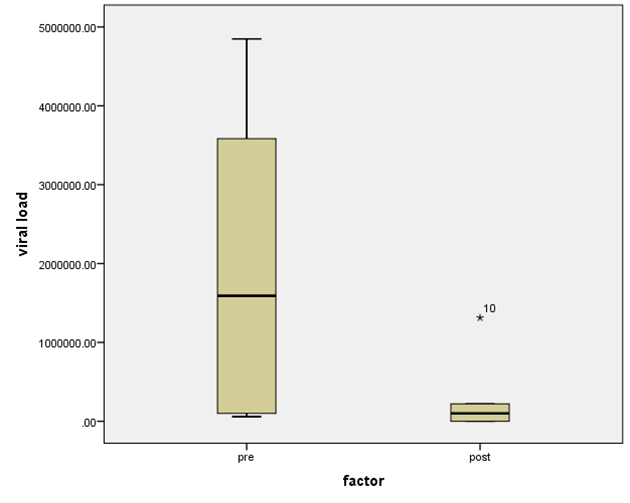 | Figure 13. HCV RNA level (viral load) IU/ml distribution among HCV patient’s low-SVR.VL1 and SVR.VL2. Box Plot between the viral loads for pre (low-SVR.VL1) and post (SVR.VL2) levels in the Genotype 3 |
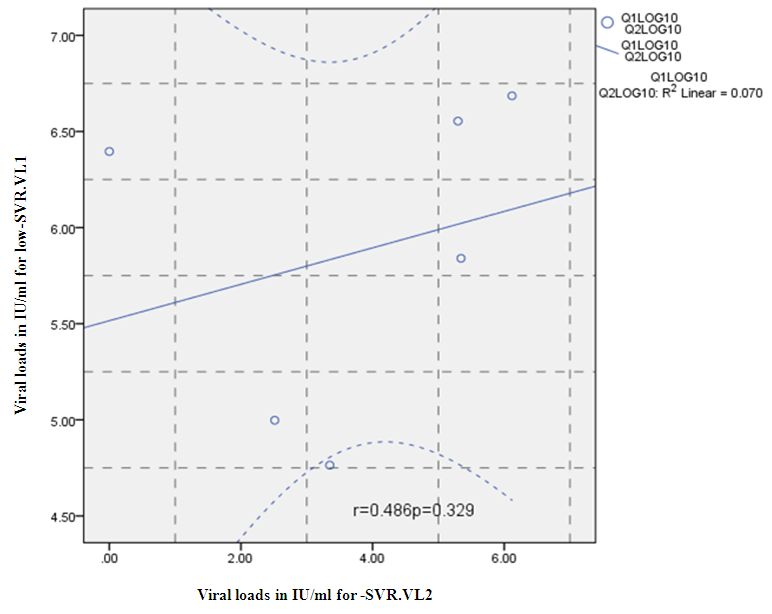 | Figure 14. Correlation between the viral load 1 and viral load 2(IU/ml) in the Genotype 3. P= Express the power of Test and r= Express the power of Correlation |
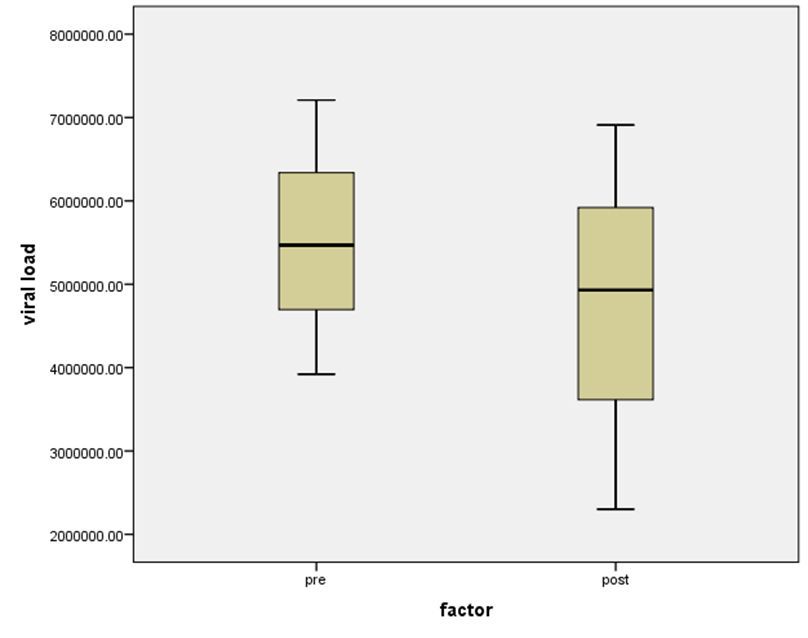 | Figure 15. HCV RNA level (viral load) IU/ml distribution among HCV patient low-SVR.VL1 and SVR.VL2. Box Plot between the viral loads for pre (low-SVR.VL1) and post (SVR.VL2) levels in the Genotype 2 |
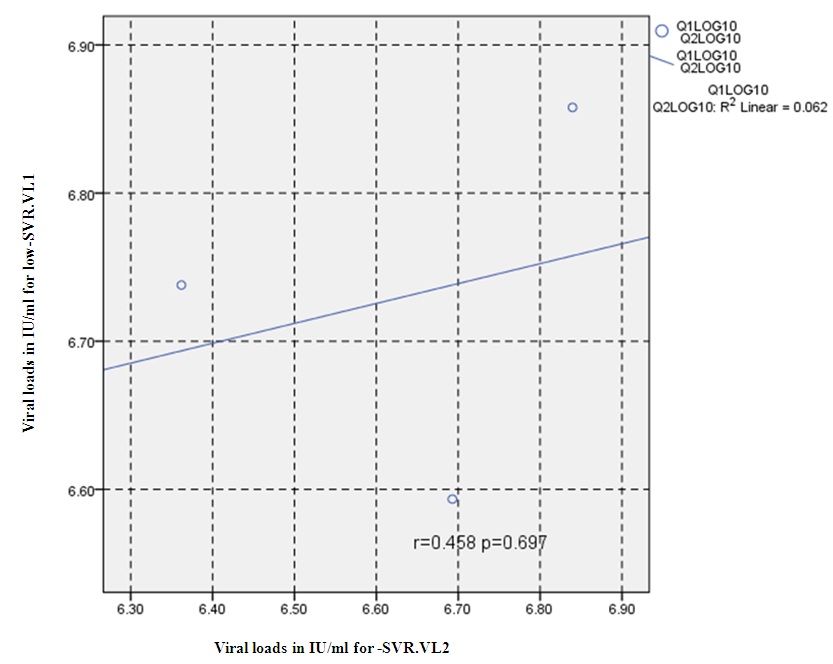 | Figure 16. Correlation between the viral load 1 and viral load 2 (IU/ml) in the Genotype 2. P = Express the power of Test and r = Express the power of Correlation |
3.4. Genotype in HCV Patients and Viral Load Cut-off Values Using the ROC Analysis
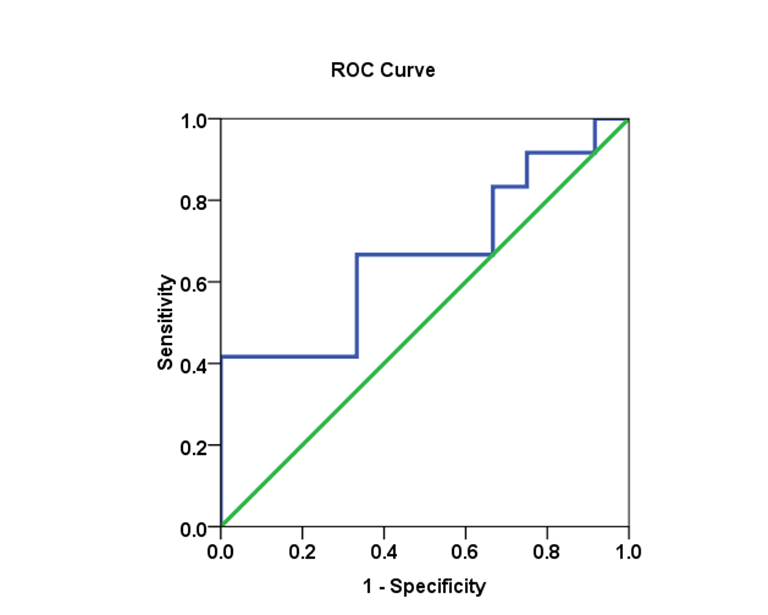
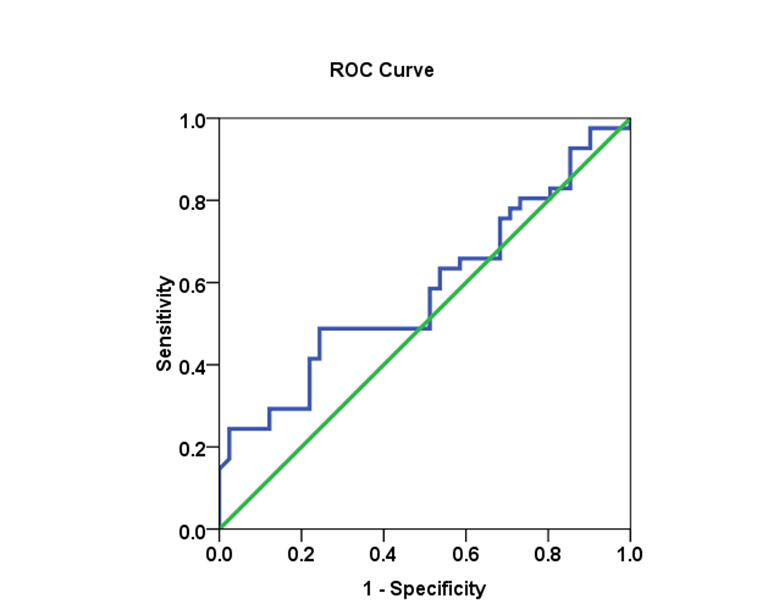
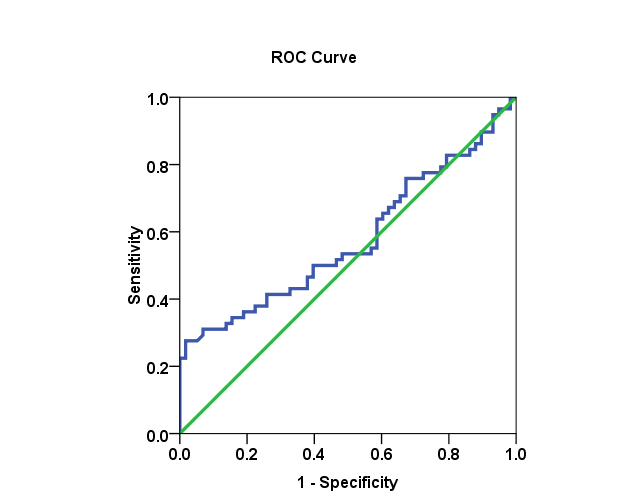
- Biomarkers have become essential tools for proper diagnosis and treatment of a wide range of illnesses, including cancer, diabetes and HCV infectious diseases. Cut-off values were estimated using the area under the AUROC for evaluating specificity and sensitivity for (SVR) in each genotype. The comparison of the (AUROC) of two biomarkers and the generation of confidence intervals for sensitivity given fixed specificity [15].In (Table 5), The Receiver Operating Characteristic (ROC) curve analysis is a useful tool in the assessment of viral load after medication accuracy. Its advantages include testing across the entire range of scores and thereby not requiring a predetermined cut-off point, in addition to easily examined visual and statistical comparisons across tests or scores, and, finally, independence from outcome prevalence. Furthermore, ROC analysis is a useful tool for evaluating the accuracy of a statistical model that classifies subjects into one (SVR.VL2) of two categories (low-SVR.VL1 and SVR.VL2). Diagnostic models are different from predictive and prognostic models in that the latter incorporate time-to-event analysis, for which censored data may pose a weakness of the model, or the reference standard. However, with the appropriate use of ROC curves, investigators of viral loads low-SVR.VL1 and SVR.VL2 can improve our research and presentation of results. [16, 17]. Viral load diagnosis for HCV patients' low-SVR.VL1 and SVR.VL2 could be useful in diagnosis and prognosis and in prediction of response of HCV patients to therapy. (Table 5 and Figures 17, 18, 19, 20 and 21) illustrate the suggested cut-off values of viral loads in the studied different genotypes to differentiate the response in each genotype low-SVR.VL1 and SVR.VL2. The cut-off value of genotype 3 (Figure 17) demonstrated the highest sensitivity (83.3%) with AUC equalled (0.806%) which indicated the most sensitivity value with cut-off viral load that equalled (456468.50 IU/ml) (sensitivity 83.3% and specificity 66.7 %). (Figure 18 and 19) showed a less sensitive response depending on viral load in both genotype 2 and mixed genotype. The cut-off value that was determined using AUC was 5199500.00 IU/ml and 5522190.50 IU/respectively. Both genotypes had (sensitivity 66.7% and specificity 66.7% with moderate confidence > 54%). Contrarily, in genotype 1 (Figure 20) viral load as a test SVR.VL2 had no sensitive response as well as in mixed genotype. (Figure 21) while in genotype 4 the cut-off value that was determined using AUC showed equalled 36951.50 IU/ml; genotype 1 showed cut-off value of 274170.50 IU/ml. The sensitivity and specificity for the former were 32.8% and 86.2%. While the sensitivity and specificity for the latter were 48.8% and 75.6%. The sensitivity confidence in viral load was less than 54% for both of them.
|
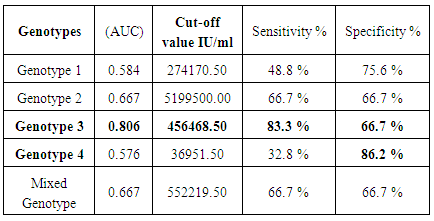
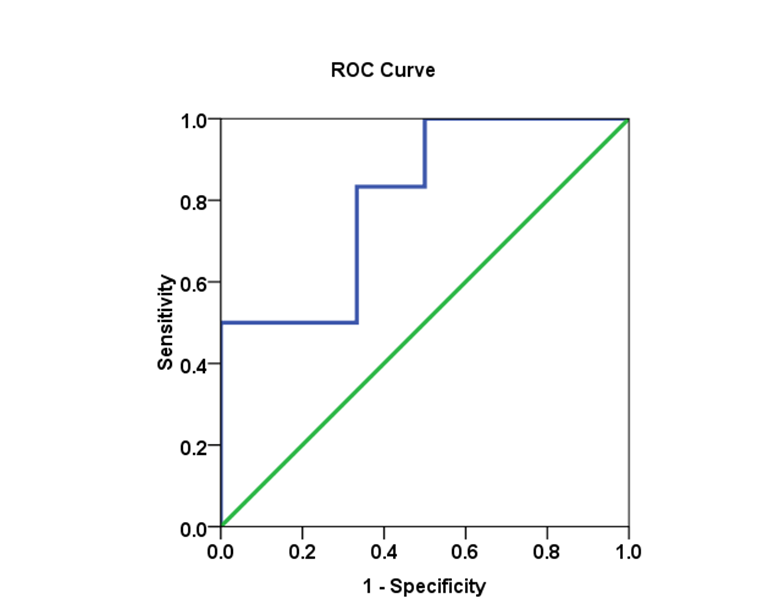 | Figure 17. The AUC for genotype 3 and SVR.VL2 levels in HCV patients: AUC =0.806, with 83.3% sensitivity and 66.7% specificity. The true positive rate (sensitivity) is plotted as a function of the false rate (1-specificity). Each point on the ROC plot represents a sensitivity/specificity pair corresponding to a particular decision threshold. AUC value represents the combined effects of both sensitivity and specificity of viral load in diagnosing patients infected with HCV |
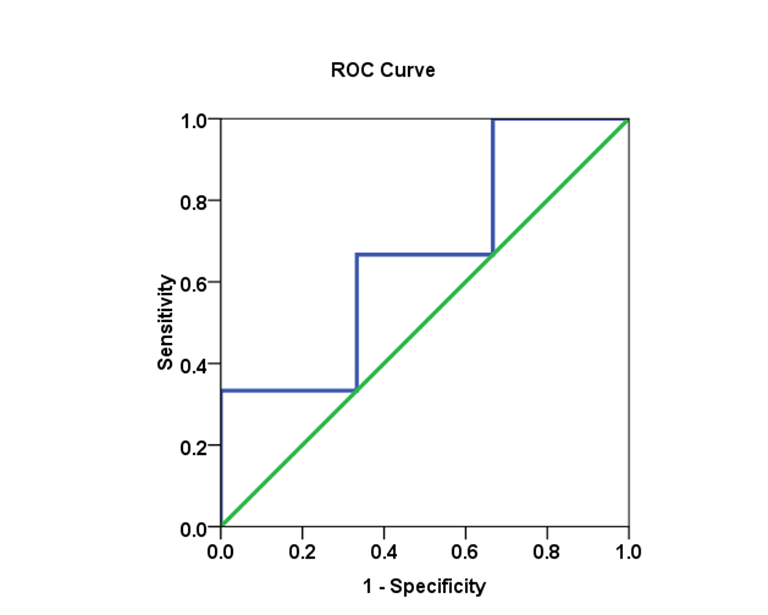 | Figure 18. The AUC for genotype 2 and SVR.VL2 levels in HCV patients: AUC =0.667, with 66.7% sensitivity and 66.7% specificity |
 | Figure 19. The AUC for Mixed genotype and SVR.VL2 levels in HCV patients: AUC =0.667, with 66.7% sensitivity and 66.7% specificity |
 | Figure 20. The AUC for genotype 1 and SVR.VL2 levels in HCV patients: AUC =0.584, with 48.8% sensitivity and 75.6% specificity |
 | Figure 21. The AUC for genotype 4 and SVR.VL2 levels in HCV patients: AUC =0.576, with 32.8% sensitivity and 86.2% specificity |
4. Discussion
- Hepatitis C virus (HCV) is one of the major causes of chronic liver disease in the world. Majority of infected individuals are unable to clear the virus and as a consequence of infection, cirrhosis and hepatocellular carcinoma can be developed in later stages [18].Genotyping is considered an important tool for epidemiological and clinical studies. The biological differences between genotypes make genotyping important for decision-making regarding disease management and therapeutic intervention [19]. HCV shows a remarkable genetic diversity, contributing to its high persistence and varied susceptibilities to antiviral treatment. Previous studies have reported that the substitution of amino acids in the HCV sub genotype 1b core protein in infected patients is associated with a poor response to PEG-IFN/RBV combined therapy [20].Our data indicates no significant association between the responses to treatment and age and gender in genotype 1, 2, 3 and mixed. However, there is a significant association between genotype 4 in female gender (P-value=0.012) and treatment response in Figure 5 and Table 4. Marie, 2011[21] found there was no association to treatment with chronic HCV genotype 4 and age, gender, weight, liver enzymes, HCV viral load, disease stage, and grade. Contrarily; our data concerning age in genotype 4 indicates significant association in age group 60-70 as HCV chronic infection.Debojyoti Bhattacharjee et al., 2015[1] told among 66 HCV RNA positive cases. Genotypes1a, 3a and 3b were observed among 18 (27%), 44(67%) and 4(6%) cases respectively. Genotype 3a had higher viral load than patients infected with genotypes 1 and 3b. However, no statistical significance was observed for viral load among the various HCV RNA genotypes.Ali, et al, 2011[9] studied the distribution of HCV genotypes in Pakistan and associated these genotypes (1a, 1b, 2a, 3a and 3b) with gender. The results of this study clearly showed that there was no variation among the HCV genotypes and gender as different HCV genotypes were distributed with same ratio between males and females; in addition, the study indicated that high prevalence rate 40.32% of HCV infection was found between age group of 30-40. Genotype 3a resemble (45.8%). Contrarily, in our genotype 4 was the predominant one with significant value of (20%) (P-value= 0.052. The study in Egypt revealed a sensitivity of (100%) in detecting type 4, the most prevalent genotype in Egypt, as genotype-4 was detected in this study in 283 cases out of 300 (94.3%). It was the same as our data in Saudi Arabia in 58 cases out of 120 (48.3%) [22].There are few studies and a lack of comprehensive data on the distribution of HCV genotypes in Middle Eastern countries, particularly in Saudi Arabia. Our results in Table 1 show that HCV genotype 4 is the predominant genotype 58 (48.3%) among Saudi patients followed by genotype 1b 19 (15.8%), 1a 18 (15%), mixed genotype 12 (10%), genotype 3 6 (5%), genotype 1 4(3.3%) and genotype 2 3 (2.5%), respectively. The results obtained from Marie, 2011 [21] in Saudi Arabia indicated that HCV genotype 4 is the predominant genotype (74.2%) among Saudi patients followed by 3 (11.7%) and 1a (3.9%).Assessment of viral load is crucial for monitoring antiviral therapy [22] and low HCV viremia is a predictive factor of a successful response to interferon therapy [23]. Many studies have observed a good correlation between quantification methods of HCV viral load [24].Viral load prior to antiviral therapy is regarded as an important prognostic sign and a valuable predictive sign for outcome of antiviral therapy. High base line viral load in terms of HCV RNA copy numbers was associated with low response to standard interferon therapy and higher probability of relapse compared to those with low level viremia [23].Genotyping of HCV may be a useful epidemiological marker particularly in establishing suspected unconventional routes of HCV transmission such as vertical, intraspousal, or interfamilial transmission [21, 25]. In our study, it was clear that the correlation between HCV low-SVR.VL1 and SVR.VL2 in genotype 1 and 4 was non-linear in (Figure 1, Figure 8 and Figure 16). Strong positive correlation was noticed in the regression value for genotype 1 with (r=0.749 p=0.00), genotype 4 with (r=0.636 p=0.00) which reflected the strong positive regression value (r=0.642 p=0.00) in the whole patients. Contrarily; the best SVR.VL were in genotype 3 (r=0.486 p=0.329) and 2 (r=0.458 p=0.697) after medication. The regression values were completely different compared to genotype 1 and 4. It means that correlation is a moderate positive. In the box plot analysis Figure 19 indicated a significant SVR.VL (P-value = 0.028) in genotype 3 compared to non-significant SVR.VL (P-value = 0.583) in genotype.
5. Conclusions
- The genotype 4 was the most common (48.3%) followed by 1b (15.8%), 1a (15%), mixed/ (10%), 3 (5%), 1 (3.3%) and 2 (2.5%), respectively. Genotype 4 at age group (60-70) revealed significant differences in viral load (P= 0.052). The median (range) IU/ml HCV resembled Sustained Virological Response of Viral Load 2 (SVR.VL2) after medication which was significantly lower in genotype 3 from 1590593.50 IU/ml for (SVR.VL1) to 100275.5 IU/ml for (SVR.VL2) with P=0.028 followed by genotype 4 (P= 0.056) and genotype 1a (P=0.053).Females in genotype 4 had P=0.012 significance reduction for (SVR); from SVR.VL1: 202326.5 IU/ml to SVR.VL2: 4358 IU/ml. The cut-off value of genotype 3 demonstrated the highest sensitivity (83.3%) and specificity (66.7 %). AUROC curve equalled (0.806%) with cut-off viral load of 456468.50 IU/ml. contrarily; genotype 4 showed the lowest sensitivity (32.8 %) and high specificity (86.2 %).Strong correlation between SVR.VL1 and SVR.VL2 in the whole cohort(r=0.642), genotype 1(r= 0.749) and genotype 4 (r= 0.636) was noticed; contrarily; genotype 3 and genotype 2 had a moderate positive correlation and was insignificant (r=0.486 P=0.329) and (r=0.458P=0.697) respectively.SVR.VL2 of HCV correlates with HCV genotype. The distribution of HCV genotypes has important clinical implications because the efficacy of current and new therapies differ by genotype treatment patients. The present study recommended to relay on (83.3 %) sensitivity of genotype3 as a predictor variant with Cut-off levels ≥ 456468.50 IU/ml for viral load during (SVR.VL2) as a predictor in clinical practice through the knowledge of quantitative and genotyping of the virus in the Kingdom of Saudi Arabia.