-
Paper Information
- Paper Submission
-
Journal Information
- About This Journal
- Editorial Board
- Current Issue
- Archive
- Author Guidelines
- Contact Us
International Journal of Internal Medicine
p-ISSN: 2326-1064 e-ISSN: 2326-1072
2014; 3(3): 39-42
doi:10.5923/j.ijim.20140303.01
Evaluation of Clinical Response According to Plasma Paroxetine Level in Paroxetine-Responsive Major Depression
 Abstract
 Reference
 Full-Text PDF
 Full-text HTML
Gul Eryılmaz1, Isil Gogcegoz Gul2, Ozgur Yorbik3, M. Murat Arat4
1Uskudar University Neuropsychiatry Hospital, Psychiatry, Istanbul, Turkey
2Uskudar University Istanbul Neuropsychiatry Hospital, Psychiatry, Istanbul, Turkey
3Maltepe University, Istanbul, Turkey
4Department of Statistics, Hacettepe University, Beytepe, Ankara, Turkey
Correspondence to: Gul Eryılmaz, Uskudar University Neuropsychiatry Hospital, Psychiatry, Istanbul, Turkey.
| Email: |  |
Copyright © 2014 Scientific & Academic Publishing. All Rights Reserved.
Objective: The goal of this study was to determine the clinical response according to paroxetine plasma levels (PPL) in the treatment of major depressive disorder (MDD) patients responsive to 20 mg/d paroxetine. Methods: We retrospectively evaluated the charts of 94 MDD patients who had received 20 mg/d paroxetine and whose PLL had been determined on the 1st and 3rd week. Those with PPL over 120 ng/mL were Group 1, 120-30 ng/mL Group 2, and less than 30 ng/mL Group 3. Treatment response was evaluated with the Hamilton Depression Rating Scale (HAM-D) and the Brief Psychiatric Rating Scale (BPRS) in the first and the third week.Results: A weak correlation between PPL values and MDD treatment response were determined in this study. There was no statistically significant difference between the three groups regarding the HAM-D and BPRS scores in the 3rd week. We found significantly higher PPL levels in Group 1 and 2 on the 3rd week compared to the 1st week. There was no statistically significant difference between 1st and 3rd week PPL levels in Group 3. There was a weak positive correlation between the treatment response rates (initial HAM-D scores/3rd week HAM-D scores) and PPL levels. Conclusions: Present study suggested that there is a large amount of interpersonal pharmacogenetic variability for paroxetine metabolism. Higher PPL levels in the third week suggested that PPL measurement may be more reliable in the 3rd week than the first week.
Keywords: Paroxetine, Major depressive disorder, Plasma level, CYP2D6
Cite this paper: Gul Eryılmaz, Isil Gogcegoz Gul, Ozgur Yorbik, M. Murat Arat, Evaluation of Clinical Response According to Plasma Paroxetine Level in Paroxetine-Responsive Major Depression, International Journal of Internal Medicine, Vol. 3 No. 3, 2014, pp. 39-42. doi: 10.5923/j.ijim.20140303.01.
Article Outline
1. Introduction
- Paroxetine is a serotonin reuptake inhibitor approved by the U.S.A. Food and Drug Administration (FDA) for the treatment of major depressive disorder (MDD), obsessive compulsive disorder and pervasive anxiety disorder [1].Paroxetine is metabolized by the hepatic microsomal enzyme system (CYP). The most important enzyme in its metabolism is CYP2D6. The activities of its metabolites are negligible [2]. It’s half-life is 12-44 hours and it reaches stable plasma levels in 7 to 15 days. Arbeitsgemeinschaft fur europsychopharmakologie und Pharmakopsychiatrie (AGNP) 2011 therapeutic drug blood level monitoring guide (TDM) mentions PPL evaluation to be useful, and reports that there is inadequate evidence for corelation between the plasma level and pharmacodynamic effect. PPL evaluation was suggested for nonresponsive cases. The therapeutic plasma paroxetine level has been reported as 30 -120 ng/mL [3]. The relationship between PPL and clinical improvement in MDD treatment has been evaluated in a limited number of studies. One study has reported a positive relationship between PPL and clinical response [4] while another shows no relationship [5]. The response rate was reported as 50% for a PPL of 10 ng/mL and 76% for 40-120 ng/mL [6]. The relationship between PPL and clinical response in MDD treatment is not established. The aim of this study was to determine the clinical response according to PPL in the treatment of major depressive disorder (MDD) patients responsive to 20 mg paroxetine per day.
2. Method
- We retrospectively evaluated the charts of 400 patients diagnosed with MDD by a psychiatrist according to DSM IV-TR criteria, who had received paroxetine treatment as inpatients at Istanbul Neuropsychiatry Hospital between April 2009 and July 2012. A total of 306 cases who had received paroxetine treatment at doses higher than 20 mg/day, had received additional treatment such as electroconvulsive treatment (ECT) or had any other drug treatment or comorbid disorder that could affect PPL were excluded from the study. The charts of the remaining 94 patients who had received 20 mg paroxetine and whose 1st and 3rd week PPL levels had been measured were retrospectively evaluated for this study. Treatment response was evaluated with the Hamilton Depression Rating Scale (HAM-D) and Brief Psychiatric Rating Scale (BPRS). A decrease of more than 50% response in HAM-D score was accepted as response to depression treatment. BPRS scores between 15-30 was accepted as minor syndrome and scores higher than 30 are accepted as major syndrome.
3. Determination of Plasma Paroxetine Level
- PPL was determined with an Agilent 6410 triple quadruple mass spectrometer (Agilent Tech., Switzerland) by obtaining a 5 ml venous blood sample 12 hours after the last dose. Normal PPL was accepted as 30-120 ng/mL [3], and the sample was divided into 3 groups according to PPL values in third weeks. Those with PPL over 120 ng/mL were Group 1, 120-30 ng/mL Group 2, and less than 30 ng/mL Group 3.
4. Statistical Analysis
- The Wilcoxon signed rank test was used to evaluate statistically significant differences between the mean HAM-D, BPRS and PPL values of the first and third week. The response to treatment rate was determined by dividing the 3rd week HAM-D and BPRS scores by the initial HAM-D and BPRS values. The one-way ANOVA test was used to evaluate the difference between the mean values of the three groups. The relationship between treatment response rates and PPL levels was evaluated with Pearson's correlation test. Statistical significance was determined with a confidence interval of p<0.05 for all data.
5. Results
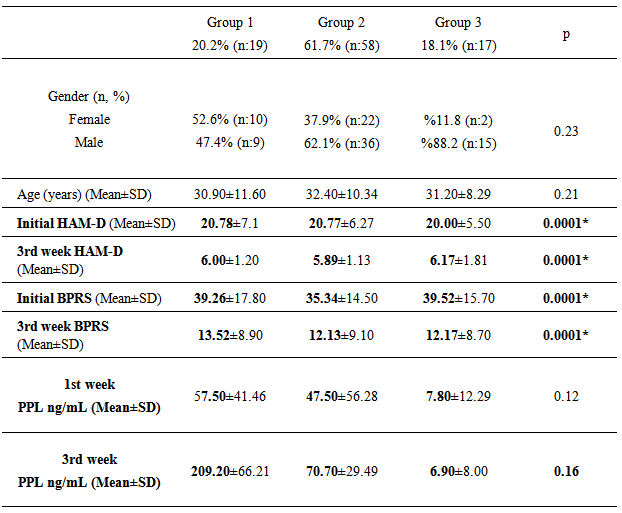
- After the patients that did not meet the study criteria were excluded, the study group consisted of the remaining 94 patients. Table 1 presents the distribution of the cases to the groups, mean age, first and third week mean HAMD and BPRS scores and mean PPL values. There was no difference in the age of three groups (p>0.05). The range of the first week PPL was between 1-380 ng/ml and the third week PPL 1-412 ng/ml in the paroxetine-responsive MDD group in this study.There was no statistically significant difference between the three groups regarding the HAM-D and BPRS scores in the 3rd week (p>0.05). The HAM-D and BPRS scores were significantly lower on the 3rd week compared to initial values in all three groups. We found significantly higher PPL levels in Group 1 and 2 on the 3rd week compared to the 1st week (p<0.05). There was no statistically significant difference between 1st and 3rd week PPL levels in Group 3 (p>0.05). Similarly, we found statistically significant difference between the 1st week mean PPL values of the three groups (p<0.05). There was a weak positive correlation between the treatment response rates (initial HAM-D scores/3rd week HAM-D scores) and PPL levels (Pearson correlation r=0, 26; p=0.013).
|
6. Discussion
- We evaluated the PPL level in MDD cases responsive to paroxetine. There was no difference between the three groups for initial depression severity and we did not find a correlation between the PPL and the clinical response to the treatment. This is consistent with the results of some studies reporting a positive correlation between the PPL and improvement degree [7-10], but not with the results of some other studies [9, 11, 12]. The conflicting findings may be attributed to factors such as race, gender and severity and chronicity of the depression.The clinical response in the group with a PPL levels under 30 ng/mL may be due to pharmacodynamic factors as Kato et al (2008) stated that the response to treatment in depression may be due more to carrier proteins and other pharmacodynamic factors than the PPL [13]. However, we did not perform any genetic tests with regards to paroxetine-metabolizing CYP2D6 and carrier protein metabolism. Additionally, the recovery observed in patients may also be attributed to a placebo effect (observed particularly during anti-depressant drug usage) and to the alterations in environmental factors during their hospital stay [14].A stable plasma level is reached after four half-life in 94% and five half-life in 97% of drugs. The half-life of paroxetine is 12-44 hours [3]. We found higher 3rd week than 1st week PPL levels in 81.9% of the cases in this study. This result suggested that PPL measurement may be more reliable in the 3rd week when determining the plasma stable level of paroxetine. The higher 3rd week PPL may also be due to the autoinhibition of paroxetine on the CYP2D6 enzyme. The para O-methylated methylated metabolite of paroxetine is a potent inhibitor of the enzyme CYP2D6 [15-18]. Plasma paroxetine measurement may be useful during paroxetine usage, because the drug inhibits the enzyme that metabolizes itself and increases its own plasma concentration. Since we followed our patients for only 3 weeks, it was not possible to investigate the changes in their plasma paroxetine levels in later weeks. It should be followed in longer-term studies. No side effect was reported in our study. Continued autoinhibition of the drug and related increase in the levels of paroxetine may result in toxicity. The range of the first week PPL was between 1-380 ng/ml and the third week PPL 1-412 ng/ml in the paroxetine-responsive MDD group in this study. Norman et al have reported PPL values of 2-107 ng/mL on the 7th day and 4-358 ng/mL on the 14th day of paroxetine treatment [9]. These studies suggested that there is a large amount of interpersonal pharmacogenetic variability for paroxetine metabolism. We also found a weak correlation between PPL values and MDD treatment response in this study. However, one must be careful in evaluating the results of this study as it is retrospective. A further study is warranted to investigate for any clinical improvements beyond the third week with addition of further PPL measurements. It may also be suggested that a study involving CYP2D6 genotyping in comparison with PPL and treatment response in MDD patients would help us better interpret the results.
7. Conclusions
- Higher PPL levels in the third week suggested that PPL measurement may be more reliable in the 3rd week than the first week. It may also be suggested that a study involving CYP2D6 genotyping in comparison with PPL and treatment response in MDD patients would help us better interpret the results.
ACKNOWLEDGMENTS
- The authors have no conflicts to disclose.