Mohamed N. AL Alfy1, Mohamed S. AL Hakim2, Ashraf T. Abd Elmouttaleb3, Ebrahim M. Bayomy4, Abdelraouf A. Abonar4, Mohamed A. Abood5
1Internal Medicine Department, Faculty of Medicine, Al-Azhar University, Egypt
2Histo-Pathology Department, Faculty of Medicine, Al-Azhar University, Egypt
3Medical Biochemistry Department, Assisted Reproductive Unit, International Islamic Center for Population studies and research, Al-Azhar University, Egypt
4Clinical Pathology Department, Faculty of Medicine, Al-Azhar University, Egypt
5Radiology Department, Faculty of Medicine, Al-Azhar University, Egypt
Correspondence to: Mohamed N. AL Alfy, Internal Medicine Department, Faculty of Medicine, Al-Azhar University, Egypt.
| Email: |  |
Copyright © 2014 Scientific & Academic Publishing. All Rights Reserved.
Abstract
Objective: the present study is to evaluate interleukin-12 (IL-12) cytokine and anti-C1q antibodies in lupus nephritis patients and their correlation to systemic lupus erythematosus (SLE) disease activity.Patients: This study included 71 subjects were divided into 3 groups: Group I: 30 patients with lupus nephritis. Group II: 21 patients without lupus nephritis. Group III (control group): 20 healthy subjects. Methods:All subjects were subjected to the following: History taking, clinical examination and relevant laboratory tests, immune profile including ANA, Anti-ds-DNA, anti-C1q and IL-12 were tested in the sera of patients and controls. Renal biopsy was done in lupus nephritis patients. Results:There is significant increase in both anti-C1q and IL-12 levels in all the studied SLE patients. There is highly significant increase in both anti-C1q and IL-12 levels in the studied patients withlupus nephritis. There is a significant increase in both levels of anti-C1q and IL-12 in the studied patients without lupus nephritis. There was a positive correlation between the levels of either anti-C1q or IL-12 and the degree of SLE disease activity index (SLEDAI). There was a positive correlation between the levels of anti-C1q in group I and II with ESR, platelet count, createnine and 24hr urinary proteins (in group I). But there was negative correlation with the Hb level, WBC, C3 and C4. IL-12 level, showed significant positive correlation with WBC, platelet count, creatinine level, ESR and 24-hr urine proteins (in group I), however it showed negative correlation with the Hb level, C3 and C4 .The mean level of anti-C1q in patients with class II (non-proliferative lupus nephritis) and in patients with class III and IV (proliferative lupus nephritis) and in patients with class V (membranous lupus nephritis) showed statistically significant difference between the 3 grades (P < 0.02). The mean level of IL-12 in patients with class II (non-proliferative lupus nephritis) and in patients with class III and IV (proliferative lupus nephritis) and in patients with class V (membranous lupus nephritis) showed statistically significant difference between the 3 grades (P < 0.05).Conclusion:Anti-C1q and IL-12are good biological markers in SLE patients that correlated with disease activity and renal involvement and are a good predictors for development of lupus nephritis.
Keywords:
SLE, Lupus nephritis, Anti C1qAb, IL-12
Cite this paper: Mohamed N. AL Alfy, Mohamed S. AL Hakim, Ashraf T. Abd Elmouttaleb, Ebrahim M. Bayomy, Abdelraouf A. Abonar, Mohamed A. Abood, Study of Interleukin-12 Cytokine and Anti-C1q Antibodies in Lupus Nephritis Patients, International Journal of Internal Medicine, Vol. 3 No. 1, 2014, pp. 13-26. doi: 10.5923/j.ijim.20140301.03.
1. Introduction
SLE is an auto immune connective tissue disorder with a wide range of clinical features, which predominantly affects women. Diagnosis is based on clinical features and laboratory investigations [1].Renal involvement usually develops in the first few years of illness, and should be detected early by periodic urine analyses, quantitation of proteinuria, and estimation of the glomerular filtration rate (usually by monitoring the plasma creatinine concentration) [2].Glomerulonephritis is a major determinant of the course and prognosis of SLE and is clinically evident in 40-85% of patients [3]. Several auto antibodies, especially those against double stranded DNA (anti-ds DNA) are believed to play a major role in the induction of glomerular inflammation [4].Complement 1q is the first component of the classical pathway of complement activation and its main function is to clear immune complexes from tissues and self-antigens generated during apoptosis [5].Complement activation mediates much of the characteristic end organ effects, but early complement components are required to protect against the development of SLE. Between 90% and 95% of C4 or C1 deficient individuals develop SLE, and approximately 30% of C2 deficient individuals develop SLE [6], C1q gene is located on chromosome 1q 36.3; C1r and C1s are linked together on chromosome 12 p 13 and C4 and C2 map within the class III region of MHC [7].Antibodies to complement-1q (Anti-C1q-Ab) directed against the collagen-like region of q subunit of C1 is thought to be able to contribute to renal involvement in SLE [8]. Anti-C1q auto antibodies have been proposed as useful marker in SLE since their occurrence correlates with renal involvement and possibly with nephritic activity [9].An antibodies directed to Clq (anti-Clq) were reported in the serum of patients with SLE, with a prevalence ranging from 34% to 47%, and in patients withhypocomplementaemic urticarial vasculitis syndrome (HUVS) with a prevalence of 100% [3].Imbalance of cytokine homeostasis and disruption of T-helper I and II cytokines is a prominent feature of SLE. SLE is believed to be a T-helper II driven disease, however recent findings suggest that T-helper I cytokines exert the major nephritogenic role [10].IL-12 cytokine produced by macrophages and dendritic cells triggers intra-renal inflammation and promotes cytokine imbalance; its increased production is closely associated with the presence and severity of lupus nephritis [11].IL-4, inducing differentiation to Th2 and IL-12, inducing differentiation to Thl cells are noted as cytokines regulating Thl- or Th2-derived cytokines. It is possible that IL-4 or IL-12 relate to the variation of Thl or Th2 cytokines in each SLE patient [12].Current laboratory markers for lupus nephritis are unsatisfactory. They lack sensitivity and specificity for differentiating renal activity and damage in lupus nephritis. Significant kidney damage can occur before renal function is impaired and first detection by laboratory parameters. Renal biopsy is the gold standard for providing information on the histological classes of lupus nephritis and the relative degree of activity and chronicity in the glomeruli. However, it is invasive and serial biopsies that are impractical in the monitoring of lupus nephritis. Thus, novel biomarkers that are able to discriminate lupus renal activity and its severity, predict renal flares and monitor treatment response and disease progress are clearly necessary [13].The present study is planned to evaluate the biological markers (IL-12 cytokine and anti-C1q antibodies) in lupus nephritis patients and their correlation to SLE disease activity.
2. Patients and Methods
The present study was conducted on 51 female patients with systemic lupus erythematosus (SLE) attending the outpatient clinics or were admitted to the inpatient units of the Internal Medicine, Rheumatology and Rehabilitation Departments, Faculties of Medicine, Al Azhar University.Inclusion and exclusion criteria:All the study patients fulfilled the criteria of the American Rheumatism association for lupus with exclusion of those not fulfilling, also we excluded those with other auto immune diseases, infections, diabetes, hypertension, drug and toxin exposure.The SLE Patients were divided into two groups;● Group I: 30 SLE Patients with nephritis.● Group II: 21SLE patients without nephritis.All patients fulfilled the revised American Rheumatism Association criteria for SLE. The proposed classification is based on 11 criteria. For the purpose of identifying patients in clinical studies, a person shall be said to have SLE if any 4 or more of 11 criteria are present, serially or simultaneously, during any interval of observation [14].Diagnosis of lupus nephritis is based on clinical and laboratory manifestations that meet American College of Rheumatology (ACR) criteria. ● Group III (control group): 20 age and sex matching controls were included; they were not suffering of any systemic autoimmune diseases excluded by history taking, normal complete blood count (CBC), Erythrocyte sedimentation rate (ESR) and Autoimmune profile (if required).Methods (Database for every patient included):(A) History taking.(B) Clinical examination especially, malar flush, photosensitivity, alopecia, oral ulcers, arthritis, Raynaud's phenomenon, pleurisy or pleural effusion, pericarditis or pericardial effusion, convulsions or cerebral accidents.(C) Laboratory investigations:1. Erythrocyte sedimentation rate (ESR): Estimation was done by the Westergren method recorded in mm/hr. The reading of the first hour was taken.2. Complete blood picture (CBC): using coulter counter (T660).3. Complete urine analysis: for Proteins, RBCs, WBCs, Casts (hyaline, granular, RBC, WBC).4. Estimation of the 24 hours urine proteins, Serum creatinine and blood urea by clinical chemistry fully automated Hitachi apparatus.5. Antinuclear antibodies (ANA) andAnti-deoxyribonucleic acid (DNA) antibodies were estimated by ELISA kits (Euroimmune Medzinsche Laboratory Diagnostica, AG, Lubech/Detschland, Germany).6. Quantitative determination of serum complements levels (C3, C4) by the turbidmetric method using kits of (Biokitincorp. / Barcelona, Spain). Normal values (C3: 90-180 mg/dl), (C4: 10-40 mg/dl).7. Anti C1q antibodies was tested in the sera of every patient and control group using the ELISA kit (manufactured by Orgentic Diagnostica Gmbh/Mainz - Germany). The lower detection for Anti Clq was determined at 0.5 U/ml, levels are considered elevated if > 10 U/ml.8. IL-12 were tested in the sera of every patient and control group using the ELISA kit (manufactured by Orgenium laboratories/ Helsinki - Finland).The levels of IL-12 were determined by comparison with a standard curve obtained using recombinant IL-12. This assay can measure > 10 pg/ml of IL-12.(D) Renal biopsy: Was performed for patients with persistent hypertension, rising creatinine levels, persistent hematuria, proteinuria, casts. The WHO classification of lupus nephritis was used to define the histological lesions. (E) Assessment of disease activity: Disease activity was assessed using SLEDAI. SLEDAI is a scale specific to assess disease activity in adults with SLE. It measures potentially reversible manifestations of the underlying inflammatory disease process. The scale consists of 24 'weighted' attributes grouped into 9 domains (organ systems) as follows weighting of 8 for central nervous system and vascular, 4 for renal and musculoskeletal, 2 for serosal, dermal and immunologic and 1 for constitutional and hematologic. If, during a 10-day period prior to the assessment, a patient manifests a clinical variable, then, the corresponding weighted score is assigned [15].Total SLEDAI score = …………. (Maximum of 105) A final weight total SLEDAI score is then calculated with a possible theoretic score of 105. The activity is classified as [15].(1) Mild activity: 1 - 10. (2) Moderate activity: 11 - 20. (3) Severe activity: 21- 45. (4) Very severe activity: > 45.(F) Statistical analyses of all results were done where P < 0.05 was considered significant and P > 0.05 was considered insignificant [16].
3. Results
Fifty one female patients having SLE were divided into 2 groups: group I (30 with lupus nephritis) and group II (21 patients without lupus nephritis) were included in this study. Their ages were ranged from 16 - 40 years with mean of 28.9±9.1 years in group I and from 14 - 43 years with mean of 26.24±7.97 years in group II. Twenty healthy female subjects were matched for age with SLE patients, their ages ranged from 17-54 years with mean 27.1±8.41 years.Some patients with SLE (group I and group II), who presented with lupus flares and life threatening complications during the study, received IV pulse steroid therapy in the form of methyl prednisolone in a dose of 500 mg to 1 g/day for 3-5 days±immunosuppressive treatments.All laboratory data of the control group included in the study were within normal values for CBC, kidney functions and urine analysis.On comparison between group I & II regarding clinical data including oral ulcers, arthritis, Raynaud's phenomena, pleurisy or pleural effusion, pericarditis or pericardial effusion, convulsions or cerebrovascular accidents, there were insignificant difference except for malar rash (P < 0.001), photosensitivity (P <0.001) and alopecia (P < 0.001), where their incidence in group II was higher than that in group I (table 6).| Table 1. Demographic data of SLE patients with lupus nephritis (group I) included in the study |
| | Variables | Range | Mean±SD | | Age (years) | 16 - 40 | 26.77±6.38 | | Duration of the disease (years) | 0.1 - 10 | 2.487±2.89 | | Steroid dose used (mg/day) | 10 - 60 | 29.5±16.14 | | Systolic blood pressure (SBP) in mmHg | 130 - 190 | 149.33±13.44 | | Diastolic blood pressure (DBP) in mmHg | 90 - 110 | 93.83±5.52 |
|
|
| Table 2. Laboratory data of group I included in the study |
| | Variables | Range | Mean±SD | | Hb (g/dl) | 7.0 - 12.6 | 9.67±1.31 | | WBCs (103/UL) | 2.3 - 12.4 | 6.16±2.38 | | Platelets (103/UL) | 70 - 370 | 166.30±70.41 | | Creatinine (mg/dl) | 0.4 - 2.3 | 1.3±0.5 | | 24-hrs urine proteins (g/dl) | 0.3 - 6.7 | 1.45±1.43 | | ESR (mm/hour) | 15 - 138 | 60.47±38.96 | | C3 (mg/dl) | 20 - 101 | 69.64±24.05 | | C4 (mg/dl) | 2 - 26 | 13.84±11.57 | | Positive ANA | 30 patients (100%) | | | Positive anti-ds DNA | 27 patients (90%) | |
|
|
| Table 3. Demographic data of SLE patients without nephritis (group II) |
| | Variables | Range | Mean±SD | | Age (years) | 14 - 43 | 26.24±7.97 | | Duration of the disease (years) | 0.2 - 14 | 3.32±3.61 | | Steroid dose use (mg/day) | 5 - 30 | 15.12±7.88 | | SBP (mmHg) | 120 - 150 | 128.81±7.89 | | DBP (mmHg) | 70 - 100 | 83.81±7.05 |
|
|
| Table 4. Laboratory data of group II patients included in the study |
| | Variables | Range | Mean±SD | | Hb (g/dl) | 8.9 - 13.3 | 11.13±1.38 | | WBCs (103/UL) | 3.4 - 12.5 | 6.30±2.54 | | Platelets (103/UL) | 160 - 632 | 326.19±95.88 | | Creatinine (mg/dl) | 0.4 - 1.5 | 0.67±0.2 | | 24-hour urine proteins (g/dl) | 0.1 - 0.3 | 0.19±0.05 | | ESR (mm/hr) | 15 - 117 | 38.10±24.09 | | C3 (mg/dl) | 37 - 100 | 83.89±14.21 | | C4 (mg/dl) | 5 - 18 | 14.20±3.29 | | Positive ANA | 21 patients (100%) | | | Positive anti ds DNA | 20 patients (95%) | |
|
|
| Table 5. Demographic data of group III (controls) included in the study |
| | Variables | Range | Mean±SD | | Age (years) | 17-54 | 27.10±8.41 | | SBP (mmHg) | 110-130 | 118.75±6.04 | | DBP (mmHg) | 70-80 | 74.50±4.97 |
|
|
| Table 6. Comparison between frequency of clinical data of group I & II |
| | Variables | Group I (n = 30) & (%) | Group II (n = 21) & (%) | P-value | | Malar rash | 13 (43.3) | 20 (95.2) | < 0.001* | | Photosensitivity | 11 (36.7) | 18 (85.7) | 0.001* | | Alopecia | 14 (46.7) | 19 (90.5) | 0.001* | | Oral ulcers | 12 (40.0) | 7 (33.3) | 0.628 | | Arthritis | 25 (83.3) | 21 (100) | 0.069 | | Raynaud's phenomena | 1 (3.3) | 0 (0.0) | > 0.999 | | Pleurisy or pleural effusion | 13 (43.3) | 5 (23.8) | 0.151 | | Pericarditis or pericardial effusion | 3 (10.0) | 1 (4.8) | 0.634 | | Convulsions or cerebrovascular accidents | 3 (10.0) | 2 (9.5) | > 0.999 |
|
|
The mean steroid intake in group I was 29.5±16.4 mg and that in group II was 15.12±7.88 mg, on comparison, this was statistically significant (P < 0.001, table 7 & figure 1). | Table 7. Comparison of steroid doses, SBP, DBP & SLEDAI in both groups |
| | Variables | Group I(n = 30) | Group II(n = 21) | P-value | | Steroid dose (mg/day) | 29.5±16.14 | 15.12±7.88 | 0.001* | | SBP (mmHg) | 149.33±13.44 | 128.81±7.89 | < 0.001* | | DBP (mmHg) | 93.83±5.52 | 83.81±7.05 | < 0.001* | | SLEDAI | 21.0±9.0 | 11.3±4.2 | 0.0001* |
|
|
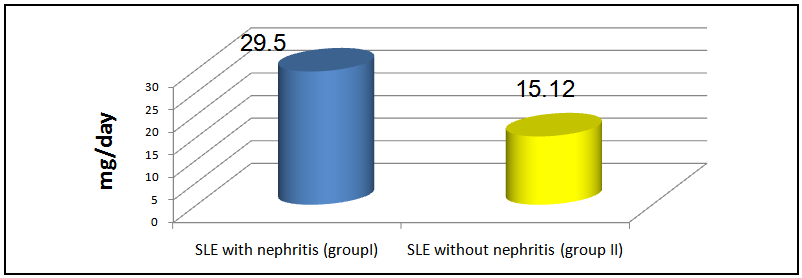 | Figure 1. Mean steroid doses (mg/day) in group I & II patients |
The mean level of SBP in group I was 149.33±13.44 mmHg and that in group II was 128.81±7.8 mmHg (P< 0.001), while the mean level of DBP in group I was 93.83±5.52 mmHg and that in group II is 83.81±7.05 mmHg, there was a significant difference between the 2 groups, (P < 0.001, table 7 & figure 2).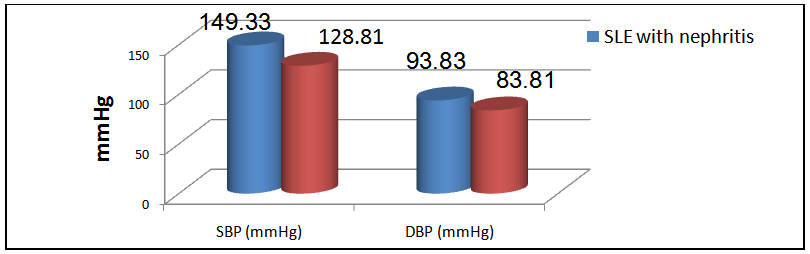 | Figure 2. Mean SBP & DBP in group I& II patients |
The mean SLEDAI score in group I was 21.0±9.0 and that in group II was 11.3±4.2 and this difference was statistically significant (P < 0.0001, table 7 & figure 3).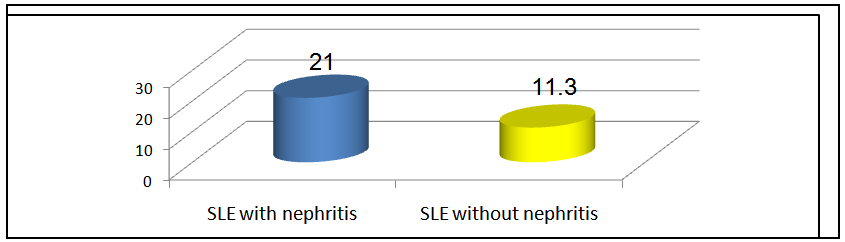 | Figure 3. Mean SLEDAI in group I & II patients |
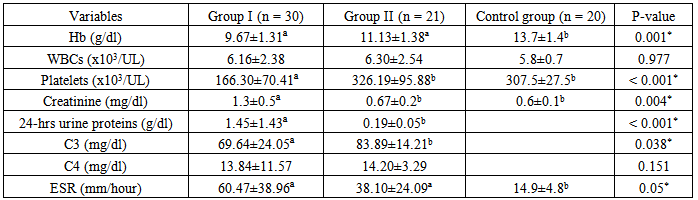
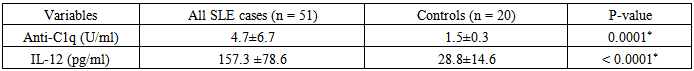
There was a significant difference in the mean level of Hb and ESR in group I & II compared to group III, in addition, there was a significant difference in platelet count and creatinine level of group I compared to group II and group III.The mean level of 24-hr urinary proteins in group I was 1.45±1.43g/24-hr and that in group II was 0.19±0.05 g/24hr, this comparison was statistically significant (P < 0.001).The mean level of C3 in group I was 69.64±24.05 & that in group II was 83.89±14.21, this difference was statistically significant (P<0.038).Levels of anti-C1q and IL-12 in different groups and their correlations:The mean level of anti-C1q in all SLE patients (group I plus group II) was 4.7±6.7 U/ml and in healthy subjects (group III) it was1.5±0.3 U/ml. This difference was statistically significant (P <0.0001, table 9 & figure 4). The mean level of IL-12 in all SLE patients was 157.3±78.6 pg/ml and that in healthy subjects was 28.8±14.6 pg/ml. This difference was statistically significant (P < 0.0001, table 9 & figure 4).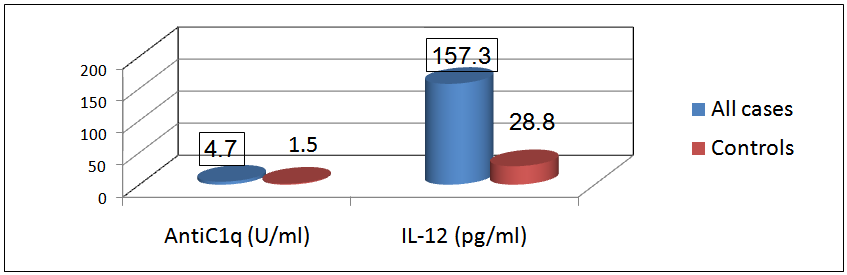 | Figure 4. Comparison between anti-C1q level (U/ml) & IL-12 (pg/ml) in patients (group I & II) & control group |
Table 8. Comparison of laboratory data in group I & II & control group
 |
| |
|
Table 9. Comparison of anti-C1q & IL-12 in all patients & controls
 |
| |
|
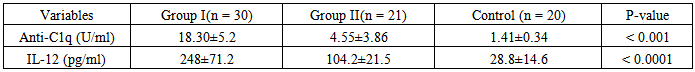
The mean level of anti-C1q in group I (patients with LN) was 18.3±5.2 U/ml, in group II (patients without LN) it was 4.55±3.86 U/ml and in group III it was 1.41±0.34 U/ml. On comparison this difference was statistically significant (P <0.001). The mean levels of IL-12 in group I was 248±71.2 pg/ml, in group II it was 104.2±21.5 pg /ml and in group III it was 28.8±14.6 pg /ml. On comparison this difference was statistically significant (P < 0.0001, table 10 & figure 5).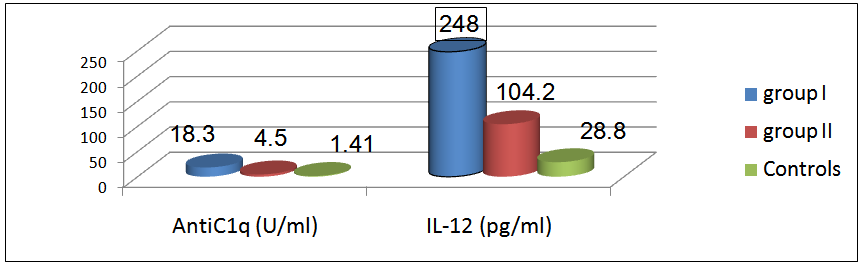 | Figure 5. Mean levels of anti-C1q (U/ml), IL-12 level (pg/ml) in all groups |
Table 10. Comparison of anti-C1q & IL-12 in all groups
 |
| |
|
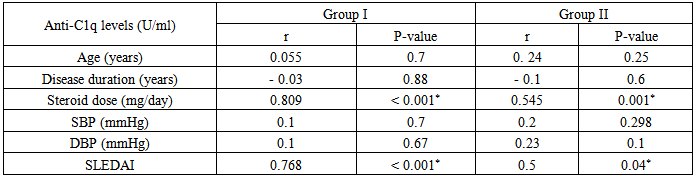
Insignificant statistical correlation were found between levels of anti-C1q in group I & group II versus some demographic and clinical parameters as:Age of patients: in group I (r = 0.055 & P < 0.7) & in group II (r = 0.24 & P < 0.25).SBP: in group I (r = 0.1 & P < 0.7) & in group II(r = 0.2 & P < 0.298).DBP: in group I (r= 0.1& P < 0.67) & in group II (r = 0.23& P < 0.1).Duration of the disease: showed insignificant negative correlation in group I (r = - 0.03 & P < 0.88) & in group II (r = - 0.1 & P < 0.6).A significant statistical correlation could be found between levels of anti-C1q in group I & group II versus some other parameters as:Dose of steroids (mg/day): showed significant positive correlation, in group I(r=0.809 &P <0.001) & in group II (r = 0.545 &P< 0.001).SLEDAI: showed significant positive correlation where in group I (r=0.7 &P <0.001) & in group II (r= 0.5 &P < 0.04), that’s to say patients with higher SLEDAI scores are more prone to have higher levels of anti-C1q (table 11).Table 11. Correlation of anti-C1q in group I & II, versus age, disease duration, steroid dose, SBP, DBP & SLEDAI
 |
| |
|
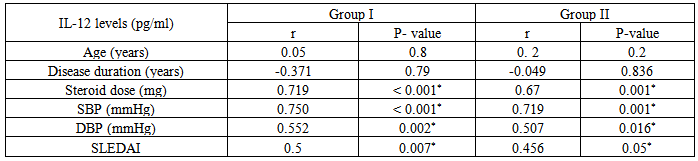
Insignificant statistical correlation were found between levels of IL-12 in group I & group II versus some demographic and clinical parameters as:Age of patients: in group I (r= 0.05 & P< 0.8) & in group II (r = 0.2 & P < 0.2).Disease duration: showed insignificant negative correlation in group I (r = - 0.371 & P < 0.79), and in group II (r = - 0.049 & P < 0.836). A significant statistical correlation was found between levels of IL-12 in group I & II versus some other parameters as:Dose of steroids (mg/day): showed significant positive correlation in group I (r = 0.719 & P < 0.001) & in group II (r = 0.67 & P <0.001). SBP: in group I (r = 0.750& P < 0.001) & in group II(r = 0.719 & P < 0.001).DBP: in group I (r = 0.552& P = 0.002) & in group II (r = 0.507 & P < 0.016).SLEDAI: showed significant positive correlation in group I (r = 0.5 & P< 0.007) & in group II (r = 0.456 & P < 0.05), that’s to say patients with higher SLEDAI scores are more prone to have higher levels of IL-12 (table 12).Table 12. Correlation of IL-12 in each of group I & II, versus age, duration & steroid dose, SBP, DBP & SLEDAI
 |
| |
|
Table 13. Correlation of anti-C1q in group I & II, versus Hb, WBC, platelets, creatinine & 24-hr urine proteins, C3, C4 & ESR
 |
| |
|
Table 14. Correlation of IL-12 in group I & II, versus Hb, WBC, platelets, creatinine, 24-hrurine proteins, C3, C4 &ESR
 |
| |
|
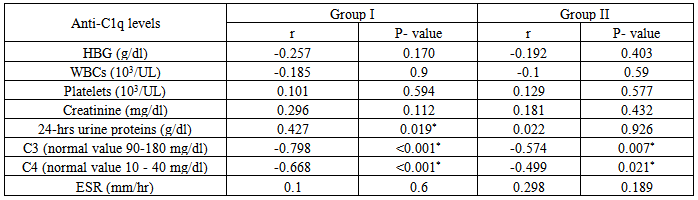
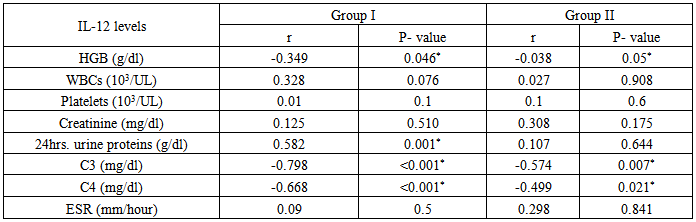
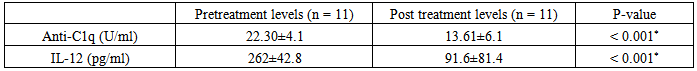
Table (14) showing correlation between levels of anti-C1q in group I & II versus some laboratory data of both groups:It showed positive correlation with the following parameters; however it was not statistically significant:Platelet count: in group I(r = 0.101 & P < 0.594) & in group II (r = 0.129 & P < 0.577).Creatinine level: in group I(r = 0.296 & P<0.112) & in group II (r = 0.181 & P< 0.432).ESR: in group I(r = 0.1 & P < 0.6) & in group II (r = 0.298 & P < 0.189).24-hr urinary protein level: in group II (r = 0.022 & P < 0.926), but it was statistically significant in group I (r = 0.427 & P < 0.019).It showed negative correlation with the following parameters; however it was not statistically significant:Hb: in group I(r = -0.257& P < 0.170) & in group II (r = - 0.192 & P < 0.403).WBC: in group I (r = -0.185 & P <0.9) & in group II (r = - 0.1 & P < 0.59).However it showed significant negative correlation with the following parameters:C3: in group I (r = - 0.798 & P < 0.001) & in group II (r = -0.574 & P < 0.007).C4: in group I(r = -0.668 & P < 0.001) & in group II (r = -0.499 & P< 0.021).Table (14) showing correlation of anti-IL-12 in group I & II & some laboratory data of both groups: It showed positive correlation with the following parameters; however it was not statistically significant:WBC: in group I (r = 0.328 & P < 0.076) & in group II (r = 0.027& P <0.908).Platelet count: in group I (r = 0. 01& P < 0.1) & in group II (r = 0.1 &P< 0.6).Creatinine level: in group I (r = 0.125 & P < 0.510) & in group II (r = 0.308 & P< 0.175).ESR: in group I(r = 0.09& P <0.5) & in group II (r = 0.298 &P< 0.841).24 hours urinary protein level: in group II(r=0.107 & P< 0. 644), however, it was statistically significant in group I (r = 0.582 & P < 0.001).It showed significant negative correlation with the following parameters:C3: in group I (r = - 0.798 & P < 0.001) & in group II (r = -0.574 & P < 0.007).C4: in group I (r = - 0.668 & P < 0.001) & in group II (r = - 0.499 &P< 0.021).Hb: in group I (r = - 0.349 &P< 0.046) & in group II (r = - 0.038 & P < 0.05).11Patientsfrom group I and 9 patients from group II, who suffered lupus flares were treated (with high doses of steroids ± immunosuppressive drugs) and were followed for short periods for 6-12 weeks to evaluate the effect of treatments on anti-C1q and IL-12 levels.In group I patients, the mean level of anti-C1q before treatment was 22.30±4.1U/ml and after treatment was 13.61±6.1 U/ml and this was statistically significant (P < 0.001), while IL-12 mean levels before treatment was 262±42.8 pg/ml and after treatment was 91.6±81.4 pg/ml and this was also statistically significant with (P < 0.00, table 15 & figure 6).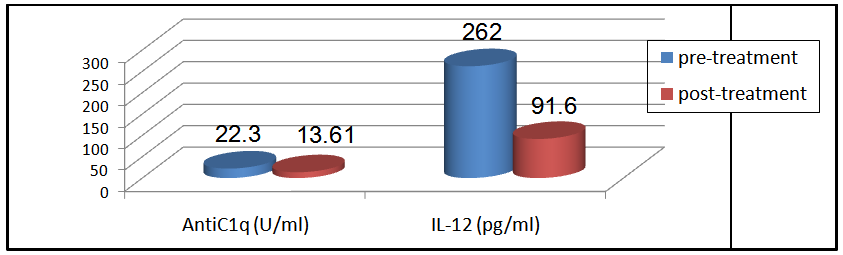 | Figure 6. Comparison between anti-C1q (U/ml) & IL-12 (pg/ml) for 11 patients in group I before & after treatment |
Table 15. Comparison of anti-C1q & IL-12 in 11 patients included in group I before & after treatment
 |
| |
|
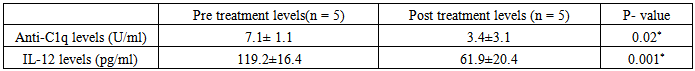
In group II patients, the mean level of anti-C1q before treatment was 7.1±1.1 U/ml and after treatment was 3.4±3.1U/ml and this was statistically significant (P < 0.02), while IL-12 mean levels before treatment was 119.2±16.4 pg/ml and after treatment was 61.9±20.4 pg/ml and this was also statistically significant (P < 0.001, table 16 & figure 7).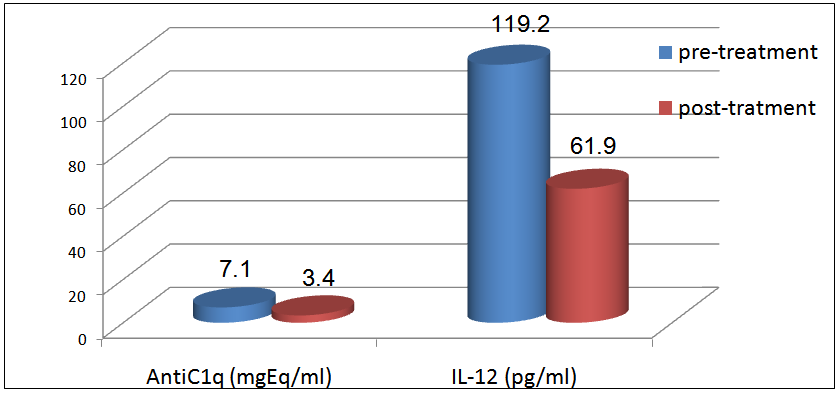 | Figure 7. Comparison between anti-C1q (U/ml) & IL-12 (pg/ml) for 5 patients in group II before& after treatment |
Table 16. Comparison of anti-C1q & IL -12 for 9 patients in group II before& after treatment
 |
| |
|
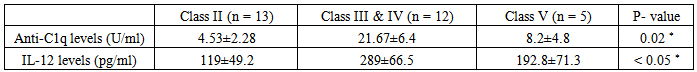
Comparison of anti-C1q & IL-12 in 12 patients with proliferative nephritis (class III & IV), 13 patients with non-proliferative lupus nephritis (class II) and 5 patients with membranous lupus nephritis (class V):The mean level of anti-C1q in patients with class II (non-proliferative nephritis) was 4.53±2.28 U/ml and the mean level of anti-C1q in patients with class III & IV (proliferative nephritis) was 21.67±6.4 U/ml, while the mean level of anti-C1q in patients with class V (membranous nephritis) was 8.2±4.8 with a statistically significant difference (P < 0.02, table 17 & figure 8).Also the mean level of IL-12 in patients with class II (non-proliferative nephritis) was 119±49.2 pg/ml and the mean level of IL-12 in patients with class III & IV (proliferative nephritis) was 289±66.5 pg/ml, while the mean level of IL-12 in patients with class V (membranous nephritis) was 192.8±71.3, with a statistically significant difference (P < 0.05, table 17 & figure 8).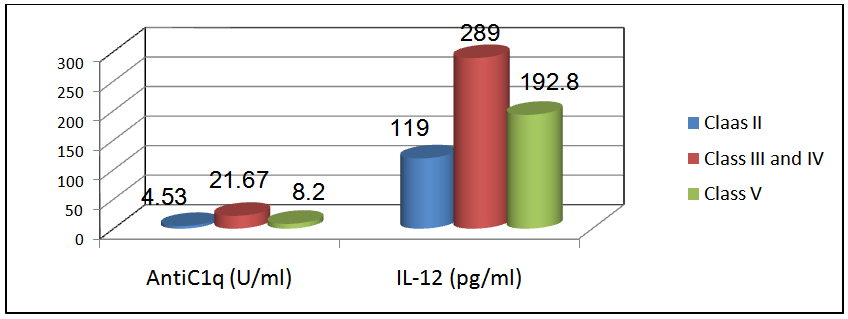 | Figure 8. Comparison of anti-C1q & IL-12 in patients with proliferative nephritis (class III & IV) versus patients with non-proliferative nephritis (class II) & patients with membranous nephritis (class V). These results showed that anti-C1q & IL-12were higher in patients with proliferative lupus nephritis (class III & IV) than membranous lupus nephritis (class V) & non- proliferative lupus nephritis (class II) |
Table 17. Comparison of anti-C1q & IL-12 in patients with proliferative lupus nephritis (class III & IV), versus patients with non-proliferative lupus nephritis (class II) & membranous lupus nephritis (class V)
 |
| |
|
4. Discussion
Systemic lupus erythematosus (SLE) is the prototypic multisystem autoimmune disorder with a broad spectrum of clinical presentations encompassing almost all organs and tissues. The extreme heterogeneity of the disease has led some investigators to propose that SLE represents a syndrome rather than a single disease. Diagnosis is based on clinical features and laboratory investigations [15].Numerous mechanisms appear to play a role in pathogenesis of SLE, once the critical threshold is reached; there is failure of immune system to down regulate the ensuing abnormal immune response [1].Current laboratory markers for lupus nephritis such as proteinuria, urine protein-to-creatinine ratio, creatinine clearance, anti-ds-DNA and complement levels are unsatisfactory. They lack sensitivity and specificity for differentiating renal activity and damage in lupus nephritis. Significant kidney damage can occur before renal function is impaired and first detection by laboratory parameters. Renal biopsy is the gold standard for providing information on the histological classes of lupus nephritis and the relative degree of activity and chronicity in the glomeruli. However, it is invasive and serial biopsies are impractical in the monitoring of lupus nephritis. Thus, novel biomarkers that are able to discriminate lupus renal activity and its severity, predict renal flares, monitor treatment response and disease progress are clearly necessary [13].The complement system is a major effector mechanism of the innate immune system and it plays an important role in immune defense. The biological functions of complement are opsonization and phagocytosis, stimulation of inflammatory reactions by anaphylatoxins and complement-mediated cytolysis of microbes, especially encapsulated bacteria [17]. One of the important physiological functions of the classical pathway of complement is the disposal of immune complexes and the products of inflammatory injury and recent data suggest a role for C1q in the clearance of apoptotic cells [3]. C1q is the first component of the classical pathway of complement activation. Together with the enzymatically active components C1r and C1s, C1q forms the C1 complex. Binding of C1 to immunoglobulinsin the form of immune complexes leads to; activation of proteases C1r and C1s and a further activation of the classical pathway of complement [17]. There is at present much interest in the hypothesis that a major source of the auto-antigens driving the immune response in SLEis the apoptotic cell. Binding of autoantibodies to the collagen-like region of C1q could interfere with activation of C1 and functionally resemble a C1q deficient state. This may provide a unifying explanation for the paradoxical finding that homozygousC1q deficiency causes SLE while many patients with SLE have anti-C1qAb. In both situations the interference with the putative physiological role ofC1q mediated clearance of apoptotic cells would result in autoimmunity [3].The strong correlation between anti-C1qAb and lupus nephritis appears to be a general finding in many studies. Anti-C1q antibodies have a very high prevalence in active proliferative lupus nephritis and a negative test result almost excludes active nephritis. In addition, anti-C1q antibodies seem to predict a relapse of lupus nephritis as soon as 6 months in advance [17]. Anti-C1qantibodies show a significant inverse correlation with levels of C1q, C3 and C4 and decreases in these components of the complement classical pathway are associated with active renal disease. In addition, anti-C1qantibodies had been recovered at necropsy from the glomeruli of patients with proliferative lupus nephritis. The available data suggest that autoantibodies against C1q have a definite role in the pathogenesis of lupus glomerular injury but so far we can only speculate how these antibodies exert their nephritogenic effect. Anti-C1q may either contribute to the formation of circulating immune complexes that are deposited in the kidneys or contribute to local formation of immune complexes on the glomerular basement membrane. By interfering with activation of the complement system through the classical pathway, anti-C1q may hamper immune complex solubilisation, further contributing to immune complex deposition in the kidney [3].There is growing evidence that cytokines and chemokines play vital roles in the initiation and continuation of autoimmune disorders such as SLE. A defective regulation of Th1 and Th2 cytokines has been found typically in SLE and a Th1/Th2 imbalance appears to be an important factor responsible for the pathophysiology in lupus nephritis [18]. It is widely recognized that naive CD4+ T cells become activated and differentiate into various effector T cell subsets after encountering a specific antigen, T helper type 1 (Th1), Th2, and Th17 cells, characterized by distinct patterns of cytokine production [19].A large number of studies suggested that SLE is a Th2-driven disease. However, elevation of both Th1 and Th2 cytokines occurs in both humans and mice suggesting that SLE is a complex disease [20].IL-12 is a pro-inflammatory70 kDa heterodimer cytokine (IL12-p70) produced by macrophages and dendritic cells (DC). In conjunction with IL-18, it promotes IFN-γ production and it is a connecting point for innate and adaptive immunity. IFN-γ is the key molecule that leads to polarization of peripheral cells toward aTh1 immune response, with subsequent development and progression of pathologic changes in diffuse proliferative lupus nephritis (DPLN, WHO class IV). n contrast to DPLN, there was no difference in the mean Th1:Th2 ratio between healthy controls and membranous lupus nephritis (MLN, WHO class V) with small number of cells, including IFN-γ cells, infiltrated the kidney compared with the degree of infiltration in DPLN [19].The role of IL-12 is still uncertain and it has been studied in only few cross sectional studies. Excessive IL-12 production compared to normal subjects has been found in patients with SLE in a number of studies. Urinary and serum IL-12 were correlated with the presence and severity of lupus nephritis.IL-12 was found in the mononuclear cells surrounding the glomeruli of classes IV and V lupus nephritis patients and they were absent in patients with minor glomerular lesions. As both macrophages and DC are major producers of IL-12, it was speculated that its local renal production may contribute to its elevated circulating levels [11]. Administration of IL-12 accelerates both glomerulonephritis and anti-ds-DNA antibodies production in NZB/WF1 mice. On the other hand, treatment with recombinant anti-IL-12 apparently ameliorates renal discussion disease [21]. These findings suggest that blockade of Th1 inducers might be therapeutically beneficial and the neutralization of IL-12could be of assistance in the treatment of proliferative lupus nephritis. Our study was designed to clarify the role of anti-C1q antibodies and IL-12 cytokine in SLE patients and to correlate them with lupus renal disease activity. This study was conducted on 51 patients diagnosed as SLE patients according to ACR criteria. All our patients were females. The SLE patients were divided into 2groups: Group I: 30 SLE patients with lupus nephritis and group II: 21 SLE patients without lupus nephritis. The mean age of group I was 26.77±6.38 years and their mean disease duration 2.487±2.89 years. The mean age of group II was 26.24±7.97 years and their mean disease duration 3.32±3.61years. Twenty healthy control subjects were matched for age with SLE patients; their mean age ranged was 27.10±8.41 years.In this study we compared the frequency of clinical data between group I and II and it was not statistically significant except in malar rash, photosensitivity and alopecia. This aforementioned data highlighted the muco-cutaneous manifestations of group II to be the main complaint. In addition we compared the laboratory data in group I and group II, regarding CBC, serum creatinine, 24-hrs urinary proteins, ESR, C3and C4. The results were statistically insignificant regarding CBC (except for platelets), ESR, C4, however platelets count and C3 were significantly lower and creatinine and 24-hrs urinary protein were significantly higher in group I. Another statistically significant difference between groups I and II; was the dose of steroid intake per day, the SBP and DBP and the SLEDAI score. An explanation to this is the increasing severity of disease in group I as renal disease is usually managed by high doses of steroids and associated with hypertension and other organ affection, thus raising SLEDAI score. Now, focusing on, the relation between anti-C1qAb and IL-12 cytokine and renal disease in SLE patients. First, we compared the mean level of anti-C1qAb in all SLE patients and the control group. The mean level in all SLE patients was 4.7±6.7 U/ml, while the mean level in the control was 1.5±0.3 U/ml. This comparison was statistically significant (P < 0.0001). Also the mean level of anti-C1qAb in group I was 18.30±5.2 (U/ml) which was significantly higher than that of group II where its mean level was 4.55±3.86 (U/ml). Our results coincide with Martoet al [3] where they found that higher titers were associated with the presence of nephritis. Also our results coincide with Sinicoet al [9] where they detected significant difference between the level of anti-C1q in patients with and those without nephritis. Anti-C1q autoantibodies have been proposed as a useful marker in SLE, this was proved by Sinico et al [9] who aimed to evaluate the prevalence of anti-C1q antibodies in patients with SLE, with and without renal involvement and to correlate the presence of these markers and the activity of the disease and nephropathy. They studied 61 patients with SLE, 40 patients had biopsy-proven lupus nephritis; 35 patients with other connective tissue diseases and 54 healthy controls. They found high anti-C1q antibody titers in 27 of 61 (44%), SLE patients and in 2% and 0% of normal controls and patients with other connective tissue diseases, respectively. In this study, the mean level of IL-12 in all SLE patients is157.3±78.6 pg/ml, while in control group it is 28.8±14.6 pg/ml, this difference is statistically significant (P<0.0001). Also the mean level of IL-12 in group I is 248±71.2 pg/ml which is significantly higher than that of group II where the mean level is 104.2±21.5 pg /ml. These results coincide with Tokanoet al22 and Wong et al [10], where they found that higher titers were associated with active SLE patients compared to normal subjects. Moreover, our results coincide with Tucciet al [11], where they detected significant difference between the level of IL-12 in patients with nephritis and those without nephritis. However, in contrast to Horwitzet al [23], who studied the profile of Th1 & Th2 cytokines produced by mononuclear cells from patients with recent onset SLE prior to initiation of corticosteroids and found decreased IL-12 production and increased IL-10.The decreased production of Th1 cytokines may be contributed to this imbalance between IL-10 and IL-12. A contributory role of dysfunctional CD8+ cells was suggested. After a short term follow up ranging between 6-12 weeks for 16 patients (11 patients in group I and 5 patients in group II) who suffered lupus flares during time of the study that required treatment (with high doses of steroids ± immunosuppressive drugs) to evaluate the effect of treatments on anti C1q & IL-12 Levels. In group I patients the mean level of anti C1q before treatment was 22.30±4.1 U/ml and after treatment was 13.61±6.1 U/ml and this was statistically significant (P <0.001). In group II patients the mean level of anti-C1q before treatment was 7.1±1.1 U/ml and after treatment was 3.4±3.1 U/ml and this was also statistically significant (P< 0.020), this coincides with Trendelenburget al [24], where they included 38 SLE patients with biopsy proven lupus nephritis that were followed for 6 - 12 months after renal biopsy. They found that there was a significant drop in anti- C1qAb titers in 36 patients between the time of biopsy and month +6 after treatments, but no further decrease between months +6 and +12. The 2 patients with persistently high titers of anti-C1qAb (>400U/ml) at months +6 with no sustained response to treatment underwent a second biopsy revealing a persistent lupus nephritis class III. These results show that treatment with steroids and immunosuppressive treatment could alter anti- C1qAb Levels. In the current study, IL-12 mean levels in group I before treatment was 262±42.8 pg/ml and after treatment was 91.6±81.4 pg/ml and this was statistically significant (P <0.001). In group II, the IL-12 mean level before treatment was 119.2±16.4 pg/ml and after treatment it was 61.9±20.4 pg/ml and this was also statistically significant (P< 0.001). Our results coincides Tokanoet al [22] who included 39 patients with SLE (3 males and 36 females, aged 23 - 37 years). They followed the change in IL-12 after therapy in 3 cases. These 3 patients received various doses of steroid (case 1; prednisolone 40 mg/day, case 2; prednisolone 40 mg/day, case 3; prednisolone 30 mg/day), and their disease activity was decreased (<3 points of SLEDAI). In these patients, the level of IL-12 in all 3 cases decreased with steroid therapy. However, the level of IL-12 never normalized. In discordance, Wonget al [10] did not found any significant differences between IL-12 levels in SLE patients treated and not treated with azathioprine, hydroxychloroquine or cyclosporine A, suggesting that IL-12 levels could be altered with steroids and not with other immunosuppressive treatments. In the present study, correlation between the level of anti-C1qAb and IL-12 and some demographic and clinical parameters like age of patients, duration of disease, SBP and DBP did not reach statistical significance, however they reached statistical significance with the dose of steroid intake per day and SLEDAI in both groups I and II. Our results coincide with Moscaet al [25] where they found significant positive correlation between disease activity and level of anti-C1qAb. In contrast to Martoet al [3], who found insignificant positive correlation between disease activity and level of anti-C1q, this may be explained that they used large number of patients without any previous renal involvement and may be with lower SLEDAI score, however half of our patients had renal involvement, therefore high levels of anti-C1q are associated with higher SLEDAI scores; thus we can use anti-C1qAb not only for monitoring the nephritis but also as reflection for disease activity in general. Shah et al [26] also found significant positive correlation between SLEDAI and the level of a number of cytokines including IL-12 and IFN-γ, IL-6 and IL-10. In contradiction to Jain et al [27] who found no correlation between IL-12 levels and SLEDAI, while Tie and Brian [28] showed that IL-12 production was inversely correlated with SLEDAI, IL-10 and anti-ds-DNA antibody level but correlated positively with IFN-γ production. Also by studying the correlation between level of anti-C1q in group I and II and some laboratory data of both groups, it showed positive discussion correlation however it was statistically insignificant with the following: ESR, platelet, creatinine and 24-hr urinary protein(in group II). This coincides with Martoet al [3] who found insignificant correlation with creatinine and 24-hr urinary protein and level of anti C1qAb. Also our results showed negative correlation with level of Hb, WBC, C3 and C4. It was only statistically significant with C3 and C4. This coincides with Martoet al [3] who found significant negative correlation with C3 and C4. Our results also go with obtained by Moscaet al [25] as they found negative correlation with complement and WBC. This could be attributed to that with higher levels of anti-C1qAb, complexes are formed with other complement cascade, thus decreasing their level in the blood which all reflect active inflammatory event. In our study we compared the levels of anti-C1qAb and IL-12 in grade II as representative of non-proliferative lupus nephritis and grade III and IV as prototype of proliferative lupus nephritis and grade V (membranous lupus nephritis);regarding Anti-C1qAb there was statistical significant difference between the 3 classes (P < 0.02). Our results coincide with Gunnarssonet al [29] who reported that 11 out of 18 patients with biopsy proven proliferative lupus nephritis had anti-C1q Ab. However, they reported simultaneously that C1q was low in most of these patients and correlated inversely with anti-C1qAb (P<0.0009). This coincides with Zhang et al [30] who found that serum C1qAb level of the type IV lupus nephritis patients was significantly higher than that in the type II lupus nephritis patients (P < 0.05). Our results also go with Moroniet al [31] who found that in proliferative lupus nephritis, anti- C1q antibodies showed a discussion better sensitivity and specificity (80.5 and 71% respectively) for the diagnosis of renal flares. Trendelenburget al [24] investigated adult SLE patients undergoing renal biopsy for suspected active lupus nephritis. Serum samples were taken at the time of the biopsy and analyzed for the presence of anti-C1qAb in a standardized way. The activity of lupus nephritis was classified according to the renal histology. Their results were all but one patient with active proliferative lupus nephritis were positive for anti-C1q (97.2%) compared with the 35% of control SLE patients with inactive lupus nephritis and 25% of SLE patients without lupus nephritis ever. They found a high prevalence of anti-C1qAb in biopsy proven active lupus nephritis at the time of the biopsy. The absence of anti-C1qAb argues strongly against the presence of proliferative lupus nephritis and therefore may serve as a tool to avoid unnecessary renal biopsies and/or treatment intensifications. Ideally, the diagnosis of renal flares should be based on kidney biopsy, but because of its potential complications, this invasive procedure cannot be repeated too frequently. Thus the monitoring of anti-C1qAb after the diagnosis of SLE might be helpful and represents a non-invasive biological marker in the follow-up of SLE patients Trendelenburg et al [24]. Also anti-C1qAb is more specific for renal flares than anti-DNA; this was supported with Martoet al [3] who suggested that there was no difference in prevalence of anti-ds-DNA in patients with and without nephritis, supporting previous evidence of the superior specificity and value of anti-C1q over anti-ds-DNA for renal flares. Anti-C1q is slightly better than the other tests (anti-ds-DNA, C3 and C4) to confirm the clinical activity of lupus nephritis, particularly in patients with proliferative LNMoroni et al [31].Our results were in discordance to those of Martoet al [3] who did not find differences in the prevalence or levels of anti-C1q when comparing proliferative and non-proliferative forms of nephritis. They suggested that their previous results were drawn from a small number of patients particularly those with non-proliferative nephritis and that do not hold true in a large patient cohort. The same comparison was done with IL-12 and showed that the mean level of IL-12 in patients with class II (non-proliferative lupus nephritis) was 119±49.2 pg/ml and the mean level of IL-12 in patients with class III and IV (proliferative lupus nephritis) was 289±66.5 pg/ml, while the mean level of IL-12 in patients with class V (membranous lupus nephritis) was 192.8±71.3 pg/ml, with a statistically significant difference between them where P < 0.05. Our results coincide with Tucci et al [11] who included 150 SLE patients and 69 matched normal controls and showed that the highest IL-12 p 70 content (the biologically active form of IL-12) was found in subsets IV (853 - 967 pg/ml; P< 0·05) and V (659.8 - 460 pg/ml; P< 0·05), followed by subset III (445 - 150 pg/ml) and subset II (348 - 137 pg/ml). The urinary IL-12p70 levels were higher in SLE patients with LN and correlate with its severity and histological activity in those with proliferative lupus nephritis. Thus, urinary IL-12p70 reflects both its serum and its glomerular accumulation. Similarly, serum IFN-γ was higher in subset IV LN whereas the values of the other subsets were similar to those patients without lupus nephritis. Lastly, a positive correlation between serum IL-12p70 and IFN- γ pointed to their concurrent production in LN. Treatment with steroids and immunosuppressive treatment in our follow up for SLE patients could alter anti- C1qAb and IL-12 levels with a significant drop of anti-C1qAb and IL-12 titers. We therefore, could conclude from our data and the other for mentioned similar studies that anti-C1q and IL-12 are good biological markers in SLE patients that correlated well with SLEDAI scores and with renal involvement. Also, Anti-C1qAb is slightly better than the other tests (anti-ds-DNA, C3 and C4) to confirm the clinical activity of lupus nephritis, particularly in patients with proliferative lupus nephritis, so anti-C1qAb should be closely monitored for early detection of renal flares and proper management and the neutralization of IL-12could be of assistance in the treatment of proliferative lupus nephritis.
5. Conclusions
Measuring anti-C1qAb and IL-12 cytokine are easy tests for follow-up and monitoring of disease activity in SLE as they correlated significantly with SLEDAI and also they are useful to identify a subgroup of SLE patients at risk for renal disease. Monitoring anti-C1q and IL-12 titers are potentially more helpful in the early diagnosis of nephritis or the prediction of renal flares than the currently employed indices of disease activity. Future directions in SLE biomarker research should focus on a combination of novel markers with conventional clinical parameters to enhance the sensitivity and specificity for the prediction of renal flares and prognosis in lupus nephritis.
References
| [1] | D'Cruz D, Khamasha M and Hughes G., (2007): SLE. Lancet: 369: 587- 596. |
| [2] | Weening JJ, D'Agati VD, Schwartz MM, Seshan SV, Alpers CE, Appel GB., (2004): The classification of glomerulonephritis in systemic lupus erythematosus revisited. J Am SocNephrol. Feb; 15(2):241-50. |
| [3] | Marto N, Berto M, Laccini E., Calabuig R, Hughes M, (2005): Anti C1q antibodies in nephritis: correlation between titers and renal disease activity and positive predictive value in SLE. Ann Rheum Dis: 64: 444 - 448. |
| [4] | Hahn H, Mcmahon A, Wilkinson A et al., (2012): American College of Rheumatology Guidelines for screening, Treatment and management of lupus Nephritis. Arthitis Care and Research: Vol.64, No.6: 797 - 808. |
| [5] | Walport M., (2001): Complement part 1.N Engl. J. Med: 344:1058 - 1066. |
| [6] | Sullivan KE. (2000): Systemic lupus erythematosus. Genetics of systemic lupus erythematosus. Clinical implications. Rheumatic Diseases Clinics of North America; 26 (2), May. |
| [7] | Tan KK. And Arnett FC. (1998): The genetics of lupus. Current Opinion in Rheumatology; 10: 399-408. |
| [8] | Jaekel H, Trabandt A, Grobe N and Werle E., (2006): Anti-ds-DNA antibody subtypes and anti C1q antibodies: toward a more reliable diagnosis and monitoring of SLE and lupus nephritis. Lupus: Dec 15; 335 - 345. |
| [9] | Sinico R, Radice A, Ikehata M, Giammarresi G, Corace C, Arrigo G, Bollini B, Li Vecchi M, (2005):Anti-C1q autoantibodies in lupus nephritis: prevalence and clinical significance. Ann NY AcadSci: 1050: 193 - 200. |
| [10] | Wong C, Ho C and Lie k., (2000): Elevation of pro-inflammatory cytokines (IL-18, IL-18) and Th2 cytokines (IL-4) Concentrations in patients SLE. Lupus: 9: 589 - 593. |
| [11] | Tucci M, Lomardi L, Richards H and Silvestris F., (2008): Overexpression of IL-12 and T helper 1 predomminance in lupus nephritis. Clin ExpImmunol: 154 (2): 247 - 254. |
| [12] | Heinzel FP, Schoenhaut DS, Rerko RM, Rosser LE, Gately MK., (1993): Recombinant interleukin - 12 cures mice infected with Leishmania major. J Exp Med; 177: 1505-9. |
| [13] | Chi Chiu M, (2010): Biomarkers for lupus nephritis: A critical appraisal. J Biomed Biotechnol; 10: 1155 - 1165. |
| [14] | Tan E, Cohen A and Fries J, (1982): Revised criteria for SLE classification. Arthritis Rheum: 25: 1272 - 1277. |
| [15] | Bertsias G, Salmon J and Boumpas D., (2010): Therapeutic opportunities in SLE: state of the art and prospects for the new decade. Ann Rheum Dis; 69: 1603 – 1611. |
| [16] | Knapp R and Miller M, (1992): Clinical Epidemiology and Biostatistics. Baltimore: Williams & Wilkins. Malvern, Pa.: Harwal Pub. Co., p112. |
| [17] | Potlukova E and Kralikova P., (2008): Complement component C1q and Anti-C1q Antibodies in Theory and in clinical P ractice. Scandinavian Journal of Immunology; 67(5): 423 - 430. |
| [18] | Tucci M, Ciavarella S, Dammacco F and Silvestris F., (2009): Oversecretion of cytokines and chemokines in lupus nephritis is regulated by intra -parenchymal dendritic cells: a review. Annals of New York Academy of Science: vol.1173, 449 - 457. |
| [19] | Katsuhisa M, Mitsuteru A and Hitoshi R, (2011): Th1 subset balance in lupus Nephritis. Journal of Biomedicine and Biotechnology: Article ID; 980286, 7 pages. |
| [20] | Chang J, Segal B, Nakanishi K, Okamura H and Shevach E., (2000): The co-stimulatory effect of IL-18 on the induction of antigen-specific IFN-γ production by resting T cells is IL-12 dependent and is mediated by up regulation of the IL-12 receptor β2 subunit. European Journal of immunology: vol.30, no. 4: 1113 - 1119. |
| [21] | Kikawada E, Lenda D and Kelley V, (2003): IL-12 deficiency in MRL faslpr mice delays nephritis and intrarenal IFN-γ expression and diminishes systemic pathology. Journal of Immunology: vol.170, no.7: 3915 - 3925. |
| [22] | Tokano Y, Morimoto S, Kaneko H, Amano H, Nozawa K, Takasaki Y and Hashimoto H., (1999):Levels of IL-12 in the sera of patients with SLE-relation to Th1-and Th2-derived cytokines. Clin ExpImmunol: 116: 169 - 173. |
| [23] | Horwitz D, Gray J, Behrendsen S, Kubin M and Trinchieri G., (1998): Decreased production of IL-12 and other Th1 type cytokine in patients with recent-onset SLE. Arthritis Rheum: 4195: 838 - 844. |
| [24] | Trendelenburg M, Margarita L, Regenass V et al., (2006): High prevalence of anti C1q antibodies in biopsy-proven active lupus nephritis. Nephrol Dial Transplant; 21: 3115-3121. |
| [25] | Mosca M Chimenti D, pratesi F, Baldini C, Anzilotti C, Bombardieri S, Migliorini P., (2006): Prevalence and clinico-serological correlations of anti-alpha-enolase, anti-C1q, and anti-dsDNA antibodies in patients with systemic lupus erythematosus. J Rheumatol: 33 (4): 69 - 73. |
| [26] | Shah D, Wanchu A and Bhatnager A., (2011): Interplay of cytokines in the pathogenesis of systemic lupus erythematosus. American journal of immunology: 7(3): 29 - 38. |
| [27] | Jain, Manish, Mcdonnell, Erin, Buyon P, Clancy, Robert M., (2010): IL-12 correlates with atherosclerosis independent of disease activity in SLE. Arthritis and Rheumatism: 6 -11. |
| [28] | Tie Fu Liu and Brian M Jones., (1998): Impaired production of IL-12 in SLE. Cytokines: 148 - 153. |
| [29] | Gunnarsson I, Sundelin B, Heimburger M et al., (2002): Repeated renal biopsy in proliferative lupus nephritis-predictive role of serumC1q and albminuria. J Rheumatol: 29: 693 - 699. |
| [30] | Zhang F, Zhou B and Dong Y., (2005): The roles of complement 1q and anti-C1q autoantibodies in pathogenesis of lupus nephritis. Zhonghua Yi xue ZaZhi: 85 (14): 955 - 959. |
| [31] | Moroni G, Radice A, Giammarresi G, Gallelli B, Leoni A, Vecchi M, Messa P, Sinico R., (2009): Are laboratory tests useful for monitoring the activity of lupus nephritic? Ann rheum Dis: Feb: 68 (2): 234 - 237. |
 Abstract
 Reference
 Full-Text PDF
 Full-text HTML