-
Paper Information
- Paper Submission
-
Journal Information
- About This Journal
- Editorial Board
- Current Issue
- Archive
- Author Guidelines
- Contact Us
International Journal of Internal Medicine
p-ISSN: 2326-1064 e-ISSN: 2326-1072
2012; 1(4): 37-41
doi: 10.5923/j.ijim.20120104.01
Electrocardiography – Pericarditis, Pericardial Effusion and Cardiac Tamponade
 Abstract
 Reference
 Full-Text PDF
 Full-Text HTML
Sharan Badiger1, Prema T. Akkasaligar2, Biradar MS1
1Department of Medicine, BLDE University's, Sri.B.M.Patil Medical College, Bijapur, 586103, Karnataka, India
2Department of Computer Science, B.L.D.E.A’s Dr.P.G.H.Engineering College, Bijapur, 586103, Karnataka, India
Correspondence to: Sharan Badiger, Department of Medicine, BLDE University's, Sri.B.M.Patil Medical College, Bijapur, 586103, Karnataka, India.
| Email: |  |
Copyright © 2012 Scientific & Academic Publishing. All Rights Reserved.
Patients with pericardial effusions may quickly progress to cardiac tamponade. These conditions are often difficult to diagnose, although physical examination and chest radiography are known to be poorly diagnostic of pericardial effusion. Advanced imaging techniques can accurately detect and quantify the size of pericardial effusions. Unfortunately, these advanced techniques are expensive and are often not feasible as screening tests for pericardial effusion. In contrast, 12-lead electrocardiogram is inexpensive and is easily performed, but to our knowledge, its diagnostic value for pericardial effusion and cardiac tamponade has not been systematically examined. Pericarditis, pericardial effusion, and cardiac tamponade are associated with various electrocardiographic signs. Low voltage, PR segment depression, ST-T changes and electrical alternans have each been diagnostic of pericardial effusion and /or cardiac tamponade. However, many of the studies that previously investigated these electrocardiographic signs examined patient populations. The diagnostic value of 12-lead electrocardiogram for pericarditis, pericardial effusion and cardiac tamponade has been reviewed in this article.
Keywords: Cardiac Tamponade, Electrocardiogram, Pericarditis, Pericardial Effusion
Cite this paper: Sharan Badiger, Prema T. Akkasaligar, Biradar MS, "Electrocardiography – Pericarditis, Pericardial Effusion and Cardiac Tamponade", International Journal of Internal Medicine, Vol. 1 No. 4, 2012, pp. 37-41. doi: 10.5923/j.ijim.20120104.01.
Article Outline
1. Introduction
- This clinician relies heavily on techniques in diagnosing pericardial disease that demonstrate the presence of pericardial effusion. Currently available investigative tools that aid in the detection of pericardial effusion include electrocardiography, echocardiography, chest X-ray, cardiac fluoroscopy, computerized tomography, magnetic resonance imaging, radionuclide scanning and pericardiocentesis. Routine 12-lead electrocardiography and chest X-ray are available and the most commonly used screening investigations in cardiac assessment. Accordingly, the review was undertaken to mechanisms of these electrocardiographic changes in the detection of pericardial effusion and its complications[1]. The electrocardiogram (ECG) in cardiac tamponade shows sinus tachycardia, low voltage, and, if pericarditis is present, the electrocardiogram findings typical of that disorder. Electrical alternans is relatively specific but not very sensitive for tamponade; rarely, this phenomenon is seen with very large pericardial effusions alone[2, 3]. The beat-to-beat alterations in the QRS complex is characteristic of electrical alternans and other electrocardiographic changes reflect the swinging of the heart in the pericardial fluid. It is suggested that low QRS voltage in patients with a pericardial effusion is actually a specific manifestation of tamponade, not of the effusion.In 90% of cases electrocardiogram abnormalities are seen and typically progress through four distinct stages. Stage 1. is ST segment elevation, with concavity upwards, or ‘saddle-shaped’. This electrocardiographic pattern is seen in all the leads except in V1 and AVR. Stage 2. is ST segment resolution. Stage 3. is widespread T wave inversion and Stage 4. is resolution of T wave. In 50% of cases depression of the PR interval occurs and is caused by atrial inflammation. It often appears in the early stages and is regarded as a pathognomonic feature of pericarditis. The ECG changes of pericarditis can be confused with those of acute myocardial infarction. However, changes in pericarditis are global and have no reciprocal ST depression or loss of R wave amplitude or Q wave formation[4].
2. Electrocardiography in Pericarditis
- The electrocardiography pattern in patients with pericarditis has been known for several decades. These electrocardiographic abnormalities produced by pericarditis evolve through several distinct stages that reflect different clinical and pathological phases of the disease. The electrocardiographic abnormalities produced by pericarditis can be attributed to 3 different factors as shown in (Table.1)[5]. A number of factors cause pericarditis including viral or bacterial infection, metastatic tumours, collagen vascular diseases, myocardial infarction, cardiac surgery, and uraemia The electrocardiographic changes of acute pericarditis are same in some ways that seen with acute myocardial infarction[5, 6]
2.1. ST Segment Elevation
- Acute pericarditis is usually characterized by ST segment elevations due to alterations in ventricular repolarisation in early phase of pericarditis. This electrocardiographic pattern is due to current of injury resulting from concomitant inflammation of the epicardium. ST elevation also occurs in acute myocardial infarction (MI) and early repolarisation.
2.2. Pericarditis versus Acute Myocardial Infarction
- The major difference between the electrocardiographic changes in pericarditis and acute myocardial infarction is their pattern of distribution. The ST segment elevations in acute myocardial infarction are characteristically limited to the localized area of the infarct that is anterolateral leads (I, aVL, V1 to V6) or the inferior (II, III, aVF) leads. But in pericarditis the ST-T changes are more generalized, occurring in both anterior and inferior leads. Pericarditis does not produce abnormal Q waves as seen with myocardial infarcts. The abnormal Q wave in myocardial infarction is due to death of heart muscle which leads due to loss of positive depolarization voltages. Pericarditis causes only superficial inflammation but not frank myocardial necrosis. So, abnormal Q waves are not seen unless there is associated myocarditis. The morphology and distribution sequence of the ST-T abnormalities help in distinguishing acute pericarditis from acute MI. The ST segment elevation in acute pericarditis is at the J point with its normal concavity upwards. The characteristic ECG pattern of acute MI is ST elevation often associated with convexity upwards (dome-shaped).
2.3. Pericarditis Versus Early Repolarisation
- The electrocardiographic changes in acute pericarditis must also be differentiated from those in the early repolarisation normal variant. One differentiating feature is that ST elevations occur in both the limb and precordial leads in most c, whereas about one-half of normal variants have no ST deviations in the limb leads[7]. In addition, PR deviation is present in acute pericarditis and evolution of the ST-T changes is not seen in early repolarisation.Another most reliable electrocardiographic predictor to differentiate between acute pericarditis and early repolarisation is the ratio of ST elevation to T wave amplitude in lead V6 which was more than 0.24 in acute pericarditis in a prospective study done by Ginzton, LE and Laks, M.[8].
2.4. PR Segment Elevation
- The repolarisation of the atria is also affected by acute pericarditis, which occurs during the PR segment that is from the end of the P wave to beginning of the QRS complex. Acute inflammation pericardium causes an atrial current of injury, which is reflected ECG by PR segment elevation in lead aVR and PR segment depression in other limb leads and in the left chest leads V5 and V6). Thus, PR segment and ST segment changes are typically in opposite directions in acute pericarditis. For example, in aVR, the PR segment is elevated (often by only 1 mm or so) while the ST segment is usually slightly depressed and other leads may show PR depression and ST elevation[9].
2.5. T Wave Inversion
- The ST segment elevations which are seen with acute pericarditis after a variable time is followed by T wave inversions, which may resolve completely with time with normalization of the ECG. But however, in some patients, the T wave inversions may persist for a prolonged period as in chronic pericarditis. This sequence of ST elevation followed by T wave elevation is the same as that described with myocardial infarction[9].
3. Effects of Pericardial Effusion
- Pericarditis usually the results to occurrence pericardial effusion. The major hemodynamic complication of pericardial effusion is cardiac tamponade. The most common ECG finding of pericardial effusion with or without cardiac tamponade is low voltage QRS complexes, probably due to short-circuiting of cardiac potentials by the fluid surrounding the heart. The presence of low voltage and sinus tachycardia should always raise concern about pericardial effusion with tamponade. Another ECG change that can occur with pericardial effusion and tamponade is electrical alternans. Electrical alternans with sinus tachycardia is a highly specific ECG finding of cardiac tamponade, but its absence does not exclude pericardial tamponade.
3.1. Low Voltage
- This has always been considered to be a valuable sign and is thought to depend on the pressure of a lake of fluid about the heart causing short circuiting effect. Low voltage is said to be present when the QRS amplitude is 5 mm or less in each lead. If the voltage remains low after the removal of fluid the decreased amplitude of the electrocardiographic deflections is probably due to the insulating effect of fibrin[10]. The low amplitude of the ventricular complex is frequently associated with normal amplitude of the P-wave in the limb leads. This may be explained by the absence of effusion over the posterior surface of atria, which is a part devoid of pericardial duplication.Internal short circuiting of the electrical currents by the accumulated fluid within the pericardial space change in the position of the heart[11], increasing distance from the current generator to the recording electrodes[12,13], decrease in cardiac chamber size and volume[14,15] and changes in the generation and propagation of electrical currents in the myocardium[14] are the several mechanisms have been proposed to explain the association between pericardial effusion and low QRS voltage. The mechanisms of low QRS voltage with pericardial effusion in an experimental approach have tried to clarify only by few investigators like Karatay[14], Friedman[16], Schlant and Hurst[17] and others.
3.2. Electrical Alternans
- The variations in the amplitude of the ventricular complex may be similar to the “electrical alternans” produced by an alternating configuration of the ventricular action potential or by alternating changes in intraventricular conduction. However, in pericarditis the “alternans” is apparently due to changes in cardiac position which result from the rotational, pendular motion of the heart. Normal rotation of the heart along the axis is attributed to the contraction of spiral muscle and the uncoiling of the large vessels. The motion is normally restrained by the relaxation filling and gentle pressure of the lung and mediastinum (Figure 1).
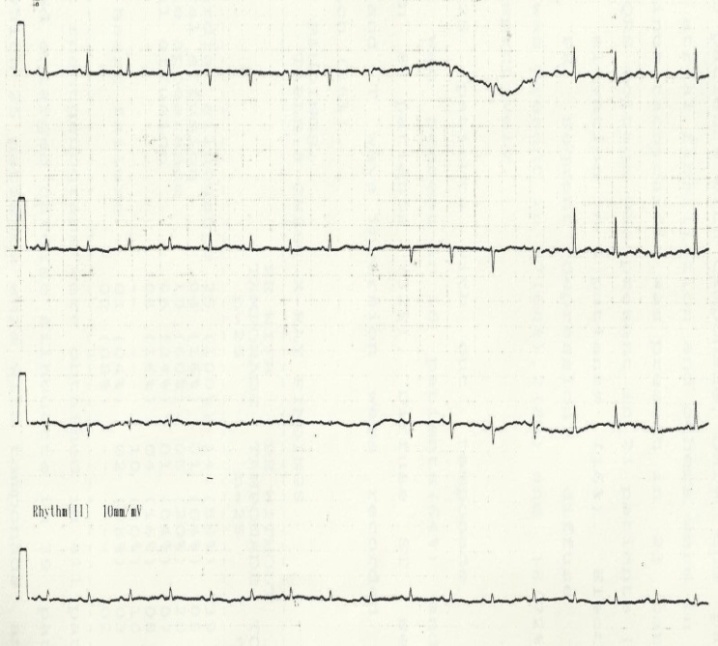 | Figure 1. Effects of pericardial effusion |
4. Effects of Pressure
4.1. Produced by Fluid or Fibrin
- Pressure on the myocardium produces a “Current of injury” that is manifested by deviation of the S-T segment from the base line. The resulting S-T vector is directed inferiorly and anteriorly. In horizontal heart the S-T vector tends to be parallel to the lead II axis and in vertical hearts to the lead III axis. The S-T deviation in pericarditis is usually less pronounced than in the early stages of myocardial infarction. It is seldom greater than 4-5 mm and monophasic patterns do not occur[20]. This suggests that the injury current in pericarditis is probably smaller than in acute myocardial infarction. At the same time, reciprocal depression of the S-T segment in pericarditis is recorded in fewer standard leads than in infarction.
4.2. Differentiation from Myocardial Infarction
- In myocardial infarction the terminal portion of the QRS complex is frequently obliterated and incorporated into the S-T segment. In pericarditis the configuration of the QRS complex remains unchanged, but the S-wave may be pulled up by the elevated S-T segment[10]. The shape of the T-wave in patients with the elevation of the S-T segment may be of greater diagnostic importance than the pattern of pulled S-wave. In acute stage of pericarditis the amplitude and shape of T-wave is usually changed and the elevated S-T segment is concave, but in acute infarction. The T-wave is frequently obliterated and the elevated S-T segment is convex. The most reliable method for distinguishing between pericarditis and myocardial infarction, however, is by calculating the ratio of the height of the ST-segment elevation in millimetre to the height of the T-wave amplitude in millimetre in lead V6. A ratio greater than 0.25 strongly suggests acute pericarditis[21].
4.3. Changes Attributed to Superficial Myocarditis
- Characteristically, the T-wave vector in pericarditis is directed to the right and superiorly. The T-wave in pericarditis is usually is inverted in more standard leads than in infarction. In typical cases of pericarditis the T-wave becomes inverted in all standard leads with the exception of aVR and V1. However in pericarditis the T-waves are usually less deeply or less completely inverted than in myocardial infarction. An incompletely inverted T-wave such as a diphasic wave or a notched T-wave is a characteristic feature of the electrocardiographic pattern in pericarditis[22, 23]. T-wave abnormalities of pericarditis can be differentiated from T-wave abnormalities of myocardial infarction because of following factors: 1) The myocardial surface responsible for the abnormal T- wave vector is greater in pericarditis than in myocardial infarction.2) The muscle mass responsible for the T- wave vector is smaller in pericarditis than in myocardial infarction.3) The inflammatory changes associated with pericarditis appear to produce myocardial damage more slowly and insidiously than the ischemic changes associated with myocardial infarction (Figure 2).
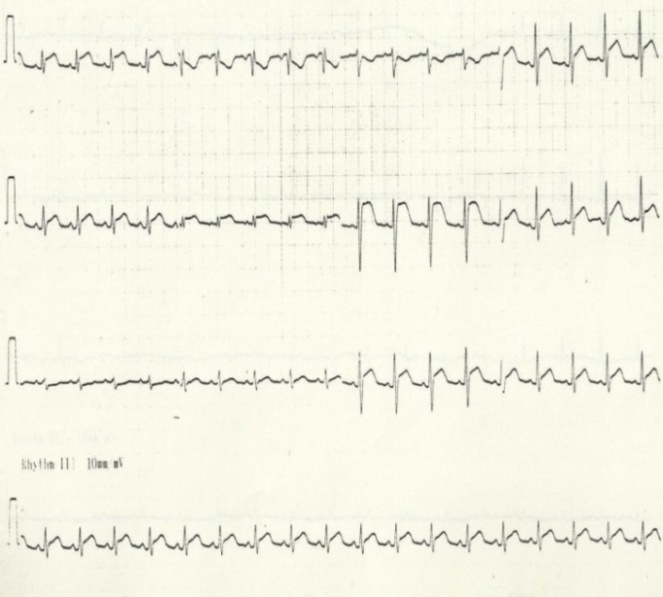 | Figure 2. Effects of pressure |
5. Incidence and Severity of ECG Abnormalities
- The incidence and the severity of the electrocardiographic abnormalities in pericarditis depend upon the origin of disease. Patients with chronic effusion may have no signs of pericarditis except for low voltage and low T-wave amplitude[24]. The typical pattern with S-T segment and T-wave changes occur in almost all acute non-specific or purulent pericarditis[10], in children[25] and in all patients with traumatic pericarditis[26]. The changes appear less frequently in rheumatic, uraemic and neoplastic pericarditis and in pericarditis after myocardial infarction and cardiac surgery. The lower incidence of characteristic electrocardiographic pattern in this type of pericarditis is due to a lower incidence or lesser severity of accompanying myocarditis. The duration of electrocardiographic changes produced by pericarditis depends on the cause and the extent of myocardial damage. Permanent electrocardiographic abnormalities occur more frequently after purulent, tuberculous and other type of pericarditis resulting in persistent adhesive or constrictive pericarditis. Atrial fibrillation or flutter is usually present in advanced stages of disease. Patients with sinus rhythm frequently have intra atrial conduction disturbances that produce “P” mitrale of mitral stenosis. However in patients with mitral stenosis and “P” mitrale the mean QRS axis is usually deviated to the right but in those with constrictive pericarditis the QRS vector is usually has an intermediate or left axis.Pericardial diseases can present clinically as acute pericarditis, pericardial effusion, cardiac tamponade, and constrictive pericarditis. Patients can subsequently develop chronic or recurrent pericarditis. Structural abnormalities including congenitally absent pericardium and pericardial cysts are usually asymptomatic and are uncommon. Clinicians are often faced with several diagnostic and management questions relating to the various pericardial syndromes[27].
6. Conclusions
- The diagnosis and management of pericardial diseases remains difficult because of the wide spectrum of clinical manifestations. This review article describes the usefulness of electrocardiographic diagnostic criteria and outline evidence-based treatment of major pericardial diseases. The typical electrocardiographic findings in acute pericarditis, including widespread upward concave ST-segment elevation and PR-segment depression. Sinus tachycardia, low-voltage QRS complex and electrical alternans electrocardiographic findings associated with cardiac tamponade. The diagnosis can be made on history and clinical examination, electrocardiogram, and laboratory tests in acute pericarditis. But when there is evidence of hemodynamic compromise and the diagnosis is equivocal additional imaging techniques like echocardiography, cardiac computed tomography and cardiac magnetic resonance imaging can be used. Echocardiography is diagnostic in cardiac tamponade and first-line of treatment in hemo-dynamically unstable patients is emergency pericardiocentesis.
ACKNOWLEDGEMENTS
- Authors acknowledge the immense co-operation and the help received from the scholars whose articles are cited and included in references of this manuscript. The author is also grateful to authors / editors / publishers of all those articles, journals and books from where the literature for this article has been reviewed and discussed.
References
| [1] | Manyari DE, Milliken JA, Colwell BT, Burggraf CW. Detection of pericardial effusion by chest roentgenography and electrocardiography versus echocardiography. Can Med Assoc J; 119, pp.445 – 450, 1978. |
| [2] | Hancock, EW. Sub acute effusive-constrictive pericarditis. Circulation; 43: pp.183, 1971. |
| [3] | Chou TC. Electrocardiography in Clinical Practice: Adults and Pediatrics; 4th Ed, WB Saunders, Philadelphia 1996. |
| [4] | Sean Spangler, George R Aronoff, Christopher A Fly, Acute Pericarditis. emedicine.medscape.com/article/156951. |
| [5] | Surawicz B, Lasseter KC. Electrocardiogram in pericarditis. Am. J. Cardiol.; 26:pp. 471-474, 1970. |
| [6] | Goldberger AL, Goldberger E. Clinical Electrocardiography, 5th ed. C V Mosby Year Book, St Louis, 1994. |
| [7] | Spodick, DH. Differential characteristics of the electrocardiogram in early repolarisation and acute pericarditis. N Engl J Med; 295: pp.523, 1976. |
| [8] | Ginzton, LE, Laks, M. The differential diagnosis of acute pericarditis from the normal variant: New electrocardiographic criteria. Circulation; 65: pp.1004, 1982. |
| [9] | Goldberger Ary L, Electrocardiogram in pericarditis and pericardial effusion. cmbi.bjmu.edu.cn/... Jan 9, 1996. |
| [10] | Lepeschkin E: Modern Echocardiography. Baltimore, Williams and Wilkins; 1, pp. 453-458, 1951. |
| [11] | Toney JC, Kolmen SN. Cardiac tamponade: fluid and pressure effects on electrocardiographic changes. Proc Soc Biol Med; 12: pp.642– 648, 1966. |
| [12] | Gonzalez MS, Basnight MA, Appleton CP, Carucci M, Henry C, Olajos M. Experimental cardiac tamponade: a hemodynamic and Doppler echocardiographic reexamination of the relation of right and left heart ejection dynamics to the phase of respiration. J Am Coll Cardiol;18: pp.143–52, 1991. |
| [13] | Rokey R, Vick GW, III, Bolli R, Lewandowski ED. Assessment of experimental pericardial effusion using nuclear magnetic resonance imaging techniques. Am Heart J;12: pp.1161–1169, 1991. |
| [14] | Karatay CM, Fruehan CT, Lighty GW, Jr, Spear RM, Smulyan H.Acute epicardial distension in pigs: effect of fluid conductance on body surface electrocardiogram QRS size. Cardiovasc Res; 27: pp.1033– 1038, 1993. |
| [15] | Brody DA. A theoretical analysis of intracavitary blood mass influence on the heart-lead relationship. Circ Res; 4: pp.731– 738, 1956. |
| [16] | Friedman HS, Lajam F, Calderon J, Zaman Q, Marino ND, Gomes JA. Electrocardiographic features of experimental cardiac tamponade in closed-chest dogs. Eur J Cardiol; 6: pp.311–22, 1977. |
| [17] | Schlant RC, Hurst MD. Advances in Electrocardiography. New York, NY: Grune and Stratton: pp.4–6, 1976. |
| [18] | Mc Gregor M, Baskind.E: Electric alternans in pericardial effusion. Circulation; 11: pp. 837-84, 1955. |
| [19] | Littmann, D. Alternation of the heart. Circulation; 27, pp.280, 1963. |
| [20] | Edward H. Schwab; George Herrmann, Alterations of the Electrocardiogram in diseases of the pericardium, Arch Intern Med.; 55 (6):pp. 917-941, 1935. |
| [21] | Narat R, Karnath BM. Clinical Signs of Acute Pericarditis and Its Complications. Hospital Physician; 43 (1), pp.45-50, 2007. |
| [22] | Noth P H, Barnes AR. Electrocardiographic changes associated with pericarditis Arch Intern Med.; 65 (2): pp. 291-320, 1940. |
| [23] | Winternitz M: Rhythmusstörungen bei bakterieller Endokarditis, Ztschr. f. Kreislaufforsch. 22: pp. 576, 1930. |
| [24] | Bedford, D. E. Chronic effusive pericarditis. Brit. Heart.J.; 26, pp. 499, 1964. |
| [25] | Nadas AS, Levy JM: Pericarditis in children Am. J.Cardiol.; 7, pp.109-115, 1961. |
| [26] | Tabatznik, B., Isaacs, J.P. Postpericardiotomy syndrome following traumatic haemopericardium. Amer. J. Cardiol.; 7, pp.83, 1961. |
| [27] | Khandaker MH, Espinosa RE, Nishimura RA, Sinak LJ, Hayes SN, Melduni RM, Oh JK; Pericardial Disease: Diagnosis and Management. Mayo Clin Proc.; 85(6): pp.572–593, 2010. |