-
Paper Information
- Paper Submission
-
Journal Information
- About This Journal
- Editorial Board
- Current Issue
- Archive
- Author Guidelines
- Contact Us
International Journal of Hydraulic Engineering
p-ISSN: 2169-9771 e-ISSN: 2169-9801
2024; 12(1): 1-8
doi:10.5923/j.ijhe.20241201.01
Received: Jul. 15, 2024; Accepted: Aug. 12, 2024; Published: Aug. 17, 2024

Estimation of the Flood Hydrograph of the Mahavavy River (Madagascar) During the Passage of Cyclone GAMANE in March 2024
Justin Ratsaramody
Laboratoire d'Hydraulique, École Supérieure Polytechnique, Université d'Antsiranana, Madagascar
Correspondence to: Justin Ratsaramody, Laboratoire d'Hydraulique, École Supérieure Polytechnique, Université d'Antsiranana, Madagascar.
| Email: |  |
Copyright © 2024 The Author(s). Published by Scientific & Academic Publishing.
This work is licensed under the Creative Commons Attribution International License (CC BY).
http://creativecommons.org/licenses/by/4.0/

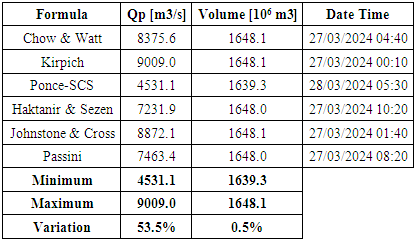
Cyclone GAMANE's passage through Madagascar from 15 to 29 March 2024 caused extensive damage and flooded large parts of the north and north-east of the country. Among the damage to infrastructure was the cutting of the bridge over the Mahavavy river on Route Nationale 6 in Ambilobe. If this bridge is to be rebuilt correctly and safely, we need to know at least the value of the peak flow that caused the bridge to break. This work then involved hydrological modelling of the ungauged catchment of the Mahavavy River using the HEC-HMS model to provide a reliable flood hydrograph for use as boundary conditions for hydrodynamic modelling. To this end, the Curve Number SCS method was used to evaluate losses, the SCS synthetic hydrograph for transformation into surface runoff and the Muskingum method for routing flows. Since we had no calibration values, we analysed the effects of initial abstraction and the effects of concentration time using a number of empirical formulae widely used in the literature, in order to obtain a range within which to place the value of the peak flow rate. Referring to the Watt and Chow formula, the results showed that the initial abstraction rate had little effect because, within the range usually recommended, the variation was only 0.07%. On the other hand, according to the time-of-concentration formula used, differences in the value of the peak flow (4531 to 9009 m3/s = 53.5%) as well as the date of appearance of this peak flow were observed.
Keywords: GAMANE, Mahavavy, HEC-HMS, SCS-CN, Initial abstraction, Time of concentration
Cite this paper: Justin Ratsaramody, Estimation of the Flood Hydrograph of the Mahavavy River (Madagascar) During the Passage of Cyclone GAMANE in March 2024, International Journal of Hydraulic Engineering, Vol. 12 No. 1, 2024, pp. 1-8. doi: 10.5923/j.ijhe.20241201.01.
Article Outline
1. Introduction
1.1. General Information
- Cyclone GAMANE hit Madagascar between 15 and 29 March 2024, and the heavy rains that accompanied it caused a great deal of damage, loss of life, destruction of infrastructure, etc. as a result of overflowing rivers and the flooding that followed. Among the vital infrastructure destroyed was the bridge over the Mahavavy River at Ambilobe on Route Nationale 6 (RN6), built in 1951, as shown in Figures 1 and 2. Also as a result of GAMANE, many other bridges over other rivers and parts of roads have also failed on the RN6.
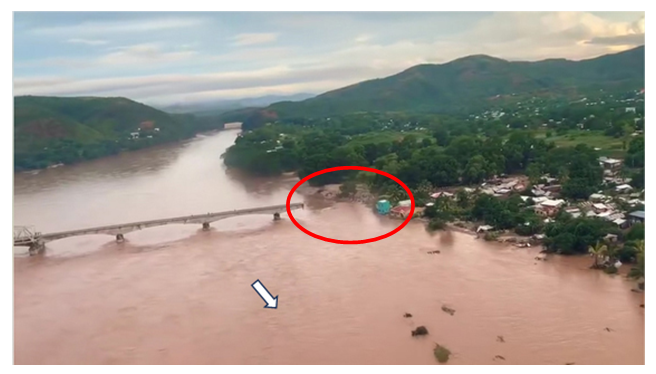 | Figure 1. View of the bridge over the Mahavavy river and the partially destroyed section |
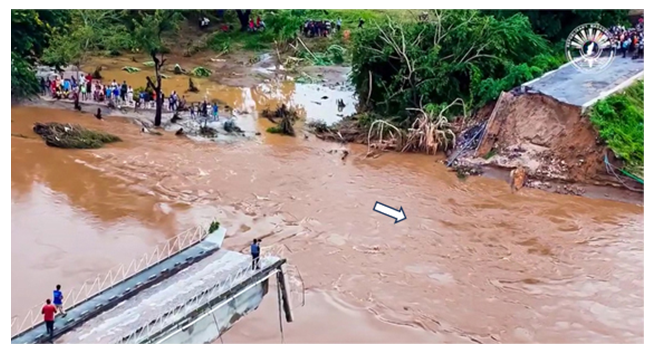 | Figure 2. The left-bank abutment and part of the bridge were swept away by the flooding of the Mahavavy river |
1.2. Location of the Study Area
- The Mahavavy River is the most important river in the DIANA Region and its catchment area is located in the south-eastern part of the DIANA Region (Figure 3).
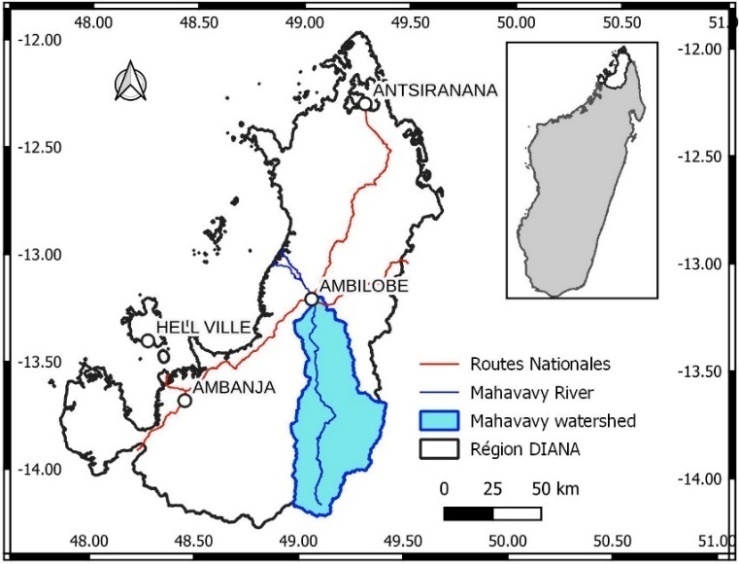 | Figure 3. Catchment area of the Mahavavy River in the DIANA Region. Inset: location of the DIANA Region on the island of Madagascar |
1.3. Outlet of the Catchment Studied
- Although the main target of the study concerns the bridge over the Mahavavy river, the outlet of the catchment area was not defined directly on the bridge but approximately 1800 m upstream of this bridge. This outlet was chosen for two reasons:1. There is still a diversion on the left bank of the Mahavavy river (Canal SIRAMA) between the chosen outlet and the bridge (Figure 4).2. Figure 2 shows that the destruction of the bridge was probably caused by excessive water velocities eroding the left bank and associated thrust forces on the deck. Therefore, in order to properly assess these velocities and forces in hydrodynamic modelling, the flow upstream of the bridge must be studied and the resulting flood hydrograph used as the boundary conditions for hydrodynamic modelling.
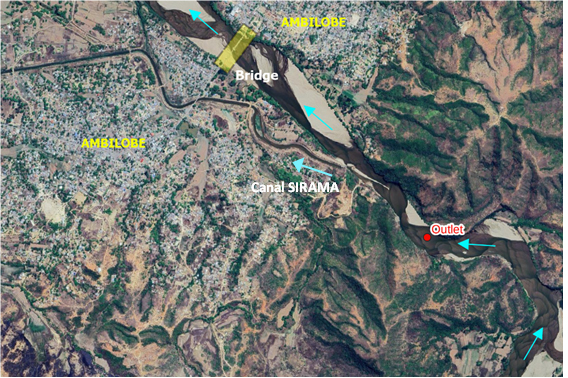 | Figure 4. Location of the outlet chosen to delimit the catchment area (Google Satellite image) |
2. Materials
2.1. Rainfall Data
- In the study area, there are no weather stations capable of providing the rainfall data required as input to the hydrological model. Consequently, gridded daily rainfall data (GPM IMERG), downloaded from and reduced to 21 stations distributed in and around the catchment, were used. For each of these stations, the data is in the form of a time series from 15 March to 30 March 2024.
2.2. Raster Data
- There are three types of raster data required for hydrological modelling: the DEM raster for catchment extraction and the hydrographic network, the land use and land cover raster and the raster containing hydrological soil classes.The DEM was obtained by merging tiles covering the study area and downloaded from . These rasters had a resolution of 12.5 m. For the Land Use and Land Cover (LULC) raster, it was downloaded from . This raster is derived from ESA-Sentinel 2 satellite images, which have a resolution of 10m, and comprises 10 land cover and land use classes. The raster containing the hydrological soil groups was downloaded from the database available at . This data was derived from the soil texture and bedrock depth classes provided by the Food and Agriculture Organization of the United Nations (FAO) and is consistent with the Soil Conservation Service (SCS) Curve Number method [12]. The resulting raster had a resolution of 225 m at the latitudes of the study area.
3. Methodology
3.1. Preliminary GIS Processing
- As the rasters containing the different data described above have different resolutions, they had to be resampled to a common resolution of 30 m and then projected into the same Reference Coordinate System, which is the UTM / WGS 84 Zone 39S.
3.2. HEC-HMS Model
- In the present study, the approach is conceptual and the global model is semi-distributed, which led us to choose the HEC-HMS (Hydrologic Engineering Center - Hydrologic Modeling System) software developed by the US Army Corps of Engineers (USACE). HMS has been designed to simulate precipitation and runoff processes in dendritic catchment systems and contains integrated lumped and distributed model tools for modelling hydrological processes. It consists of several components for calculating precipitation losses, direct runoff and routing [13,14]. In this process, the contribution of the various rainfall stations on each sub-catchment was carried out using Thiessen polygons.
3.3. Direct Runoff Model
- The direct runoff model is a model that describes the movement of water that has not been infiltrated or stored in the catchment. To apply this direct runoff model, it is necessary to have a method for assessing rainfall losses (the part of rainfall that is not transformed into infiltration or storage) and a method for transforming excess rainfall into runoff. The methods used in this study are described in the following two subsections.
3.3.1. Losses Method
- The SCS CN (Soil Conservation Service - Curve Number) method was used to estimate losses and, consequently, excess rainfall. The CN is a function of land use and land cover, antecedent humidity and cumulative rainfall. According to this method, excess rainfall is given by the following equation [15,16,17]:
 | (1) |
 = excess rainfall accumulated at time
  [mm];
[mm];  = depth of rainfall accumulated at time t [mm];
  = initial abstraction [mm];
  = maximum potential retention after runoff begins [mm]. As equation (1) shows, there is no runoff when
  .The relationship between the maximum potential retention
  [mm] and the curve number CN is given by the following empirical equation [15]:
 | (2) |
 | (3) |
 | (4) |
 | (5) |
 = composite CN used to calculate runoff volume;
  = index of catchment subdivisions with uniform land use and soil type;
  = CN for subdivision i; and
  = catchment area of subdivision
  .
.3.3.2. Transformation Method
- Consistent with the loss method used, the transformation method chosen was the SCS synthetic unit hydrograph, which is a parametric model for calculating the transformation of excess precipitation into direct runoff. The advantage of this hydrograph is that it requires only one parameter, which is the lag time
 for each sub-catchment, given by [19,20]:
 | (6) |
 is the time of concentration.There are many empirical formulae for calculating
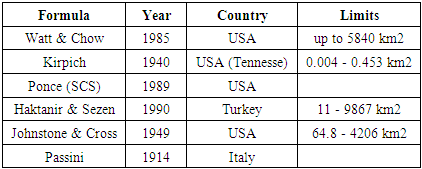
  , but Watt and Chow's formula has been chosen as the most appropriate. Indeed, of the many formulas giving the time of concentration present in the literature, it is one of the few formulas that can be used for large rural catchments of up to 5840 km2 [21,22,23]:
 | (7) |
 : time of concentration [hours]
 : hydraulic length of main watercourse [km]
 : average slope of main watercourse [m/m]
3.4. Routing Model
- On reaching a watercourse (or thalweg) within a particular sub-catchment, surface runoff combines with that watercourse and the resulting flows are routed to the outlet of that sub-catchment. The same routing phenomenon occurs at the scale of the entire catchment. Unlike hydraulic methods, which focus on resolving the Saint-Venant system, hydrological methods are based on the principle of continuity and the temporary storage of excess volumes in the section. One such method is the Muskingum method used here [24-26], whose equations are:
 | (8) |
 | (9) |
 is water storage,
  is time,
  is inflow and
  is outflow.In equations (8) and (9),
  and
and  are the two parameters of the model, which are respectively the storage time constant and a weighting factor. Based on the topographic and physiographic data of the different river sections identified in the catchment, the parameter
  was evaluated as follows [24]:
 | (10) |
 = wave travel time [s];
  = reach length [m];
  = celerity [m/s].The weighting factor was set at
  = 0.25 in the absence of field data.
3.5. Analysis of the Effect of Initial Abstraction
- In the SCS-CN loss method, initial abstraction is related to maximum storage according to the relationship [27]:
 | (11) |
 is the initial abstraction rate [-].In the original version of the SCS-CN method,
  = 0.2 but this value was later challenged by many researchers who stated that
  = 0.05 or even a lower value was much more appropriate [28-31]. Thus, the effect of initial abstraction on peak flow was analysed in this study, varying
  from 0.01 to 0.2.
3.6. Analysis of the Effect of Time of Concentration
- For ungauged catchments, as is the case here, determining the time of concentration
 remains a major challenge. It has been stated that 75% of the error in estimating the peak discharge of a flood hydrograph may be due to the error in estimating the time of concentration [32]. Several empirical formulae exist in the literature and, in this study, in addition to the Watt and Chow formula (equation (7)), five other empirical formulae were compared, namely:• Kirpich formula [33]:
 | (12) |
 | (13) |
 | (14) |
 | (15) |
 | (16) |
 = time of concentration [hr];
  = length of main channel from outlet to watershed [km];
  = slope between maximum and minimum elevations [m/m];
  = mean slope of main channel [m/m]. In equation (16),
  = time of concentration [hr];
  = hydraulic length measured along the main channel from the outlet to the watershed [m]; CN = Curve Number;
  = average slope of the catchment [m/m].
4. Results and Discussion
4.1. GIS Processing Results
4.1.1. Catchment Extraction and Modelling in HEC-HMS
- Figure 5 shows the Mahavavy river catchment area delimited according to the chosen outlet (Figure 4) and its representation schematised in HEC-HMS, which has subdivided it into 7 sub-catchment areas SB1 to SB7.
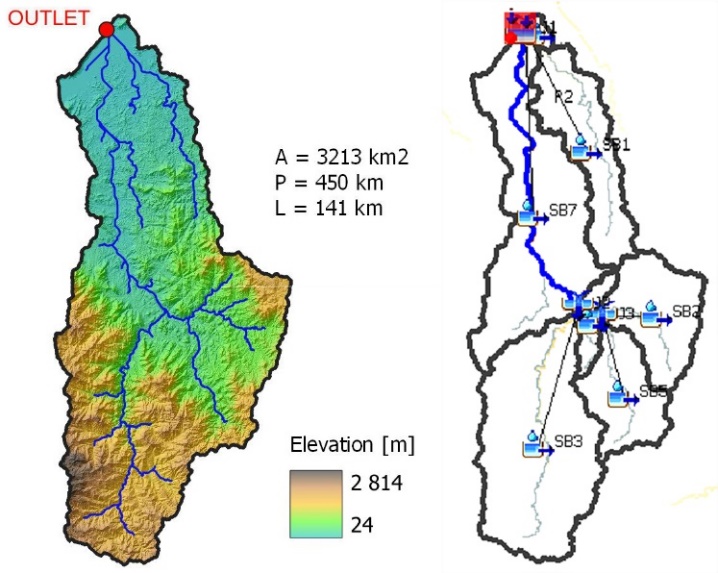 | Figure 5. Left: Mahavavy catchment area and physiographic characteristics. Right: Symbolisation in HEC-HMS |
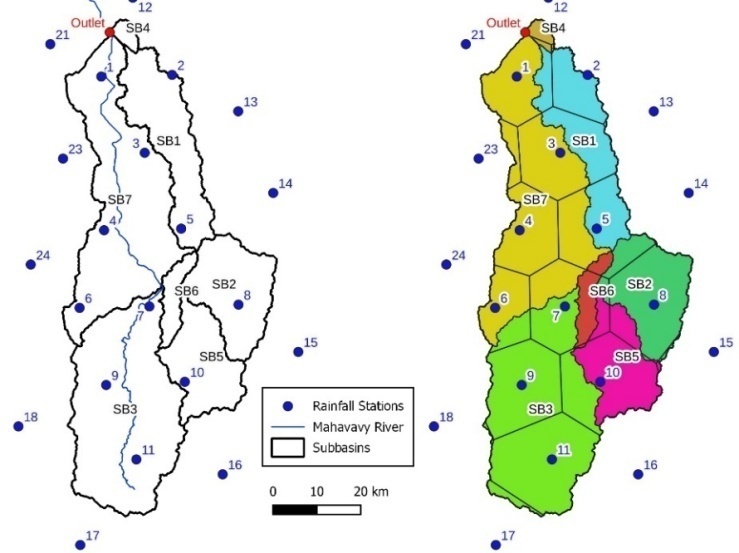 | Figure 6. Location of rainfall stations (left) and contribution according to Thiessen polygons (right) |
4.1.2. LULC and HSG
- As already indicated, to obtain the CN we need to consider the land cover and vegetation cover associated with the hydrological soil groups (Figure 7).
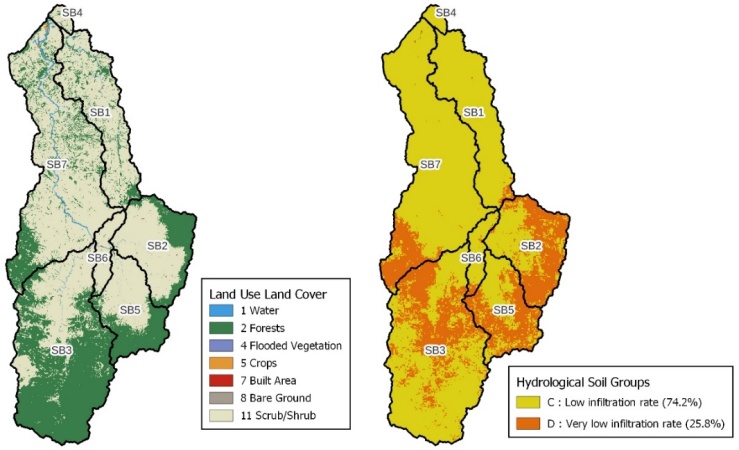 | Figure 7. Left: Land use and vegetation cover. Right: Hydrological soil groups |
4.2. Results of the SCS-CN Loss Method
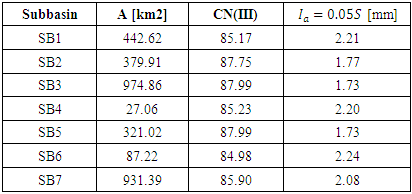
- After applying a matrix algebra to the two rasters shown in Figure 7, the resulting CNs are shown in Figure 8. To implement the CN in the HEC-HMS software, the average composite CN was calculated for each sub-catchment according to equation (5).
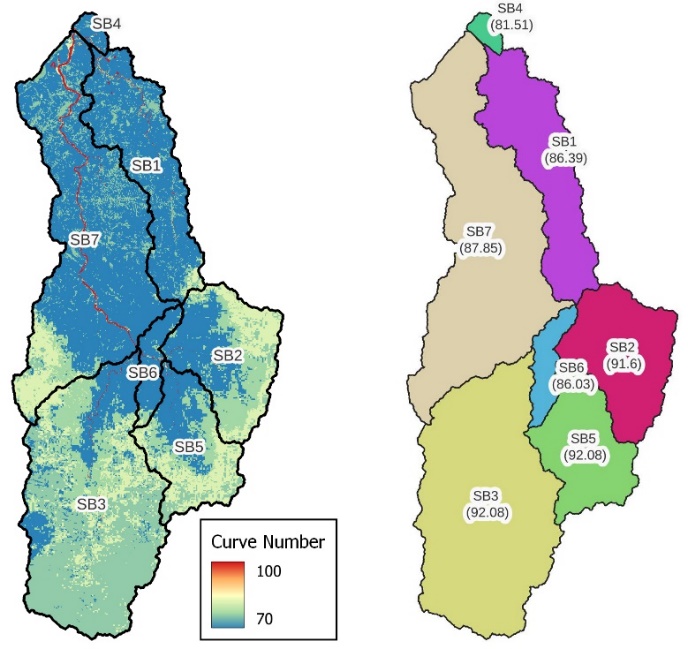 | Figure 8. Left: CN gridded. Right: average composite CN for each sub-catchment |
|
4.3. Results of the Transformation Method (Unit Hydrograph SCS)
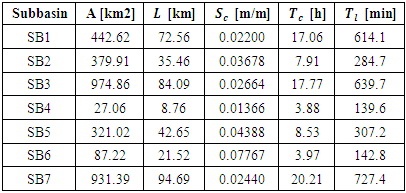
- By applying equation (6) of Watt & Chow for the time of concentration and equation (5) for the lag time, the results gave Table 2.
|
4.4. Modelling Results in HEC-HMS
- After implementation in HEC-HMS with the adopted sub-models, the flood hydrograph resulting from the passage of cyclone GAMANE is shown in Figure 9.
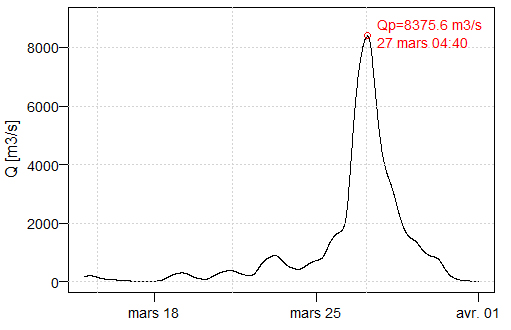 | Figure 9. Flood hydrograph for the Mahavavy river during the passage of cyclone GAMANE, using the Watt & Chow formula for time of concentration |
4.5. Results of the Analysis of the Effects of Initial Abstraction
- By varying
 from 0.01 to 0.2, and considering the time of concentration
  according to the Watt and Chow formula (equation (7)), the effects of initial abstraction are shown in Figure 10.
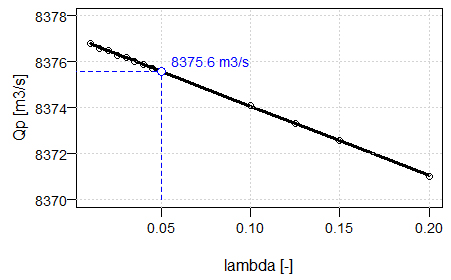 | Figure 10. Effects of initial abstraction on peak flow rate according to values of λ |
 , the peak flow varies from 8376.8 m3/s (λ = 0.01) to 8371.0 m3/s (
 = 0.2). This represents an absolute variation of 5.8 m3/s or, compared with the adopted peak flow of 8375.6 m3/s, a relative variation of 0.07%, which is quite negligible.It can therefore be concluded that initial abstraction has a negligible effect on peak flow, at least for the case studied.
4.6. Results of the Effects of Time of Concentration
- For the time-of-concentration formulae used, the results for peak flows are summarised in Table 3.
|
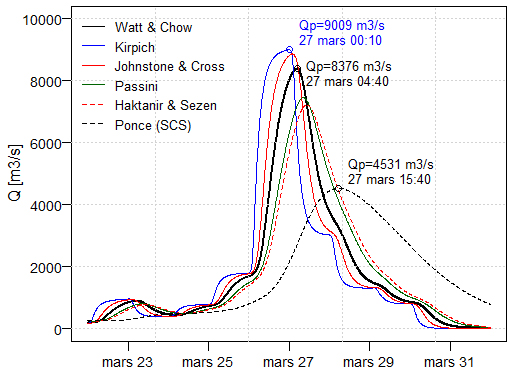 | Figure 11. Flood hydrographs according to the time-of-concentration formula |
|
5. Conclusions
- The aim of this work was to produce a reliable flood hydrograph that could be used as a boundary condition for hydrodynamic modelling in order to correctly identify the velocities and forces involved during the passage of cyclone GAMANE in March 2024, which destroyed part of the bridge over the Mahavavy river at Ambilobe. Indeed, identical reconstruction is not an option, especially as extreme cyclonic events of this kind are becoming increasingly frequent and intense.As no field data was available for the Mahavavy catchment, the runoff and routing processes were reconstructed using the SCS-CN method for estimating losses, the SCS synthetic unit hydrograph for transforming excess rainfall into runoff and the Muskingum method for routing.A sensitivity analysis was then carried out on initial abstraction and time of concentration using six different empirical formulae. By varying the initial abstraction rate λ from 0.01 to 0.2, it was found that this had little influence, as the variation in peak flow was only of the order of 0.07%. On the other hand, according to the time-of-concentration formula used, the results showed a significant variation (53.5%) in the value of the peak flows found and a smaller difference in the time of appearance of these peak flows (from 00:10 to 10:20 on 27 March 2024).If the Ponce (SCS) formula, which involves the CN, is discarded, it can finally be concluded that the peak flood discharge caused by cyclone GAMANE has a value reasonably ranging between 7232 m3/s and 9009 m3/s. Compared with the historical value of 8250 m3/s with a return period of 100 years, these values seem to justify the failure of the bridge without prejudging its structural condition, as it was built in 1951.The next logical step in this work will therefore be to carry out hydrodynamic modelling of the flows (solving the Saint-Venant equations) using one or other of the selected flood hydrographs as the upstream boundary condition (Figure 11).
 Abstract
 Reference
 Full-Text PDF
 Full-text HTML