-
Paper Information
- Paper Submission
-
Journal Information
- About This Journal
- Editorial Board
- Current Issue
- Archive
- Author Guidelines
- Contact Us
International Journal of Hydraulic Engineering
p-ISSN: 2169-9771 e-ISSN: 2169-9801
2022; 11(1): 1-9
doi:10.5923/j.ijhe.20221101.01
Received: Feb. 10, 2022; Accepted: Feb. 23, 2022; Published: Mar. 15, 2022

Modeling and Verification of the Effect of Dikes on the Spatial Extension of the Flood Plain of the Mananjeba River (Marivorahona, Madagascar)
 Abstract
 Reference
 Full-Text PDF
 Full-text HTML
Justin Ratsaramody1, Michel Aimé Randriazanamparany1, Mamisoa Randriamparany2
1Laboratoire d'Hydraulique, Ecole Supérieure Polytechnique, Université d'Antsiranana, Madagascar
2Doctorant EDT ENRE (Energies Renouvelables et Environnement), Université d'Antsiranana, Madagascar
Correspondence to: Justin Ratsaramody, Laboratoire d'Hydraulique, Ecole Supérieure Polytechnique, Université d'Antsiranana, Madagascar.
| Email: |  |
Copyright © 2022 The Author(s). Published by Scientific & Academic Publishing.
This work is licensed under the Creative Commons Attribution International License (CC BY).
http://creativecommons.org/licenses/by/4.0/

During the passage of cyclone Eliakim in March 2018, the overflow of the Mananjeba River (Ambilobe, DIANA Region, Madagascar) had led to a large flood that had caused material damage, loss of life and cut off the road between Ambilobe and Diégo-Suarez for several months. Dikes were then planned to mitigate the effects of this flooding and to protect the destroyed and rebuilding infrastructure. In this work, we modelled the floodplain of the Mananjeba River in the vicinity of the village of Marivorahona, without and then with the dykes, and this modelling was based on solving the flow equations according to a finite-difference method in generalized curvilinear coordinates and using a constrained numerical interpolation scheme (CIP) for the advection terms. This resolution was performed with the Nays2D Flood solver which is available in the iRIC software suite due to its low requirement for measured field data. It was concluded that the models thus developed reproduced the spatial extent of the flood quite accurately. It was also found that the effect of dykes on flood attenuation for infrastructure protection was not fully effective. Nevertheless, the models used in this work could be improved by carrying out field measurements in order to fix certain parameters and to increase their accuracy.
Keywords: Modelling, Flooding, CIP, Nays2D Flood, Dykes, Mananjeba
Cite this paper: Justin Ratsaramody, Michel Aimé Randriazanamparany, Mamisoa Randriamparany, Modeling and Verification of the Effect of Dikes on the Spatial Extension of the Flood Plain of the Mananjeba River (Marivorahona, Madagascar), International Journal of Hydraulic Engineering, Vol. 11 No. 1, 2022, pp. 1-9. doi: 10.5923/j.ijhe.20221101.01.
Article Outline
1. Introduction
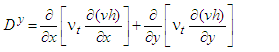
- Madagascar is one of the countries most affected by floods, following the passage of low-pressure systems (cyclones) accompanied by intense rainfall. Each year, these floods cause significant material damage and loss of life, not to mention the high costs of rebuilding destroyed infrastructure. After each cyclone and subsequent flooding, it costs an average of US$ 2.2 million to restore only irrigation systems [1]. The same is true of road infrastructure, as the disruption of communication routes leads to an immediate rise in inflation. In the wake of two cyclones in 2012 (Giovanna in February 2012 and Irina in March 2012), the Madagascar Road Authority (ARM) spent €9.6 million on the rehabilitation of national roads [2].From 16 to 18 March 2018, cyclone Eliakim accompanied by intense rainfall had affected the north-western area of Madagascar (DIANA Region) and the overflowing of the Mananjeba River had caused significant damage to the road infrastructure between Ambilobe and Antsiranana, particularly at the level of the village of Marivorahona (Figure 1). The road was then cut off for several months while damaged infrastructure was rebuilt, including a bridge and part of the road that had been washed away. The Bailey Bridge (a prefabricated metal bridge) as well as the concrete Marivorahona Bridge were severely damaged.In parallel with this infrastructure reconstruction, protective measures were decided upon and a tender was launched on 26 July 2019 for the construction of dikes at three points on the left bank of the Mananjeba [3]. The main objective of this work was then to verify, by means of a hydrodynamic model, the effect of these dykes on the extension of the flood, i.e. whether their location could protect the road infrastructures against the overflows of the Mananjeba River.In order to be as accurate as possible, the construction of such a hydrodynamic model requires a certain amount of data, including hydrological data and precise and recent hydraulic data. However, it should be noted that such data are not available in the study area. The only rainfall data available for the calculation of floods in the study area are found in Duret [4] and Chaperon et al [5] in the form of frequency isohyet maps of maximum daily rainfall (return periods of 10, 25, 50 and 100 years). However, with the climate change of the last decades, these data seemed to be obsolete because even with the more recent work of Chaperon et al. (1993), the data processed were probably rainfall data from before 1975. As for the flow data, the only available values for the Mananjeba River are monthly records dating from 1971 to 1976 and 1980 to 1983 [5]. For the same reasons as for the rainfall data, these data also seemed obsolete because they no longer reflected the current hydrological and hydraulic behaviour of the river.
2. Materials and Methods
2.1. Description of the Hydrodynamic Model and the Resolution Solver
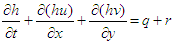
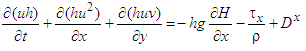
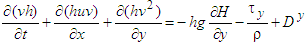
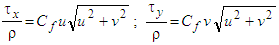
- The hydrodynamic model is based on the shallow water equations in 2D formulation [6]:Continuity equation
 | (1) |
 | (2) |
 | (3) |
 | (4) |
 | (5) |
 | (6) |
 : water depth,
  : time,
  : flow velocity in the
  direction,
  : flow velocity in the
  direction,
  : acceleration of gravity,
  : water surface elevation,
  : riverbed shear stress in the
  direction,
  : riverbed shear stress in the
  direction,
  : coefficient of friction,
  : coefficient of turbulent viscosity,
  : density of water,
  : inflow, and
  : rainfall
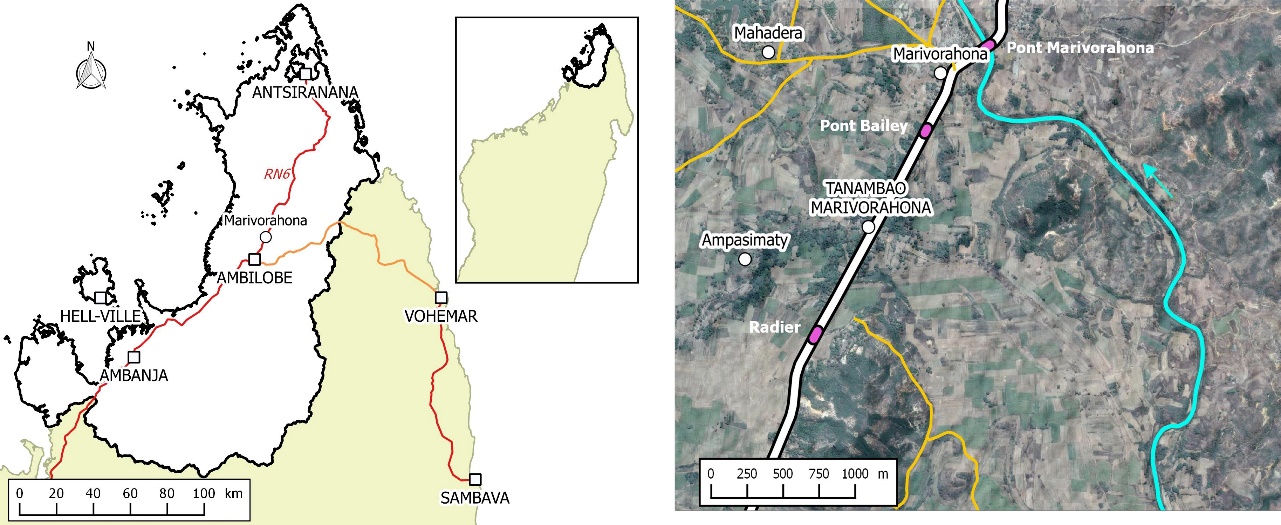 | Figure 1. Left: Location of the DIANA Region, the town of Ambilobe and the village of Marivorahona in relation to the island of Madagascar. Right: Zoom in on the area of interest with a view of the RN6 national road and the three structures (invert, Bailey Bridge and Marivorahona Bridge). The Mananjeba River is shown in blue with its flow direction |
 | Figure 2. Left: location of the left bank embankment dikes. Right: photo of the breach at the location of Dike 1 [3] |
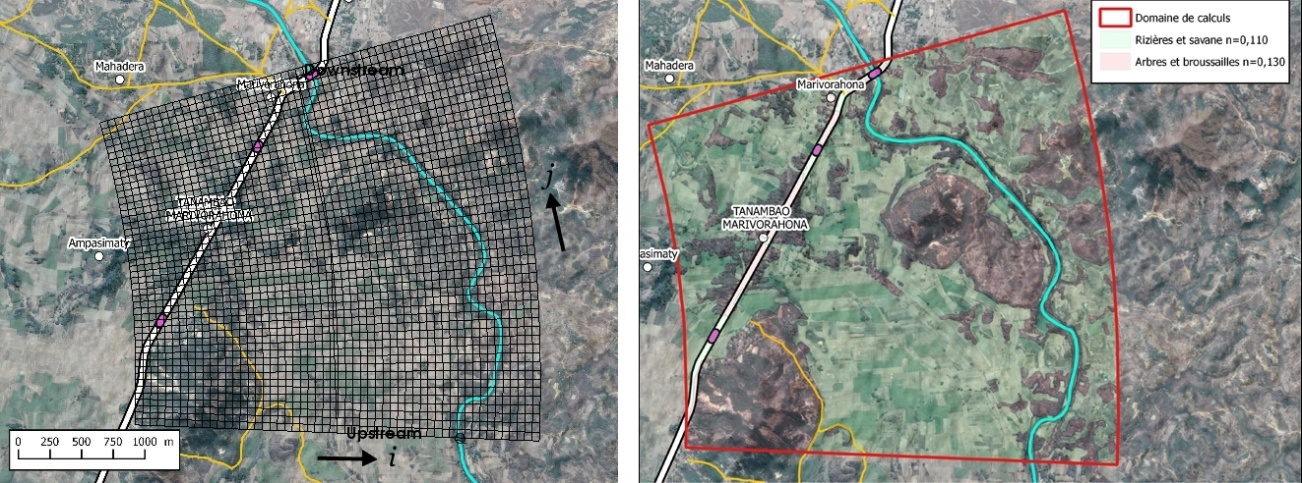 | Figure 3. Left: calculation grid in curvilinear coordinates (3200 m wide and 2950 m on axis); axial length of stream = 4110 m, overall slope = 0.00146. Right: Manning's roughness coefficient n = 0.110 for rice fields and savannah; n = 0.130 for trees and scrub |
2.2. Data and Assumptions
- In this work, the topographic data used was a 30 m resolution DEM (Digital Elevation Model) from SRTM (Shuttle Radar Topographic Mission) freely obtained from http://srtm.csi.cgiar.org/srtmdata/.For the boundary condition, a simplified input hydrograph was constructed from the maximum value given in [3] and shown in Figure 4.
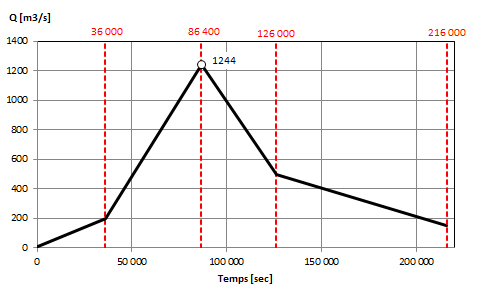 | Figure 4. Simplified inflow hydrograph with a peak of 1244 m3/s, a rise time of 86,400 s (24 h) and a limited recession at 216,000 s (60 h), i.e. 36 h in duration. The initial flow (at t = 0) is 5 m3/s |
2.3. CIP Method
- The CIP (Constrained Interpolation Pseudo-Particles or Cubic Interpolated Propagation) method, which is one of the options of the Nays2D Flood solver, was used for the solution of the advection terms of equations (1) to (3). It is a method that was first posited in 1985 by [7] and has been further developed, for example by [8], [9] and [10].In contrast to classical upwind numerical schemes which are strictly dependent on the resolution of the computational grid, the CIP method allows to conserve the mass by using a semi-Lagrangian scheme while leaving a non-conservative form to the general equations (1) to (3). The CIP method thus allows the determination of values in the sub-cells using only one calculation cell, even in 3 dimensions. Furthermore, as the advection terms are treated separately from the general hyperbolic equations, it allows the use of a large number of CFLs [11].During the last two decades, the CIP method has been successfully used in many fields and for the study of many phenomena: solution of the Navier-Stokes equations in 3 dimensions [12], field of optics [13], fluid-structure interactions [14], thermal [15], violent fluid impacts [16], pollutant transport [17], tsunamis and breaking waves [18] etc.
2.4. Implementation of the Simulation
- The simulation was performed with the Nays2D Flood solver version 5.0 in the iRIC software suite version 2.3.9.6034 and with the following characteristics:• Calculation grid (see Figure 3): width = 3200 m; length along the axis = 2950 m; 2695 cells; following i:
 : = 49 (60.8 m); following j:
  : = 55 (59.3 m). • Calculation time step t = 0.1 seconds with an output every 600 seconds.• Maximum number of iterations for the surface calculation = 10.• Minimum water depth = 0.10 m.• The initial and boundary conditions were as described above.The characteristics of the grid used are optimal taking into account the resolution adopted for the DEM and to have a reasonable calculation time.
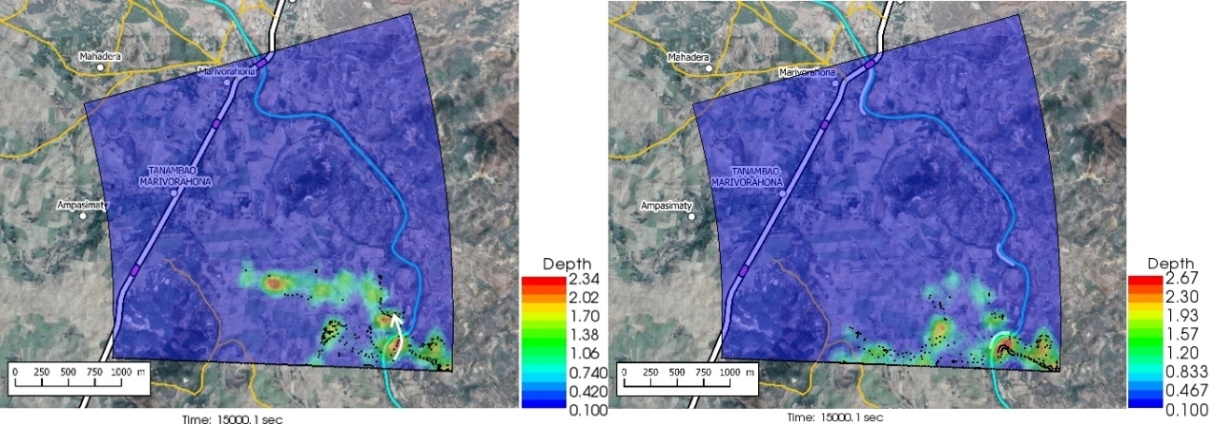 | Figure 5. t = 15,000 sec. Left (without dykes): the floodplain fills much faster. Right (with dikes): the presence of Dike 1 slows down the filling of the floodplain |
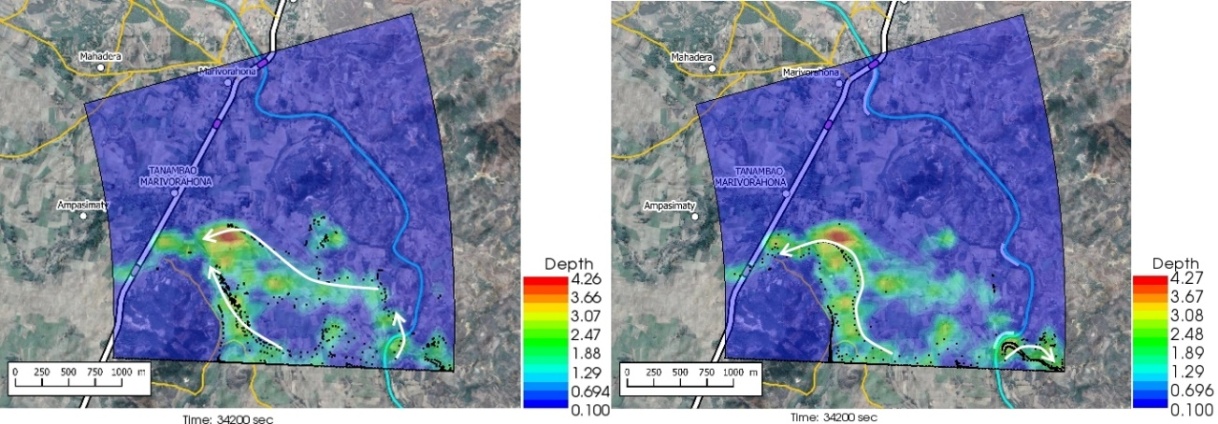 | Figure 6. t = 34,200 sec. Left (without dykes): the flow reached the invert at t = 24000 s and as a result of overflow on the left bank in several places. Right (with dykes): the flow reached the invert at t = 25800 s but only through an overflow upstream of Dike 1. The presence of Dike 1 also led to an overflow on the right bank |
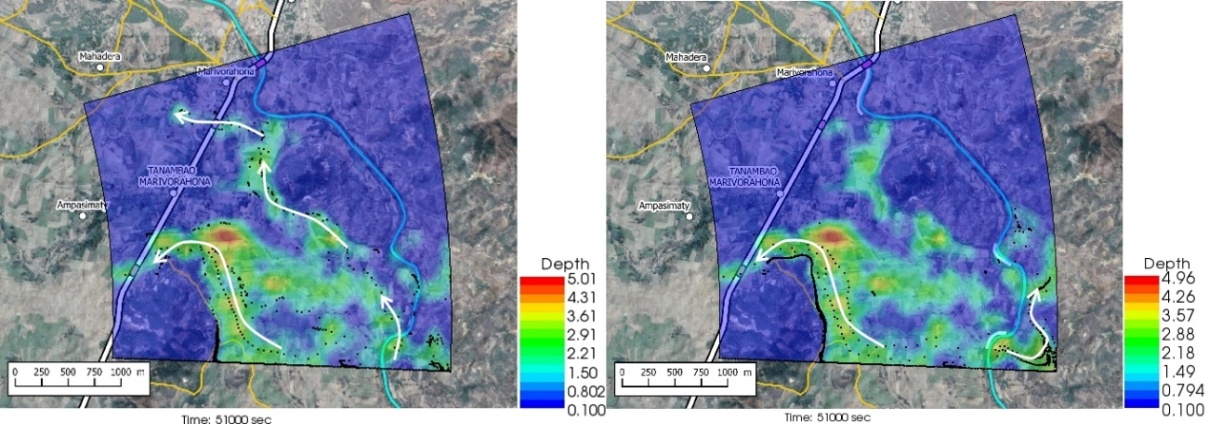 | Figure 7. t = 51,000 sec. Left (without dykes): flow has already reached Bailey Bridge. Right (with dykes): as a result of the presence of Dyke 1, a significant flow develops on the right bank and moves northwards |
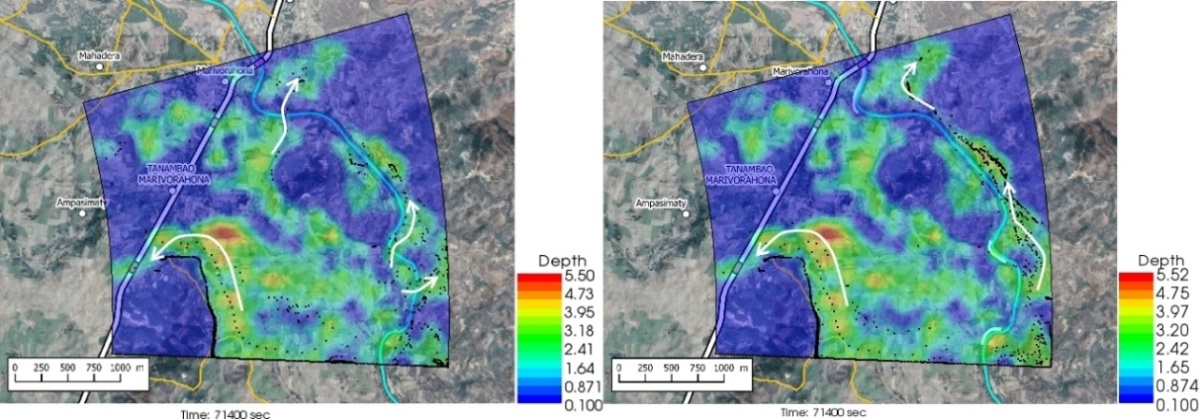 | Figure 8. t = 71,400 sec. Left (without dykes): flow across Bailey Bridge has momentarily ceased; significant overtopping to the right bank is observed in several places. Right (with dykes): flow on the right bank continues |
 | Figure 9. t = 86,400 sec (peak of the hydrograph). Left (without dikes): the village of Marivorahona is reached by the flood. Right (with dykes): part of the flow on the right bank passes downstream of Dike 2 but returns to the right bank. The village of Marivorahona is also affected but with lower velocities |
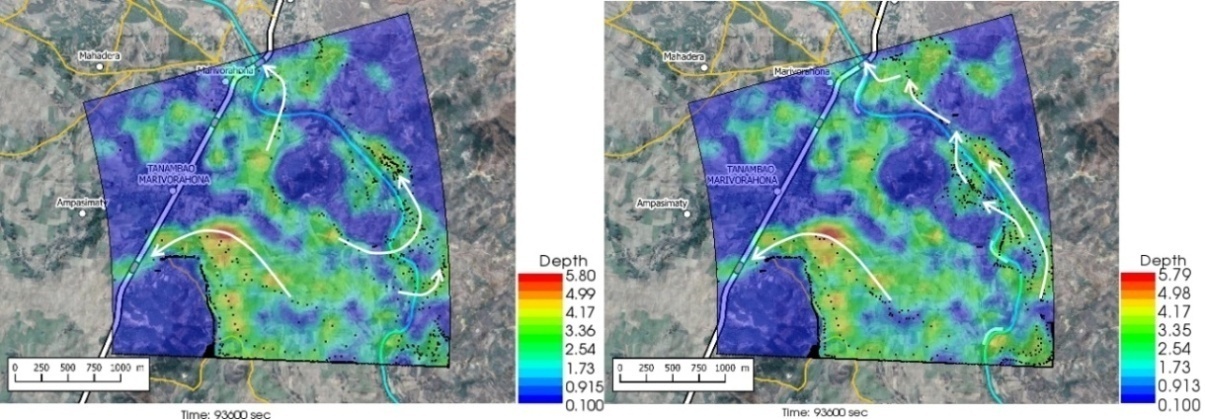 | Figure 10. t = 93,600 sec. Left (without dykes): the flow has reached the Marivorahona Bridge. A significant emptying of the flooded areas from the left bank to the right bank is observed. Right (with dykes): here also, the flow has reached the Marivorahona Bridge |
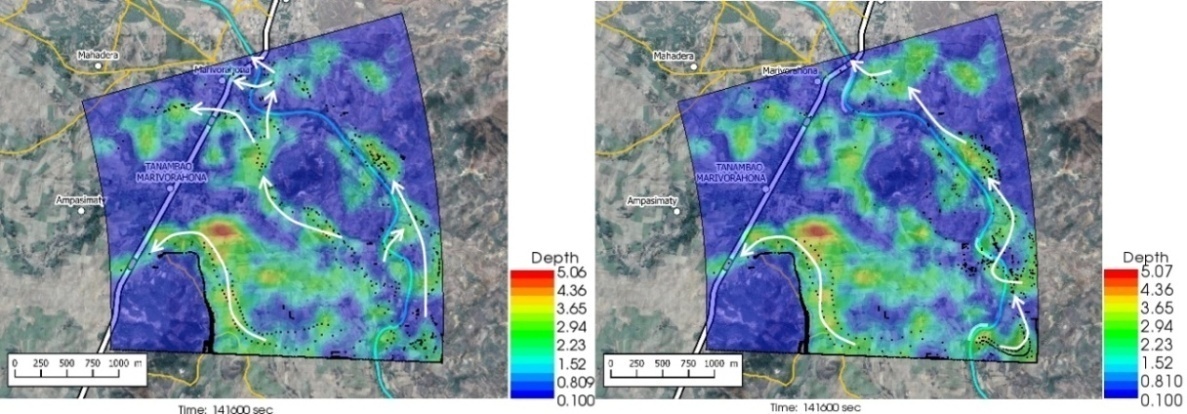 | Figure 11. t = 141,600 sec. Left (without dykes): Following the emptying of the flooded areas from the left bank to the right bank, the flow across the Bailey Bridge has resumed significantly. The same applies to the flows towards the village of Marivorahona and across the Marivorahona Bridge. Right (with dykes): flow across the Marivorahona Bridge continues |
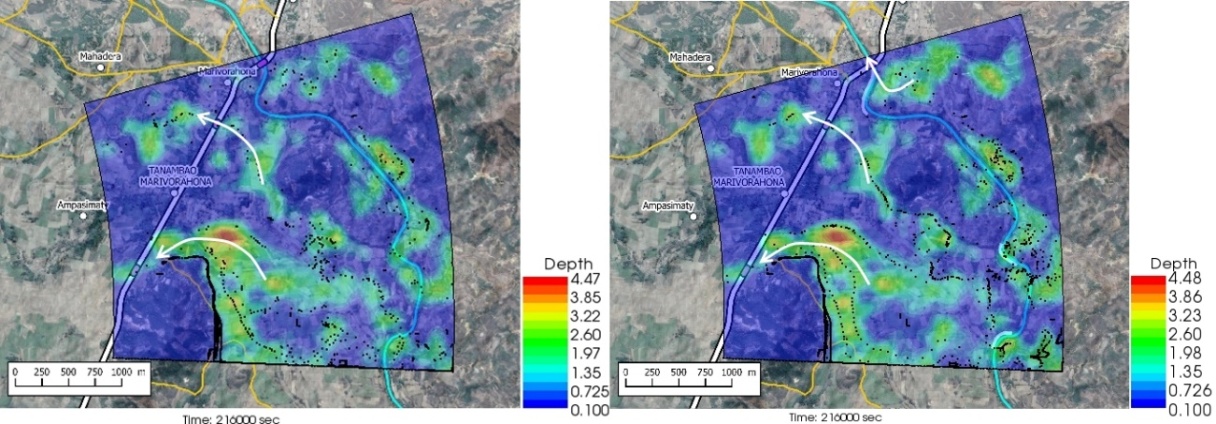 | Figure 12. t = 216,000 sec (end of hydrograph). Left (without dykes): flow across the Bailey Bridge still continues and little flow across the Marivorahona Bridge. Right (with dykes): there is also flow across the Bailey Bridge and across the Marivorahona Bridge |
3. Results and Discussions
3.1. Comparative Temporal Evolution of the Flood Extension
- The figures 5 to 12 show the comparative extension of the flooding without and with the presence of the dykes at different times in the hydrograph. The images on the left are for the flooding without the dikes, while the images on the right are for the flooding with the dikes, at the same time. The particle density is representative of the intensity of the flow velocity.The review of Figures 5 to 12 led to the following main conclusions:• With or without dikes, the flow through the invert is never interrupted during the entire hydrograph;• Flow across the Bailey Bridge occurs much faster in the absence of dykes, while flow across the Marivorahona Bridge occurs at practically the same times in both cases;• The presence of Dykes 1 and 2 has led to the development of a significant flow on the right bank of the Mananjeba River;• The village of Marivorahona is affected by flooding in the same way in both cases but, due to the presence of Dike 3, the flow is much more directed towards the outlet of the Marivorahona Bridge.It can therefore be concluded that, from a spatial extension point of view, the presence of three dykes has not fundamentally changed the configuration of the flooded areas, which is practically the same in both cases; although the floodplain fills up much more quickly in the absence of the dykes. The presence of the dykes has not prevented significant flows across the invert and Bailey Bridge. Only Dike 3 appears to have had a positive effect, as it directed more flow towards the Marivorahona Bridge and mitigated the effects of the flooding on the village of Marivorahona.
3.2. Model Calibration and Validation
- The lack of data on the study area prevented the calibration and quantitative validation of the model. However, field investigations and the examination of various photos and videos during the flooding showed an acceptable agreement between the results of the numerical simulation and the spatial extension that had actually occurred in the study area. This qualitative calibration is a common approach that has been successfully performed all over the world [6], [19], [20], [21], [22], [23] and [24] with the use of Nays2D Flood as this solver was developed precisely for developing countries where data is lacking [25], [26].
3.3. Numerical Results
- While the spatial extension is correctly reproduced, the numerical results of the water depth shown in the different figures (Figures 6 to 12) seem to be too high in some areas compared to reality according to field investigations. These inaccurate numerical results have also been found in many studies, e.g. [6], but can be improved by having slightly more accurate topographic data. However, there are no measured values available for verification and calibration.In the context of this study, this was not a major problem as the main objective was not to determine precise numerical values but to assess the improvements that could have been achieved by the presence of dykes.A classic Upwind numerical scheme had also been tested but, again due to the lack of field measurements, we are unable to say which results, from CIP and Upwind, are quantitatively better.
3.4. Imperfections and Possible Improvements of the Model Used
- a. Topographical imprecisionFor the topographic description of the study area, the DEM used had a horizontal resolution of 30 m and was translated in the calculations into points with the same altitude in each cell of this DEM (Figure 13). Despite the relative accuracy of this DEM in relation to the size of the study area, this accuracy is still insufficient to accurately reflect certain areas such as road embankments and the actual cross-sections of the river. Thus, using only the DEM, the roads and their embankments are at the same elevation, as are the river and its banks, whereas the reality is somewhat different (Figure 13).
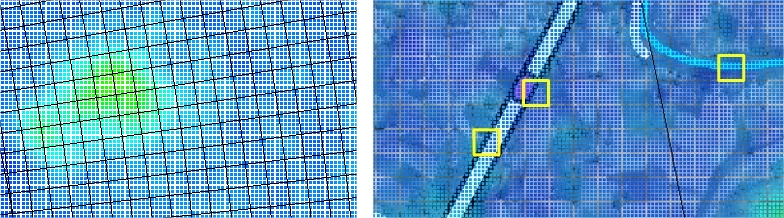 | Figure 13. Left: DEM cells (white grid) and calculation grid (black grid). Right: display of the road and river in relation to the DEM cells. For example, all points contained in each yellow square have the same elevation |
4. Conclusions
- Following the significant damage (destroyed bridges, washed-out roads, etc.) caused by the flooding of the Mananjeba River (Madagascar) during the passage of cyclone Eliakim in March 2018, the road authorities decided to raise the river banks in three different locations by means of dikes. The main objective of this study was to verify the effectiveness of these dykes by modelling the spatial extension of this flood. This modelling was carried out by solving the flow equations in a two-dimensional formulation with the Nays2D Flood solver from the iRIC software suite and using the CIP numerical scheme for the resolution of the advection terms.The results of this modelling showed that, despite apparently too high water depths in some areas, the spatial extension reproduced the flooding fairly accurately, leading to the conclusion that the model was reliable. Thus, it was found that only Dike 3 had a real impact on flood mitigation by channelling the flow towards the Mananjeba Bridge and protecting the village of Marivorahona. In contrast, Dikes 1 and 2 had little impact since the final configuration of the spatial extent was almost identical in both cases, without and with these dykes.In addition, the various elements used in the model could be improved by carrying out topographic field surveys for greater accuracy of the digital terrain model, by using a more accurate hydrograph from a hydrological model of the catchment area upstream of the study area, taking into account the combined effects of the rainfall and the flood hydrograph.