Saeed Maddah1, Fereshteh Kolahdouzan1, Alireza Eftekhari1, Vijay P. Singh2, Hossein Afzalimehr1
1Department of Civil Engineering, Iran University of Science and Technology, Tehran, Iran
2Department of Biological & Agricultural Engineering & Zachry Department of Civil and Environmental Engineering, Texas A&M Univ., College Station, Texas, USA
Correspondence to: Hossein Afzalimehr, Department of Civil Engineering, Iran University of Science and Technology, Tehran, Iran.
| Email: |  |
Copyright © 2021 The Author(s). Published by Scientific & Academic Publishing.
This work is licensed under the Creative Commons Attribution International License (CC BY).
http://creativecommons.org/licenses/by/4.0/

Abstract
This study, experimentally investigated scouring around submarine pipelines grouped into (1) two pipes with the same diameter, (2) two pipes with different diameters, (3) three pipes with the same diameter, and (4) three pipes with different diameters. Experiments were conducted in a flume 13 m long, 0.46 m wide, and 1 m deep, with a flow discharge of  To validate the experimental findings, a number of single-pipe tests were performed and the test results of single-pipe and double-pipe with the same diameter were compared with the results of similar tests done by Westerhorstmann et al. (1992) [1], Zhang et al. (2017) [2] and Dey and Singh (2008) [3]. Results of this study showed that for minimum scour depth the optimal combination of two- and three-pipe systems with the same diameter was related to a distance of G = 0.5D from each other, where D is the diameter of the pipe. For two pipes with different diameters, the minimum scour was when the pipes were exposed to the flow in a descending manner and had a distance of G = 0.5D' from each other, D’ indicates the ratio of large diameter to small diameter
  equal to 1.25 and 1.6,
  and for
 It was also observed that the development of scour holes in the case of three pipes with different diameters was similar to the case of two pipes with different diameters.
Keywords:
Scour depth, Scouring, Group of pipelines, Different diameters
Cite this paper: Saeed Maddah, Fereshteh Kolahdouzan, Alireza Eftekhari, Vijay P. Singh, Hossein Afzalimehr, Experimental Investigation of Scouring in Groups of Parallel Pipelines, International Journal of Hydraulic Engineering, Vol. 10 No. 2, 2021, pp. 27-34. doi: 10.5923/j.ijhe.20211002.01.
1. Introduction
Submarine pipelines are an important infrastructure for transporting water, natural gas, oil, and petroleum products. Due to the increasing extraction of oil and gas resources, the use of submarine pipelines is rapidly increasing. When a pipe is placed on an erodible seabed, scouring occurs around the pipeline due to the interaction between the pipeline and the erodible seabed, under a current or a wave, or a combination of both. As a result, parts of the pipe become suspended; in other words, they have no support. Over time, the length of free openings increases, and the pipe may rupture or structurally fail under severe oscillating loads due to vortices formed around the pipeline. Therefore, the mechanism of occurrence and expansion of the scour cavity, its depth and the factors affecting it have received considerable attention from researchers and designers.Yang et al. (2018) [4] divided the process of pipeline scour formation and development into three parts: scour initiation, tunnel erosion, and eddy erosion. When a pipe is placed in the seabed or riverbed, vortices are formed around the pipe. Mao (1986) [5] defined these vortices as vortices A (upstream of the pipe) and vortices B and C (downstream of the pipe) (see Figure 1). Kjeldsen et al. (1973) [6] predicted the scour depth below the pipeline using only pipe velocity and diameter. In addition to pipe velocity and diameter, Ibrahim and Nalluri (1986) [7] also used critical velocity and flow depth to predict scour depth in clear-water and live-bed conditions. Their results showed that in clear-water conditions, the scour depth was directly related to flow velocity and inversely related to flow depth, while these relationships inversed in the live-bed conditions. Dey and Singh (2008) [3] stated that for  as the ratio of pipe diameter to median particle diameter
  increased, the ratio of scour depth to pipe diameter
  also increased. In the
  mode
mode  decreased as
  increased. Westerhorstmann et al. (1992) [1] examined scour under two pipelines with two distance ratios
  = 0.5 and 1 and observed that the scour depth for
  = 0.5 was less than for
  = 1, because at shorter pipe distances, the vortex action between the pipes was blocked and vortices could not develop. In order to reduce the scour depth in a two-pipe system, Zhao et al. (2015) [8] also stated that two pipelines should be placed as close to each other as possible. In a numerical study, Li et al. (2020) [9] stated that increasing the ratio of distance between two pipes to the diameter of the pipes
  causes the scour hole below the upstream pipeline wider. Also, the smaller the distance ratio, the longer the scouring hole under the downstream pipe. Zhang et al. (2017) [2] obtained results similar to Zhao et al. (2015) [8] and stated that for
  the two pipelines acted as a one body. They also stated that for
  the scour depth of the upstream and downstream pipes approached the scour depth of a single pipeline.
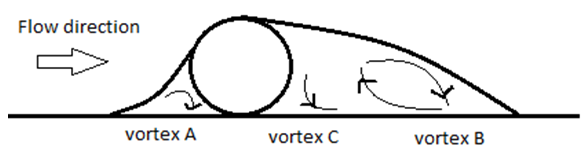 | Figure 1. Vortices formed around the pipeline Mao (1986) [5] |
The objectives of this study therefore were to answer the following questions experimentally:1. What is the effect of distance between pipes on the scour process?2. What are the optimal diameter of a pipe and its location to reduce scour depth?3. Is there any significant difference between two- and three-pipe arrangements in scour development?
2. Experimental Setup and Procedure
For the experiments in this study, a flume with plexiglas walls 13 m long, 0.46 m wide and 1 m deep was used, which has a centrifugal pump with a maximum power of 30 hp and a maximum capacity of 440  (about 122
  ). In order to reduce the distance required to reach the fully developed flow condition, in the initial part of the flume, 1 m long galvanized mesh sheets were placed on top of each other. The test section was located between 8.75 m and 10.25 m from the entrance of flume. For bed sediment, such as Zhang et al. (2017) [2] and Yang et al. (2019) [10], sand with a median particle size of
 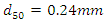 with a standard deviation of less than 1.4 was used. The grading curve that is granulated and plotted by ASTM standard sieves is shown in Figure 2.
 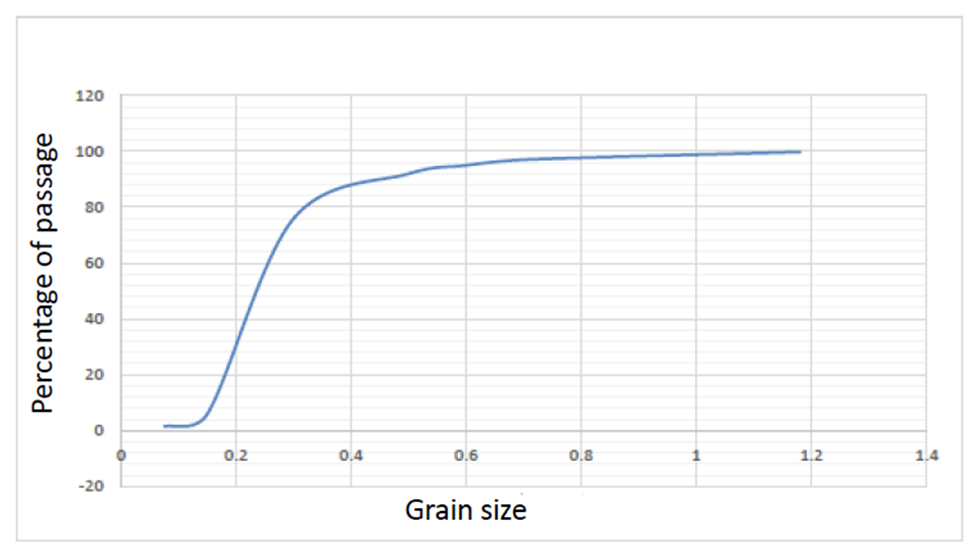 | Figure 2. Grading curve of bed sediments |
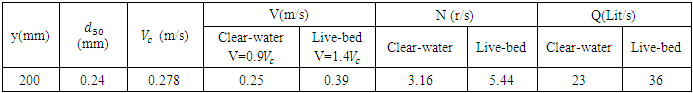
Also, sand with a median size of 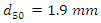 was used in which no sediment motion was observed. The height of bed material along the entire length of the flume was 20 cm. In all tests, the flow was uniform and its average velocity was measured at a distance of 0.4 m from the bed and at a distance of 9 m from the entrance of the flume. A current-meter connected to a counter was used to measure the flow velocity. To reduce the measurement error, experiments at each point were repeated at least 5 times and an average value was used in this study. A summary of flow characteristics is provided in Table 1. To calculate the critical velocity, the Melville equations (equations 1 and 2) were used:
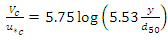 | (1) |
 | (2) |
Table 1. Calculation of Q,N,V in Clear-water and Live-bed Condition
 |
| |
|
The pipes used in these experiments were PVC pipes with diameters of 2, 2.5, 3.2 and 4 cm. Initially, these pipes were individually exposed to flow. In the next step, pipes with diameters of 2, 3.2 and 4 cm were placed in double-pipe configurations with the same diameter and with a distance to diameter ratio  . Single-pipe and double-pipe experiments with the same diameter included a total of 15 tests (two tests in clear-water condition and thirteen tests in live-bed condition). Given that similar experiments were performed in the studies of Westerhorstmann et al. (1992) [1] and Zhang et al. (2017) [2], it was possible to validate the existing laboratory models by this study. Also, the results were compared with those related to pipes with different diameters. Double-pipes with different diameters were tested under different arrangements and 22 experiments were performed under live-bed conditions. Also, at the end, 9 tests were performed for the three-pipe system. The pipes were placed on the bed in the middle of the selected reach to prevent its possible movement due to water flow. This was done by rubber sheets on one side of pipe which had the same size as the pipe cross section. In the case of two or three pipes, the distance between the pipes was measured with a caliper. To draw the scour profiles during the experiment, checkered plates glued to the flume wall were used (figure 3). In all tests, experiments continued until the scouring depth change was less than 1 mm over a period of 2 hours.
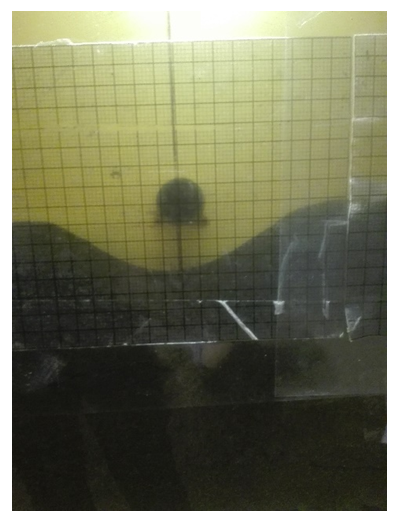 | Figure 3. Checkered plates used for drawing the scour profile |
3. Dimensional Analysis
Various parameters affect scouring under the pipelines, the most important of which in the present study were: a) Hydraulic characteristics of flow, including the average flow velocity in upstream (U), water depth in upstream (H), and bed slope (S); b) physical properties of fluid, including mass density of water  gravity acceleration (g), and kinematic viscosity
  ; c) geometric parameters, including pipe diameter (D), distance between pipes in the pipe group (G), and channel width (B); and d) sediment parameters, including median size of bed sediments
  , geometric standard deviation of sediments
  and sediment density
  . The parameters can be summarized as follows:
 | (3) |
Using the Buckingham pi theory, equation 3 was written as follows: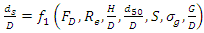 | (4) |
The Froude number of the pipe  was obtained from equation 5:
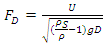 | (5) |
The Reynolds number  was calculated from Equation (6); and however, it could be removed because its variable were kept without change herein.
 | (6) |
As Dey and Singh (2008) [3] mentioned, when the water depth was more than 5 times the diameter of the pipe  , scour under the pipe would be independent of water depth. In all the experiments in this study
  term
term  was omitted from equation (4). Also, since during the tests, the bed material, the geometric standard deviation of sediments and the bed slope were also constant, the
  and S parameters could be removed from equation (4). Accordingly, equation (4) was simplified as follows:
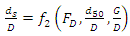 | (7) |
4. Results
4.1. Tests on Tingle-Pipe and Double-Pipe with the Same Diameter
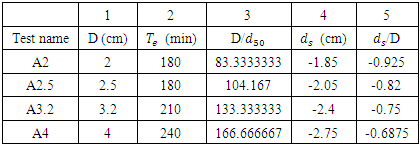
Table 2 presents the results of experiments on single pipes with 2, 3.2 and 4 cm diameters comparing with the results of Dey & Singh (2008) [3]. Figure 4 compares the results obtained by Dey and Singh (2008) [3] and those by the present study, confirming the validity of the present research. Table 2. Results of Single-pipe Tests
 |
| |
|
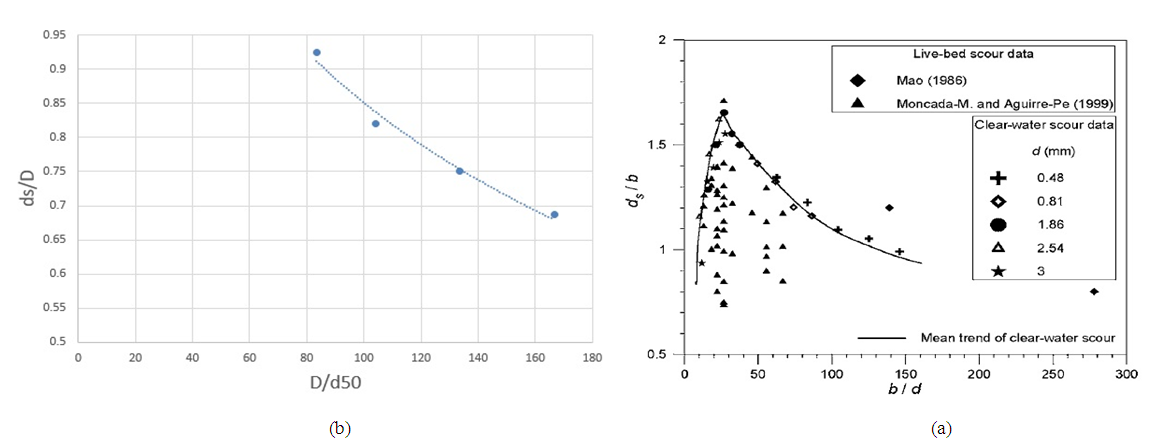 | Figure 4. a) The curve presented by Dey and Singh (2008). b) the curve presented in this study related to single-pipe tests |
Figure 5 shows the scour profiles of two pipes with a diameter of 4 cm in three cases in this study along with the results of studies by Zhang et al. (2017) [2] on two pipes with a diameter of 15 cm.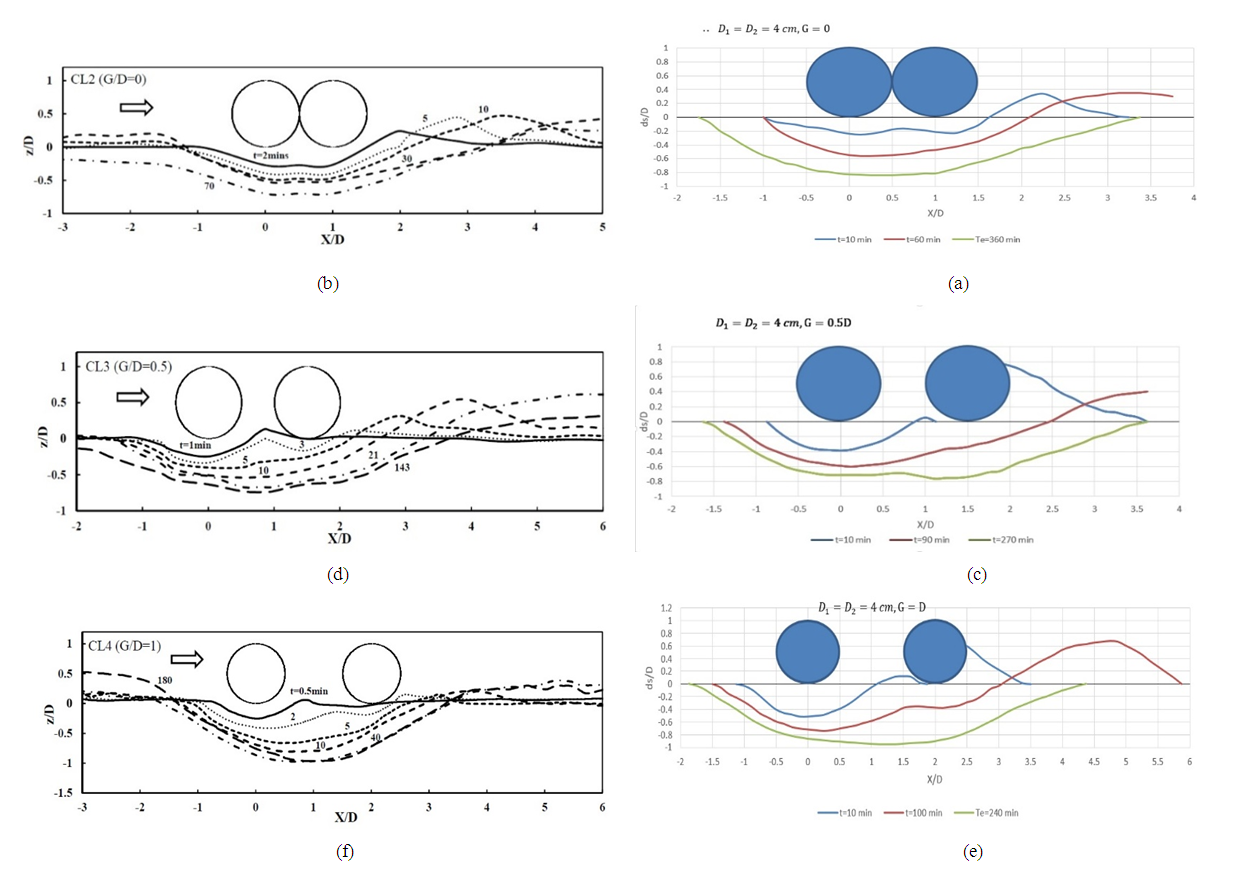 | Figure 5. a, c, e) The scour profiles of two pipelines with 4 cm diameter and G=0,0.5,1, respectively; b,d,f) scour profiles of two pipelines with 15 cm diameter and G=0,0.5,1, respectively in Zhang et al. (2017) study |
In all profiles, it was observed that the maximum scour depth was formed in the middle of the two pipes. It can be said that the formation process of scour profiles in diagrams (a) and (b) were similar and the difference in maximum scour depths was due to the larger diameter of the pipe in Zhang et al. (2017) [2] studies because with increasing pipe diameter, the scour depth to pipe diameter ratio  was reduced. Also, differences in the criteria for stopping experiments can be a reason for differences in scour depth results. In these two profiles, it was also observed that the scour depth under the upstream and downstream pipes was very close to each other.Examination of two sections (c) and (d) shows that the scour hole first formed under the upstream pipe and then extended below the downstream pipe. Early onset of scouring, the scour depth below the upstream pipe was greater than the scour depth below the downstream pipe. Over time, this difference decreased, and eventually the scour depth below the downstream pipe became greater than the scour depth below the upstream pipe.A summary of experimental data is presented in Table 3. The values in column 3 of this table showed that by increasing the distance between two pipes from
  to
to  the width of the scouring hole had increased and the time required to stop the experiments had increased by 30 to 35% as well. According to columns 4, 6 and 8 in table 3,
  was checked in all cases. The column 9 of table 3 showed that with increasing the distance between two pipes from
  to
to  the maximum scour depth decreased by 8 to 10% and by increasing the distance between the two pipes from
  to
to  the maximum scour depth increased by 10 to 20%. As Westerhorstmann et al. (1992) [1] reported during two-pipe experiments in clear-water conditions, the lowest scour depth was obtained in
  . Column 11 of Table 3 showed that the maximum scour depth in three
  ,
,  and
and  cases, were 22.5%, 12% and 32%, respectively, greater than the maximum scour depth of a single pipe.
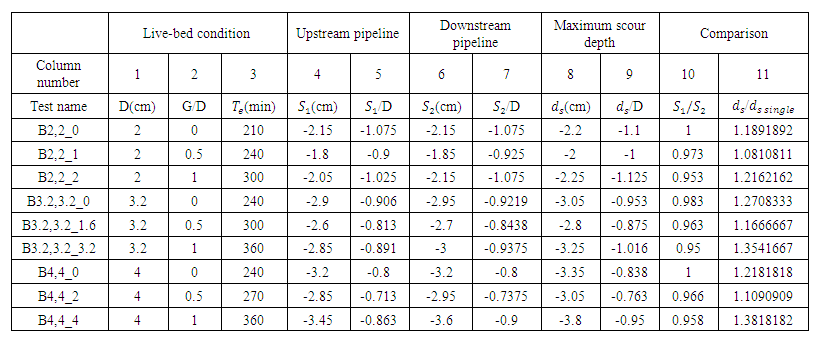 | Table 3. Results of Double-pipe with the Same Diameters Tests |
4.2. Tests on Two-Pipe Configuration with Different Diameters
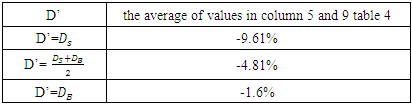
As stated in experiments with two pipes with the same diameter, the distance between the pipes (G) was applied, based on a multiple of the pipe diameter (D). In this section, due to the difference in diameters of two pipes, it was decided to consider a new criterion with the symbol D' for the distance between the two pipes and to adjust the distance between the pipes based on  To determine D', it was assumed that the optimal distance G = 0.5D also applied to this section, a number of experiments were performed under live-bed conditions. In these experiments, two pipes with diameters of 3.2 and 4cm
 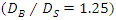 were used. In these experiments, first the two pipes, without distance (G = 0), were investigated in two modes S-B and B-S and the maximum scour depth was recorded. In the next step for each of this two configurations, three separate experiments were performed, so that in the first and second experiments, the average diameter (D') was assumed to be equal to the diameter of the larger and smaller pipe, respectively
 In the third test, the average diameter (D’) was considered equal to the average diameter of two pipes
  In each of these three tests, the distance between the pipes was set to G = 0.5D'. Tables 4 and 5 present the results of experiments.
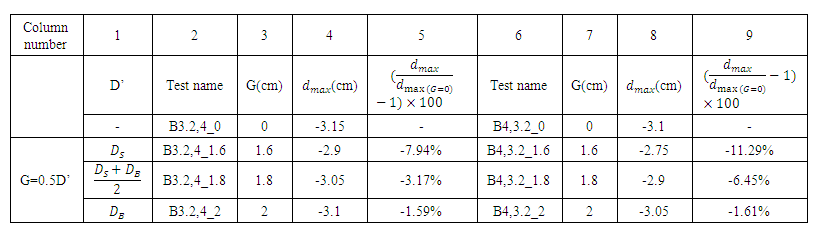 | Table 4. Results of Experiments to Determine D’ in Double-pipe with Different Diameter System |
Table 5. A Summary of Values in Table 4
 |
| |
|
According to Table 5, it was considered that for these two pipes 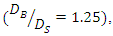 if the average diameter was equal to the smaller pipe diameter
  the changes of scour depth in the two cases G / D = 0,0.5 were in agreement with the changes of scour depth below two pipes with the same diameter, so in the following experiments which performed for different
  the average diameter was considered equal to the diameter of the smaller pipe
  This result was obtained for
  and its performance and certification for the diameter of other pipes were tested in subsequent tests.Then,
  (3.2 and 4cm),
  (2 and 3.2cm) and
  (2 and 4cm) in B-S and S-B layouts at three intervals G / D'= 0, 0.5 and 1 were examined. In the
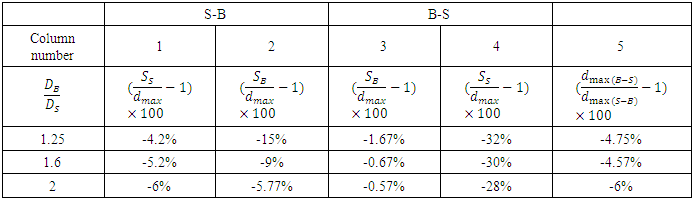
  case in both S-B and B-S layouts, regardless of the location of pipes, the maximum scour depth below the upstream pipe was slightly different from the maximum scour depth, and the maximum scour depth under the downstream pipe had always been less than the maximum scour depth. In the S-B mode the difference was on average 15%, while in the B-S mode this difference was on average 32%, and also the maximum scour depth in B-S mode was on average 4.75% less than in the S-B mode. Therefore, among the six experiments performed in the
  case, the lowest scour depth occurred at B-S and at
 assuming
  In the case
  similar to previous arrangement in both S-B and B-S modes, the scour depth below the upstream pipe was less different from the maximum scour depth. Also, the scour depth under the downstream pipe was 9% on average in the S-B mode and 30% on average in the S-B mode less than the maximum scour depth. In both B-S and S-B modes, as the distance between the two pipes increased, the scour depth below the downstream pipe decreased continuously. Therefore, the lowest scour depth was formed under the downstream pipe at G / D’= 1. Also, the average diameter
  which was obtained based on the state
 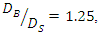 was also valid on
  and the maximum scour depth reached its minimum value in the state G = 0.5D'. At G = 0.5D', the maximum scour depth in the B-S model was on average 4.57% lower than in the S-B model.In the
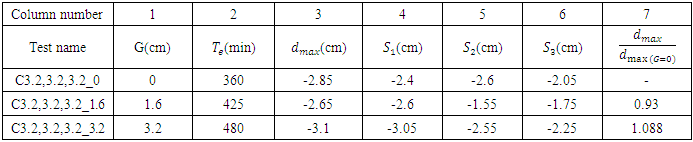
  case in both S-B and B-S layouts, regardless of how the pipes were located relative to each other, the scour depth below the upstream pipe was less different from the maximum scour depth and often the maximum scour depth below the upstream pipe was formed. In the three experiments performed in the S-B mode, the scour depth below the downstream pipe was also close to the maximum scour depth on average 5.77% less. While in the three experiments performed in the B-S model, the difference in scour depth under the downstream pipe was greater than the maximum scour depth and this difference is on average 28%. Also, by changing the distance from G / D’= 0 to G / D’ = 0.5 and G / D’= 1, the maximum scour depth decreased by 6.25% and 12.85%, respectively. These changes indicated that the criterion used for the mean diameter
  for the optimal distance G = 05D' was not true in the
  arrangement. According to Table 6, it can be observed that in both B-S and S-B cases, the lowest scour depth was formed under the pipes at G = 2cm. In this case, if one considered the diameter of the larger pipe as the average diameter
  one can justify the reduction of scour depth at G = 2cm, because in this case the distance between the two pipes was equal to G = 0.5D'. These results indicated that D’ depended on
  Results of the three layouts investigated for the two-pipe systems with different diameters are summarized in Table 7. According to Table 7, it was considered that by exposing the larger diameter pipe to the flow (upstream), the scour depth was proportional to the diameter of the pipe formed below it. On the other hand, because the pipe with a smaller diameter was located downstream, the vortices formed downstream of the pipes would be smaller and would have less power, and the scour under the smaller pipe would proceed at a slower speed and its depth would be smaller. The intensity of these vortices depended on the size of the downstream pipe, and as the diameter of this pipe changed, the shape and depth of the scour hole below the downstream pipe changed.
Table 6. Comparison of Maximum Scour Depths in S-B & B-S Mode for

 |
| |
|
Table 7. A Summary of Results of Double-pipe with Different Diameters Tests. (all of numbers presented in this table are the average of three tests performed in each case)
 |
| |
|
4.3. Three-pipe Tests
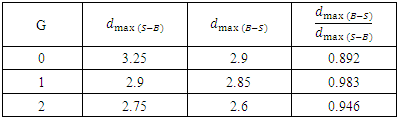
In this section, first, three experiments were performed with three pipes with diameters of 3.2 cm at intervals of G = 0, 0.5D and D. Table 8 shows the details of these experiments. According to Table 8 in three-pipe experiments, as in two-pipe experiments, first, with increasing distance between the pipes, the width of scouring hole had also increased. Second, the maximum scour depth reached the minimum value when the pipes were at a distance of G = 0.5 from each other. As stated by Westerhorstmann et al. (1992) [1] in the three-pipe system, the maximum scouring depth reached a minimum value at G = 0.5D. Then, two three-pipe experiments with different diameters of 2.5, 3.2, and 4 cm were performed, which were exposed to flow, once descending (B-S) and once ascending (S-B). In both B-S and S-B modes, the maximum scour depth formed under the larger diameter pipe. Based on this result, it can be said that the location of the maximum scour depth depends on the location of the larger diameter pipe in the three-pipe system. Comparison of scour depths obtained in these two experiments showed that the maximum scour depth in B-S model was 8.1% less than this depth for S-B model. Therefore, the optimal combination in terms of scouring for a three-pipe system with different diameters was a combination in which the pipes were exposed to the flow in descending (in terms of diameter). Results of the three-pipe experiments showed that the formation and development of scouring under pipes with different diameters were similar for two or three pipes.Table 8. Results of Three-pipe System with the Same Diameter System in Three G=0,0.5,1 Cases
 |
| |
|
5. Conclusions
For two pipes with the same diameter, 9 experiments were performed for 3 pipe diameters of 2, 3.2 and 4 cm in three  cases. The results show that1. With increasing distance between two pipes from
  to
to  the width of the scour hole increases and the duration of the test increases by 30% to 35%.2. In all cases
 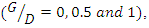 the scour depth below the downstream and upstream pipe is less than the maximum scour depth.
  3. The scouring depth in three cases
 and
and  are, respectively, 22.5, 12 and 32% more than the scouring depth below a single pipe.4. The optimal arrangement in terms of minimum scour depth is the distance between the two pipes equal to G = 0.5D.5. Based on the results, the optimal location for three ratios
  is the one in which the larger diameter pipe is upstream and the smaller diameter pipe is downstream (B-S model). Also, the two pipes should be spaced G = 0.5D'. According to the results for
  , smaller pipe as average diameter
  and for
  larger pipe as a criterion
  are used.6. For three pipes with the same diameter, the optimal arrangement in terms of scouring is one for three pipes with G = 0.5D apart. Also, for three pipes with different diameters, the optimal location of the pipes is in descending order (in terms of diameter). Also, the location of the maximum scouring depth is below the larger diameter pipe.7. Results of three-pipe experiments with different diameters are similar to the results of two-pipe experiments with different diameters. This match shows that the formation and development of scouring in pipes with different diameters are similar in both two-pipe and three-pipe compositions.
Notation
The following symbols are used in this paper: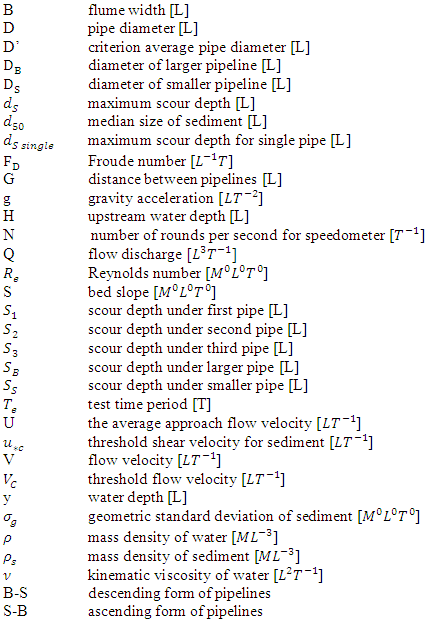
References
| [1] | J. H. Westerhorstmann, J. L. Machemehl, and C. H. Jo, “Effect of pipe spacing on marine pipeline scour,” Proc. Second Int. Offshore Polar Eng. Conf., vol. II, no. June, pp. 101–109, 1992. |
| [2] | Q. Zhang, S. Draper, L. Cheng, and M. Zhao, “Experimental Study of Local Scour Beneath Two Tandem pipelines in steady current,” Coast. Eng. J., vol. 59, no. 2, 2017. |
| [3] | S. Dey and N. P. Singh, “Clear-Water Scour below Underwater Pipelines under Steady Flow,” J. Hydraul. Eng., vol. 134, no. 5, pp. 588–600, 2008. |
| [4] | J. Yang, Y. M. Low, C. H. Lee, and Y. M. Chiew, “Numerical simulation of scour around a submarine pipeline using computational fluid dynamics and discrete element method,” Appl. Math. Model., vol. 55, pp. 400–416, 2018. |
| [5] | Y. Mao, “The interaction between a pipeline and an erodible bed,” Ser. Pap. Tech. Univ. Denmark, no. 39, Mar. 1986. |
| [6] | S. P. Kjeldsen, O. Gjorsvik, K. G. Bringaker, and J. Jacobsen, “LOCAL SCOUR NEAR OFFSHORE PIPELINES,” Aug. 1973. |
| [7] | A. Ibrahim and C. Nalluri, “Scour prediction around marine pipelines,” Proc.5th Int. Symp. on Offshore Mech. Arct. Eng. Tokyo, Japan, pp. 679–684. |
| [8] | M. Zhao, S. Vaidya, Q. Zhang, and L. Cheng, “Local scour around two pipelines in tandem in steady current,” Coast. Eng., vol. 98, pp. 1–15, Apr. 2015. |
| [9] | Y. Li, M. C. Ong, D. R. Fuhrman, and B. E. Larsen, “Numerical investigation of wave-plus-current induced scour beneath two submarine pipelines in tandem,” Coast. Eng., vol. 156, no. December 2019, p. 103619, 2020. |
| [10] | S. Yang, B. Shi, Y. Guo, and L. Yang, “Investigation on scour protection of submarine piggyback pipeline,” Ocean Eng., vol. 182, pp. 442–450, Jun. 2019. |

 Abstract
 Reference
 Full-Text PDF
 Full-text HTML