-
Paper Information
- Paper Submission
-
Journal Information
- About This Journal
- Editorial Board
- Current Issue
- Archive
- Author Guidelines
- Contact Us
International Journal of Hydraulic Engineering
p-ISSN: 2169-9771 e-ISSN: 2169-9801
2021; 10(1): 19-25
doi:10.5923/j.ijhe.20211001.03
Received: May 7, 2021; Accepted: Jun. 14, 2021; Published: Jul. 26, 2021

Effect of Vegetation Patch Distribution on the Flow Resistance
 Abstract
 Reference
 Full-Text PDF
 Full-text HTML
Sadegh Derakhshan 1, Hossein Afzalimehr 1, Vijay P. Singh 2
1Department of Civil Engineering, Iran University of Science and Technology, Tehran, Iran
2Department of Biological & Agricultural Engineering & Zachry Department of Civil and Environmental Engineering, Texas A&M Univ., College Station, Texas, USA
Correspondence to: Hossein Afzalimehr , Department of Civil Engineering, Iran University of Science and Technology, Tehran, Iran.
| Email: |  |
Copyright © 2021 The Author(s). Published by Scientific & Academic Publishing.
This work is licensed under the Creative Commons Attribution International License (CC BY).
http://creativecommons.org/licenses/by/4.0/

The presence of aquatic vegetation provides valuable ecosystem services, decreases flow conveyance capacity and generates flow resistance. The resistance due to vegetation depends on flow conditions and vegetation parameters. Few studies have addressed the effect of vegetation distribution on flow resistance. This study investigated the effect of distribution of vegetation patches on the flow resistance and the flow field experimentally in a laboratory flume where rigid cylinders were used to represent vegetation. The vegetation density was kept constant, however, the vegetation was clustered longitudinally and transversally to form different configurations. Results showed that the distribution of vegetation patches was an important parameter in the prediction of flow resistance and the effect of vegetation distribution pattern caused up to 40% extra resistance, while the density of the vegetation remained unchanged. The clustering of vegetation patches along the longitudinal axis of channel generated more friction than did transversal clustering. Evaluation of the effect of distribution pattern of vegetation patches on flow resistance provides valuable information for removing vegetation from streams in a pattern that leads to the maximum reduction in flow resistance.
Keywords: Flow resistance, Vegetation, Patch distribution, Clustering
Cite this paper: Sadegh Derakhshan , Hossein Afzalimehr , Vijay P. Singh , Effect of Vegetation Patch Distribution on the Flow Resistance, International Journal of Hydraulic Engineering, Vol. 10 No. 1, 2021, pp. 19-25. doi: 10.5923/j.ijhe.20211001.03.
1. Introduction
- It is now accepted that the presence of vegetation in aquatic environments serves various purposes, such as the improvement of water quality in wetlands and rivers (Wang et al. 2014; Rowiński et al. 2018, Afzalimehr et al. 2021), coastal protection against storm surges and waves (Möller et al. 2014; Luhar and Nepf 2016), providing a habitat for living organisms and aquatic species, and promoting biodiversity (Yi et al. 2017; Polvi and Sarneel 2018). Aquatic vegetation or macrophytes provide these valuable services through the alteration of flow field (Nepf 2012). Management of aquatic environments and the utilization of aquatic vegetation for the aforementioned services require modelling of the water-vegetation interaction and the underlying physical and biological processes (Marion et al. 2014). The presence of macrophytes in aquatic environments decreases flow velocity and the conveyance capacity of open channels, as vegetation obstructs the flow and produces hydraulic resistance (Baptist et al. 2010; Green 2005b), consequently the water level rises which may cause flooding of adjacent lands which can be damaging especially in urban and agricultural areas (Rasmussen et al. 2021). Therefore, attempts are being made to find ways to reduce hydraulic resistance while maintaining the ecological functions of vegetated channels (Luhar and Nepf 2013).Flow resistance due to vegetation depends on hydraulic and vegetation parameters, such as density, relative submergence, plant morphology, vegetation patchiness, and plant flexibility (Nikora et al. 2008; Fathi-Moghadam et al. 2011; Green 2006). Numerous sstudies have been done to evaluate the effect of different vegetation parameters on flow resistance (Green 2005a; Nikora et al. 2008; Järvelä 2005, Afzalimehr et al. 2019), but few have addressed the effect of vegetation patch distribution pattern on flow resistance. Literature shows that the effect of vegetation patch distribution on the flow field can have implications for flow resistance (Bal et al. 2011), contaminant removal efficiency (Sabokrouhiyeh et al. 2020), channel morphology, and sediment transport (Shan et al. 2020). Considering that vegetation occurs in heterogeneous patches in the natural environment (Anjum and Tanaka 2019; Schoelynck et al. 2012, Jahadi et al. 2020), this topic calls for a detailed investigation. Furthermore, vegetation is often removed from channels to facilitate flow of water and prevent flooding of adjacent lands (Bal et al. 2017; Errico et al. 2018).This study experimentally investigates the effect of vegetation patch distribution on the flow field and flow resistance in a laboratory flume using five different distribution patterns of vegetation patches. The objectives of this study therefore are to obtain insights into the effect of patchiness on the hydrodynamics of vegetated channels and to determine the pattern of vegetation removal that causes the most reduction of hydraulic resistance.
2. Methodology
- Experiments were conducted in a 13 m long and 0.45 m wide horizontal flume located at the Iran Water Research Institution. The water depth was fixed at 24 cm under submerged vegetation condition. 48 Wooden cylinders with a diameter of 1 cm and height of 10 cm were used as vegetation in the flume. Other studies have also used rigid cylinders to represent vegetation (Tinoco, San Juan, and Mullarney 2020). The cylinders were placed together to form different patterns of patches in each experiment (Fig. 1). The number of cylinders for the 5 experiments remained the same so as to keep the density of vegetation constant which was the main parameter effecting flow resistance (Nikora et al. 2008; Fathi-Moghadam et al. 2011). However, the distribution pattern was changed in order to compare the hydrodynamics of different distribution patterns. The patches were 10 cm apart in the transversal direction and 20 cm apart in the longitudinal direction (except for the last pattern in which the patches were 15 cm apart). The patches were placed at approximately 9 m from the flume entrance to reach the fully developed flow conditions. Gravel with uniform particle size distribution with d50 =15 mm was used to cover the bed.
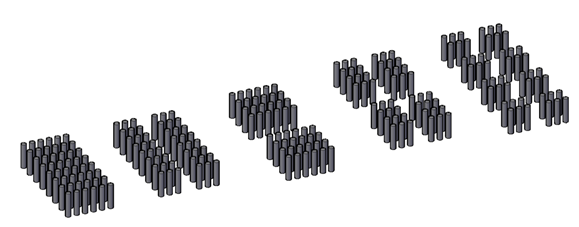 | Figure 1. Distribution pattern 1 through 5 from the left |
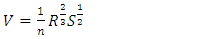 | (1) |
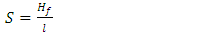 | (2) |
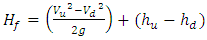 | (3) |
3. Results and Discussion
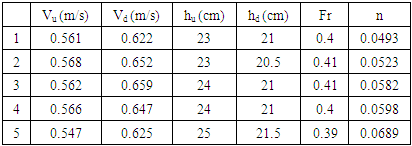
- After measuring velocity and flow depth at the upstream and downstream, Manning’s coefficient value for the 5 configurations was calculated (presented in table 1). Fig. 2 shows that Manning’s coefficient increased as the number of patches (N) increased (almost 40% for the last pattern) with the exception of the second and third configurations which had the same number of patches, however, the third configuration revealed approximately 11% more flow resistance than did the second one. Vegetation was clustered transversally in the second configuration, whereas it was clustered longitudinally in the third pattern.
|
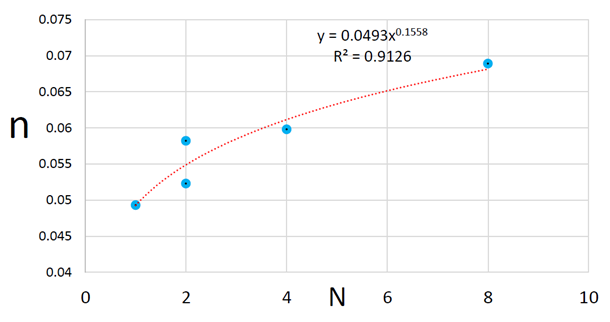 | Figure 2. Manning’s coefficient (n) against the number of patches (N) |
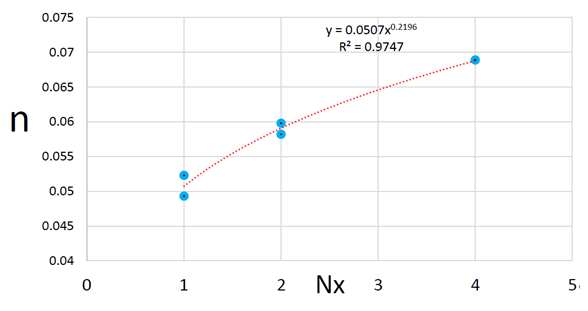 | Figure 3. Manning’s coefficient against the number of patches in the longitudinal direction |
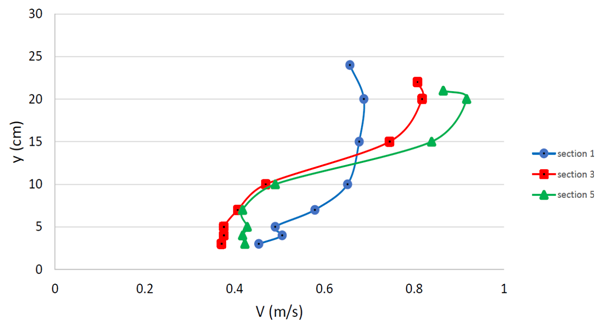 | Figure 4. Velocity profile of sections 1, 3 and 5 of the third configuration |
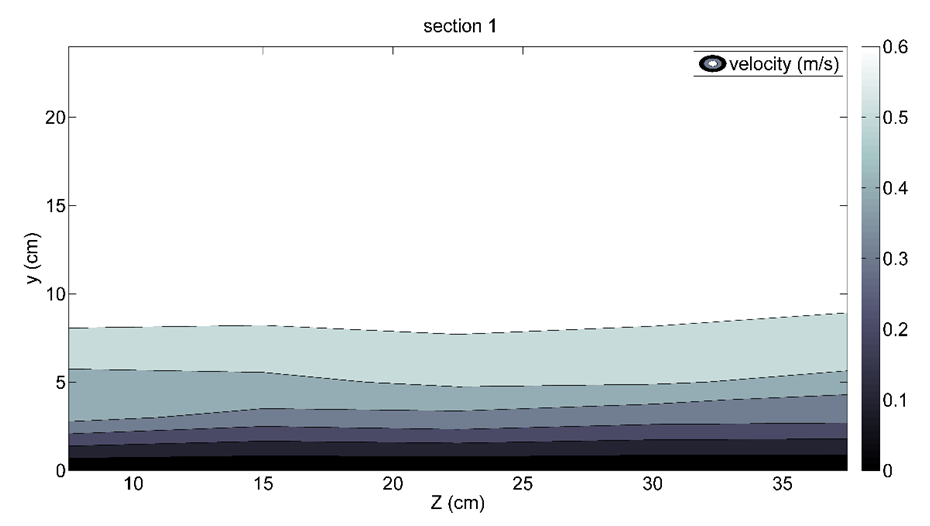 | Figure 5. Velocity contour of section 1 of the fourth configuration |
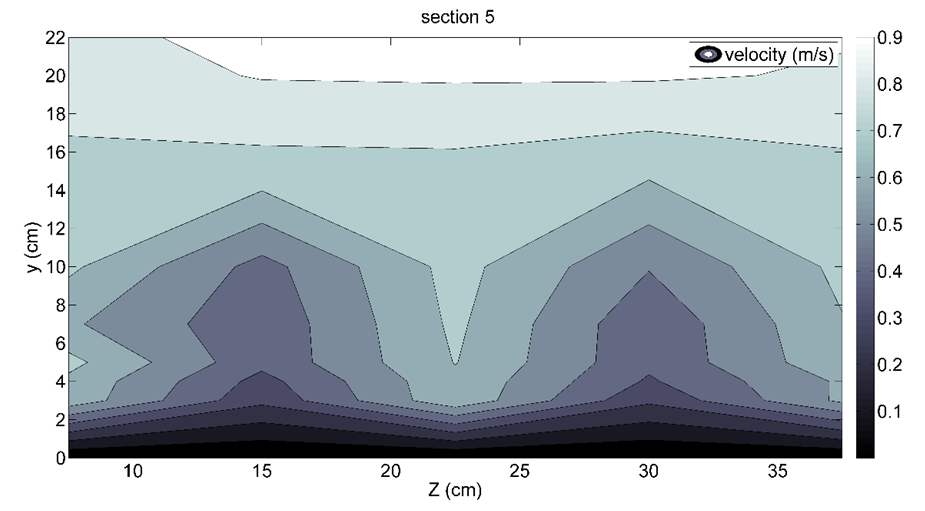 | Figure 6. Velocity contour of the section 5 of the fourth configuration |
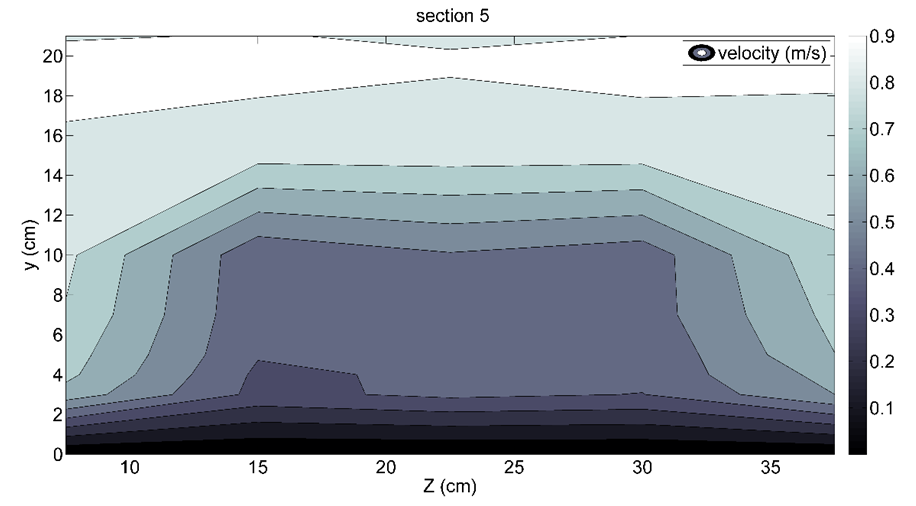 | Figure 7. Velocity contour of section 5 of the third configuration |
 | Figure 8. Velocity contour of the fifth configuration in the x-y plane |
4. Conclusions
- Experiments were carried out to study the effect of vegetation patch distribution on the flow field and flow resistance using rigid cylinders representing vegetation. Results showed that flow resistance varied significantly with the changing vegetation distribution pattern, even though the density remained unchanged which is an important finding because the flow resistance models use density, submergence ratio, and flexibility as input parameters. To our knowledge, no flow resistance model has revealed the effect of different vegetation patch patterns. The longitudinal clustering of vegetation produces more hydraulic resistance than the transversal clustering which has been observed before. Results of this study provide a better restoration approach by considering optimal cutting and removal pattern of vegetation in open channel hydraulics.