-
Paper Information
- Paper Submission
-
Journal Information
- About This Journal
- Editorial Board
- Current Issue
- Archive
- Author Guidelines
- Contact Us
International Journal of Hydraulic Engineering
p-ISSN: 2169-9771 e-ISSN: 2169-9801
2021; 10(1): 8-18
doi:10.5923/j.ijhe.20211001.02
Received: Jan. 17, 2021; Accepted: Feb. 5, 2021; Published: Mar. 15, 2021

Impact of Pool and Vegetated Bottom on Turbulant Flow Structure
 Abstract
 Reference
 Full-Text PDF
 Full-text HTML
Parsa Parvizi1, Hossein Afzalimehr2, Vijay P. Singh3
1Department Water Engineering, Isfahan University of Technology, Isfahan, Iran
2Department of Civil Engineering, Iran University of Science and Technology, Tehran, Iran
3Department of Biological & Agricultural Engineering & Zachry Department of Civil and Environmental Engineering, Texas A&M Univ., College Station, Texas, USA
Correspondence to: Hossein Afzalimehr, Department of Civil Engineering, Iran University of Science and Technology, Tehran, Iran.
| Email: |  |
Copyright © 2021 The Author(s). Published by Scientific & Academic Publishing.
This work is licensed under the Creative Commons Attribution International License (CC BY).
http://creativecommons.org/licenses/by/4.0/

This paper reports a laboratory study of turbulent flow characteristics over a pool bed-form at different cross-sections in a flume. Experiments were conducted for two cases, with and without the presence of vegetative over gravel bed-form, to investigate interactions between pool bed-form, vegetation, and flow non-uniformity. Artificial grass was attached to the bottom of the pool bed as a vegetation, and the median diameter of gravel was 50 mm. To compare the results with those of the previous studies, the flow discharge was chosen as 10 Lit/sec and 40 Lit/sec. The non-uniformity of flow in the pool section and the existence of vegetation affected the flow conditions in the flume, including mean velocity, turbulence components, and Reynolds shear stress distribution. The quadrant analysis method was used to study the Reynolds stress and dominant events of turbulent flow structures. Results showed that the interaction of vegetation and pool changed the distribution of Reynolds shear stress profiles, and intermittent increasing and decreasing representations occurred in the various parts of the bed form, and the occurrence of ejection and sweep events near the vegetation in the experiments with higher Reynolds numbers. The logarithmic law well fitted the double average velocity profiles, which justified the validity of this law. The roughness coefficient in the accelerating section was larger than in the decelerating one and in the middle section of the pool.
Keywords: Bed form, Quadrant analysis, Shear velocity, Reynolds shear stress, Vegetated bottom
Cite this paper: Parsa Parvizi, Hossein Afzalimehr, Vijay P. Singh, Impact of Pool and Vegetated Bottom on Turbulant Flow Structure, International Journal of Hydraulic Engineering, Vol. 10 No. 1, 2021, pp. 8-18. doi: 10.5923/j.ijhe.20211001.02.
Article Outline
1. Introduction
- The three-dimensional dynamics of natural flows in rivers creates different shapes of bed-forms which occur in both horizontal and vertical scales. Vertical fluctuations create different bed-shapes on riverbeds and have a significant effect on the flow structure. The regular pattern of sequential pool and riffle bed-forms have been studied in previous studies [1-5]. There are various theories about how pool bed-shapes form. The generation of turbulent vortices shows that turbulence in a straight channel in flow through uneven surfaces could produce large accelerating and decelerating vortices [6-9]. The interaction between vorticities and the movement of sediment particles, assuming that the velocity does not exceed the threshold, create erosion at some points, and sediment accumulation at other points, which result in the formation of sequential pool and riffle bed shapes in rivers. The velocity reversal hypothesis states that the mean velocity and shear stress in the pool section in the presence of low flow discharge are lower than in the riffle section [10-11]. Therefore, shear stress in the riffle bed-form causes sediments to move in the pool sections, which would explain why pools display smaller grain sizes than riffles. At high flow rates, the velocity in the pool section becomes greater than in the riffle section and causes coarser sediment to be entrained from riffle into pools. However, the accumulated sediment does not deposit, and move to the downstream riffle section, because of velocity reversal, which can lead to return the shear stress and higher velocities in the pool. Keller attributed this phenomenon to the presence of local particle granulation mechanism in the form of pool and riffle bed-forms. The study of this theory using numerical methods, modeling, and experiments is still ongoing. The lateral convergence and divergence of flow with associated phase shifts in shear stress causes the formation and maintenance of a pool bed-form [12-15]. Previous researches show that the non-uniformity flow existing in the pool section affects the flow conditions through the channel, such as mean velocity, turbulence components, and Reynolds shear stress distribution [16-18]. The flow depth in a pool will first increase, with a positive or an adverse pressure gradient, resulting in decelerating flow (CDF) in the stream wise direction. Then, this will be followed by uniform flow in the middle of the pool, and will reach accelerating flow (CAF) with a favorable or negative pressure gradient [19-23]. The velocity distribution in CAF in the inner zone near the bed has higher values due to the changes in boundary conditions. The average of entrance slope and exit slope of the pool section can be considered equal, and is generally less than 6° [24-25]. Interactions between turbulent flow and vegetation occur at multiple interconnected scales, such as leaf, plant patch, and plant mosaic scale or on extended canopies of sufficient length to allow fully developed flow. In fact, vegetation broadly affects the velocity distribution in boundary layers. In the presence of vegetation, the thickness of the boundary layer increases and the velocity inside this layer decreases. The presence of vegetation on the bed and wall of the channel would create fluctuations in the average velocity and hydraulic parameters in the turbulent flow. Submerged vegetation could significantly affect the transfer of sediment, food, pollution, water-soluble oxygen, and the life of aquatic plants and animals due to changes in the hydrodynamic fluctuations. Vegetation density is one of the most important parameters in drag control: increasing vegetation density increases flow resistance and reduces the drag coefficient. In addition, the amount of momentum decreases with the presence of vegetation due to the increase of flow resistance. Moreover, momentum exchange between the inner and upper layers of vegetation makes it difficult to analyze the vertical velocity distribution. The extra drag force generated by plants reduces the average flow through vegetation. Carlo et al. investigated the flow structure and velocity profiles in the presence of natural planted grass. Results showed that three regions could be detected in the velocity profile [25]. The first region is inside the vegetation where velocity is very low, the region above is where the logarithmic law fits the velocity data, and the third region is the area with positive velocity gradient, which reaches zero on the surface of water. In the second region, there is a point at which the velocity distribution changes its direction, and the turbulence component values reach their maximum value. Investigation of the turbulence structure near walls and bed and Reynolds shear stress significantly helped understand the structure of coherent flows in these regions. By studying the uniform flow in vegetation, Afzalimehr et al. showed that all the events in the bursting process were effective in the structure of turbulent flow. However, the sweeping event near the vegetation is the predominant event. Near the water surface, the role of outward and inward events is predominant. In addition, the shear stress has its maximum value at the relative depth Z/H = 0.5, while the logarithmic law is established in the domain of relative depth Z/H = 0.5 [26]. Studies on vegetation have shown that the velocity distribution near the bed follows the logarithmic law, although the velocity distribution deviation from the logarithmic law near the water surface is due to secondary currents [27]. Despite many advances, there is still a great deal of information lacking and there are sometimes contradictions about turbulent flow over vegetation, which indicates the inherent complexity of the turbulence phenomenon, leading to different interpretations of the reality of turbulent flows. This study describes a flume experiment of a forced pool with the presence of vegetation on the floor. The objectives of this research therefore are: (1) To investigate the mechanism of two-dimensional pool bed-form under three-dimensional non-uniform flow; (2) To examine the impact of vegetation in pool bed-form section on the components of velocity profiles, shear velocity, and Reynolds shear stress; (3) To analyze the flow characteristics for two different Reynolds numbers with vegetation in the bed-form and without vegetation; (4) To survey the dominant events of turbulent flow structures by quadrant analysis; and (5) To examine the log law validation of velocity and present it bythe double averaging method.
2. Methods
2.1. Experiments Set up and Methods
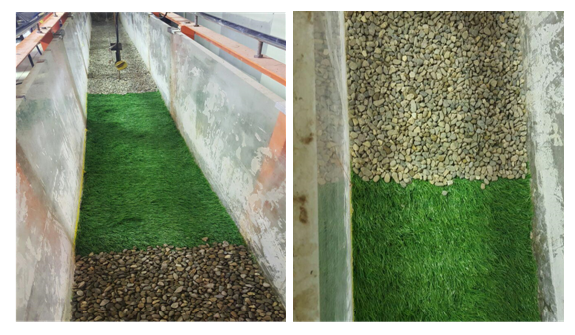
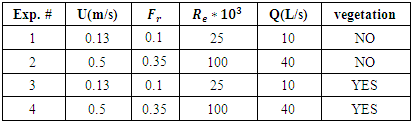
- Experiments were carried out in a horizontal recirculating flume 8m long, 40cm wide, and 60cm deep in the Hydraulics Laboratory of Isfahan University of Technology, Iran. The beds and walls of the flume were made of glass and a movable downstream gate was used to control the water depth in the channel. A pump with a maximum discharge of 50Lit/s was used to circulate water from a reservoir. To compare our results with previous studies on the artificial pool bed-forms by Najafabadi, Afzalimher and Fazlollahi, the flow discharges were considered as 10 and 40 liters per second. The vegetation was placed over the bottom of the pool section, and in another run, the pool bed-form was investigated without vegetation [28-29]. The experimental flow conditions are shown in table 1. The normal flow depth upstream of the pool section
 was 20cm and the corresponding aspect ratio (the ratio of width to the flow depth) was 2. The artificial pool section with an angle of slope 5° and a length of 1.5 meter was constructed 4.5 m away from the entrance of the flume (Fig 1), where the thickness of boundary layer was fully developed [29]. According to previous studies, sediments in pool bed-forms are smaller than the material size in the riffle section [30-31]. However, later studies have suggested that while the material sizes can be different between pools and riffles, they might be unimportant in statistical calculations [3,32]. The grain sizes in this experiment were well sorted, and following Wolman’s method the median diameter of sediment
  was estimated to be equal 10.4mm using one hundred random samples [33]. The geometric standard deviation of sediment according to the following formula was calculated as 1.16 Showing a uniform distribution of sediment particles, where
  and
and  were 84% and 16% particle diameters finer, respectively.
 | (1) |
 | Figure 1. The experimental set up |
 | (2) |
 | (3) |
|
3. Result and Discussion
3.1. Quadrant Analysis
- The quadrant analysis method was used to study the Reynolds stress distribution of turbulence flows, involving the study of the relationship between the temporal fluctuations of velocity components, and their relationship to a trigonometric circle system with four quadrants. Figure 2 shows a cycle that includes four bursting process events, and oscillations of velocity components in four quadrants of the coordinate system. The components of the speed fluctuations
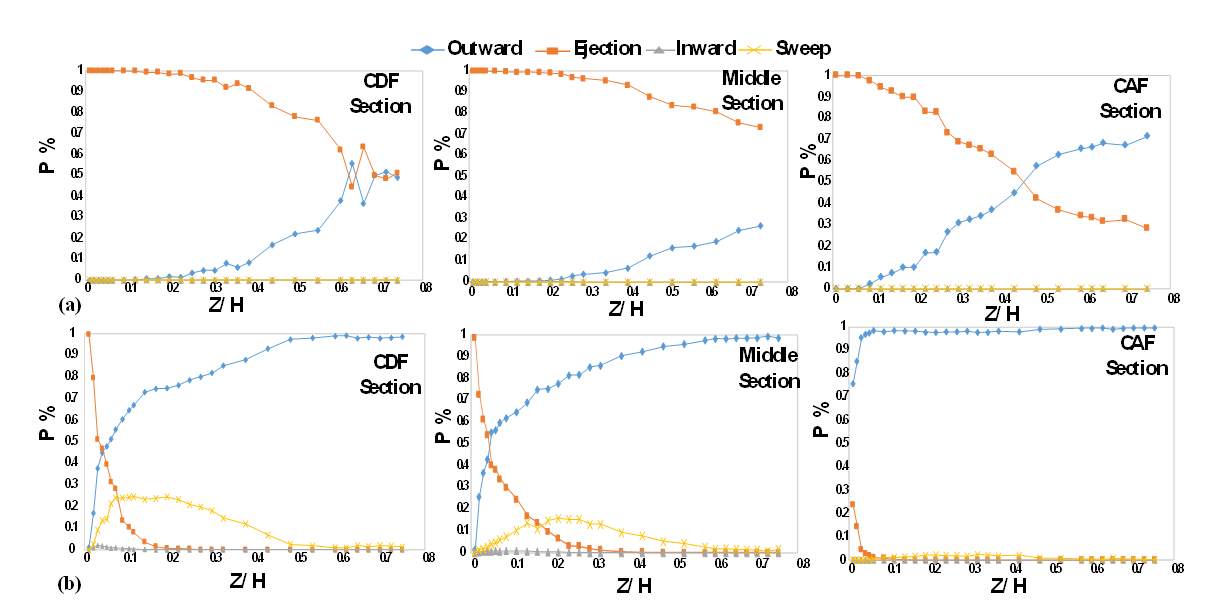
 are plotted against each other to form a quadruple quadrant plane. To determine the contribution of each quadrant, a computer program was written in MATLAB, and the results are shown in the following sections. Figure 3 shows the predominant quadrant analysis of events in the presence of vegetation at three points of the pool bed-form, representing the deceleration section, the uniform section, and the acceleration section, respectively. In experiments with low discharge of the flow through the channel in the presence of grass on the bed-form, ejection was the predominant phenomenon seen in the zone near the grass, and at the same time, in the outer layer of flow, the outward event begins to grow and becomes greater in
  By increasing the flow rate from 10 to 40 liters per second in the decelerating and uniform sections of the pool, in places close to the vegetation, the sweep event was predominant in
  and at the same time, ejection had a decreasing trend in the inner layer. In the way of reaching the flow surface, due to the high velocity in the flow, the outward event tended to grow and reached the highest amount at the water surface.
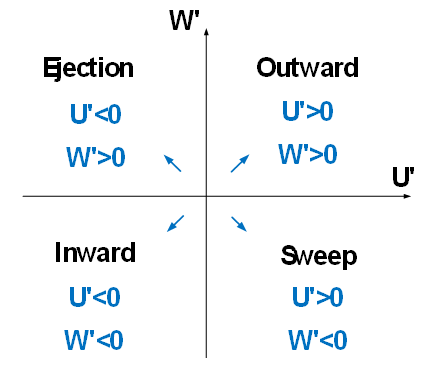 | Figure 2. Bursting Events |
 | Figure 3. Occurrence of predominant events in the presence of vegetation at (a)  Lit/Sec, (b) Lit/Sec, (b)  Lit/Sec Lit/Sec |
3.2. Velocity and Shear Velocity Distribution
- All turbulence parameters, including velocity time series in the streamwise (u), lateral (v), and vertical (w) directions, were decomposed into time averaged
 and turbulent components
  following Reynolds's average law:
 | (4) |
 | (5) |
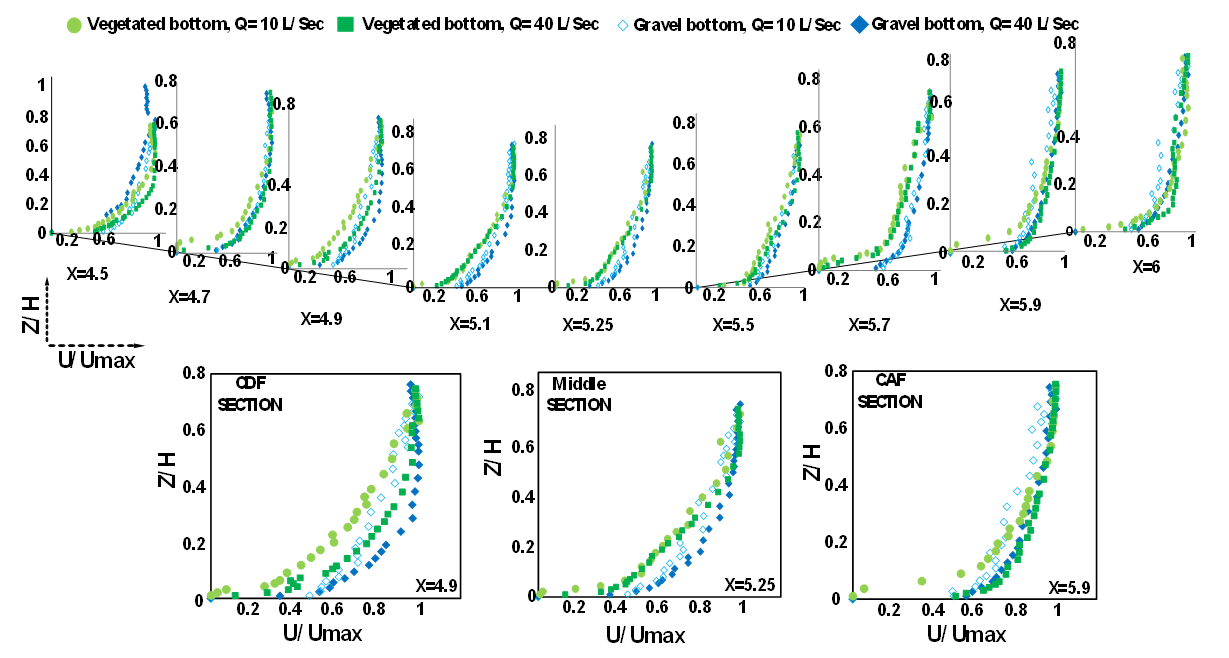 | Figure 4. Dimensionless velocity profiles |
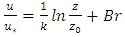
 is the shear velocity, k is the von Karman coefficient equivalent to 0.41 in uniform flow, and
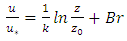
  is the reference bed level. Determination of the reference bed level depends on several factors such as the amount and height of roughness. One of the methods used to determine the bed level, as suggested by Blinco and Partheniades, is to make trial and error using the law of the wall as long as it fits well the velocity data [34]. In the previous studies, the inner zone had been found to extend to a relative depth of
  in uniform and non-uniform flows [16,20,21]. In this study
  was considered equal to
  in the sandy bed, and equal to the height of vegetation in the grass-covered bed. By calculating the best fit for the relation between
  and
and  the height of the inner zone fitted well in the zone
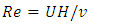
  between 0.1 and 0.2. In the outer zone of the velocity profiles, the velocity data deviated from the law of the wall. The magnitude of this deviation depended on the maximum velocity, the thickness of the boundary layer, and the pressure gradient. The effect of a small amount of aspect ratio was clearly exhibited in the outer region in velocity profiles, and in the inner region it had no effect on determining the amount of shear velocity or the constant of the wall law integral. The effect of sidewalls on the flow caused the current to be three-dimensional, while in a wide channel with
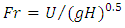
  the effect of walls on the current in the center of the channel could be ignored, and the flow can be considered two-dimensional. In the two-dimensional flow, the maximum velocity occurs at the water surface, while in three-dimensional flow the maximum velocity occurs below the water surface. This phenomenon has been reported under the name of dip [35]. In addition to the aspect ratio (w/h), the dip phenomenon also depends on the Froude number. The amount of dip enhances with increasing Froude number.In the three-dimensional flow, the lateral component of velocity v is towards the central axis from the walls, and the vertical component W is towards the bed (W <0), which causes a downward flow from the water surface. Therefore, a strong vortex develops from the water surface, which causes the maximum velocity to transfer below the water surface. In addition, secondary flow even in wide channels causes the maximum velocity to occur below the water surface. However, some studies on the sandy bed-form with no vegetation show that the dip phenomenon has not occurred in decelerating currents, even with an aspect ratio of less than 5. Afzalimehr et al. studied a sandy bed-form with vegetation on the channel’s walls with
  and observed that the maximum velocity occurred near the bed surface, which showed a significant dip phenomenon [36]. This result indicates that the interaction of flow with sand or vegetation on velocity distribution is very complex, and depends on factors such as longitudinal pressure gradient, accelerating flow, decelerating flow, and uniform flow. Shear velocity
  is an essential parameter for theoretical analysis of the mean velocity profile and turbulence intensity. In fact, it is the most fundamental scale for dimensionless average velocity. In this study, shear velocity calculated from two different methods: boundary layer method and Clauser’s method. The boundary layer method was first proposed by Afzalimehr and Anctil for beds with coarse grains. In this method, the shear velocity was obtained using all points of the velocity profile through the following equations [37]. In these relations,
  is the maximum velocity,
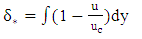
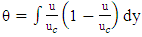
  is the boundary layer displacement thickness, C is a constant coefficient equal to 4.4 for sandy rivers, and θ is the boundary layer momentum thickness, which was obtained through the following equations:
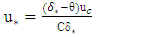 | (6) |
 | (7) |
 | (8) |
 | (9) |
 the mean velocity u was plotted on the vertical axis and
  on the horizontal axis, and the regression line was drawn to fit the data in the inner layer with
  The equation of the fitted line was
  in which the shear velocity can be obtained using the slope, and constant parameters calculated using the width at the origin through the boundary layer theory and Clauser’s method as shown in Figure 5. In both methods, it was observed that with increasing Reynolds number in the flow, the shear velocities increased. In addition, at the same Reynolds number in the currents, the shear velocities over the vegetated flow were greater than the shear velocities in the current with sandy bed. Comparison of the results of these two methods showed that the shear velocities in Clauser’s method had occurred in smaller quantities than in the boundary layer theory method. Moreover, despite the differences in the values of shear velocities in the flow direction, shear velocities followed a trend such as pool bed-form. This observation showed that the shear velocities depended on the flow depth. These results are consistent with the results of Macvicar and Rennie on a sandy pool bed with an angle of 5 degree, and the results of Fazel and Afzalimehr [17,38]. In this study, according to the velocity data collection in the central axis of the channel, shear velocity profiles were at a distance 20 cm from the channel wall. The shear velocities calculated by Clauser’s method were associated with irregularities in the flow direction. The calculated shear velocities
  in the central axis was greater in the acceleration section than in the deceleration section. By comparing the velocity profiles, it was observed that the location of the maximum velocities in the decelerating current was lower than the location of maximum velocities in the accelerating flow. This observation is consistent with the results of Afzalimehr's observations [39]. Moreover, in the presence of secondary currents, the occurrence of low velocity was observed near the water surface. The effects of roughness and bed shape were also noticeable near the bed-form. The presence of vegetation caused lower velocities to occur near the bed-form. In addition, the velocity profiles in the middle part of the pool bed did not follow the linear distribution, which indicated that there was no uniform flow in the middle part of the bed.
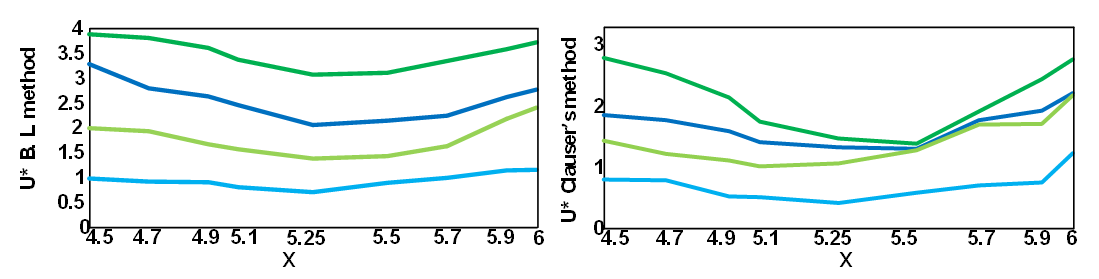 | Figure 5. Shear Velocity calculated by two methods |
3.3. Shear Stress
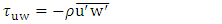
- The Reynolds shear stress is the best parameter for estimating shear stress in the bed and investigating the effects of vegetation over the bed-form. From turbulent fluctuations in stream-wise and vertical directions, Reynolds stress was calculated as follows:
 | (10) |
 | (11) |
 is the flow density, and N is the number of instantaneous samples, which equalled 2400 in this study. The distribution of Reynolds stresses helps find the location of maximum velocity [26]. Also, in non-uniform flow, the shear stress distribution deviates from what occurs in uniform flow. Nezu and Nakagawa stated that during uniform flow, shear stresses near the bed would have the highest value, and in the water surface, the shear stresses tended to zero as the distance of the bed-form increases [40]. In the experiment results, the Reynolds stress profiles were nonlinear in non-uniform current, followed a concave form in accelerating and decelerating sections [20]. In fact, the values of shear stress near the bed were positive, increased when moving away from the bed, and decreased towards negative values near the water surface. Figure 6 confirms the convexity of the stress distribution in the decelerating and accelerating section. The convex shape of the Reynolds stress distribution on the bed shape can be justified by the momentum equation, in which the longitudinal pressure gradient depends on the vertical Reynolds stress distribution
  The higher the pressure gradient, the greater the Reynolds stress value. The Reynolds shear stress in the three sections of currents in the pool are shown in figure 6. The negative values of shear stress near the water surface in the decelerating and middle part of the pool bed are clearly shown in figure 6, and indicate the occurrence of maximum velocities below the water surface. However, in other sections, due to the limitation of ADV, the values of stress on the water surface could not be observed correctly. The presence of vegetation in the bed, especially in the decelerating part and the middle part of the pool bed caused the Reynolds shear stresses to reduce. This trend in the accelerating section was associated with irregularities, especially in the outer layer of flow. The shear stress profiles in the accelerating section of the sandy bed-form were more dispersed due to the residual effect of the decelerating current at the beginning of the bed shape. The results are in accordance with Afzalimehr’s experiments on the rubble bed [41].
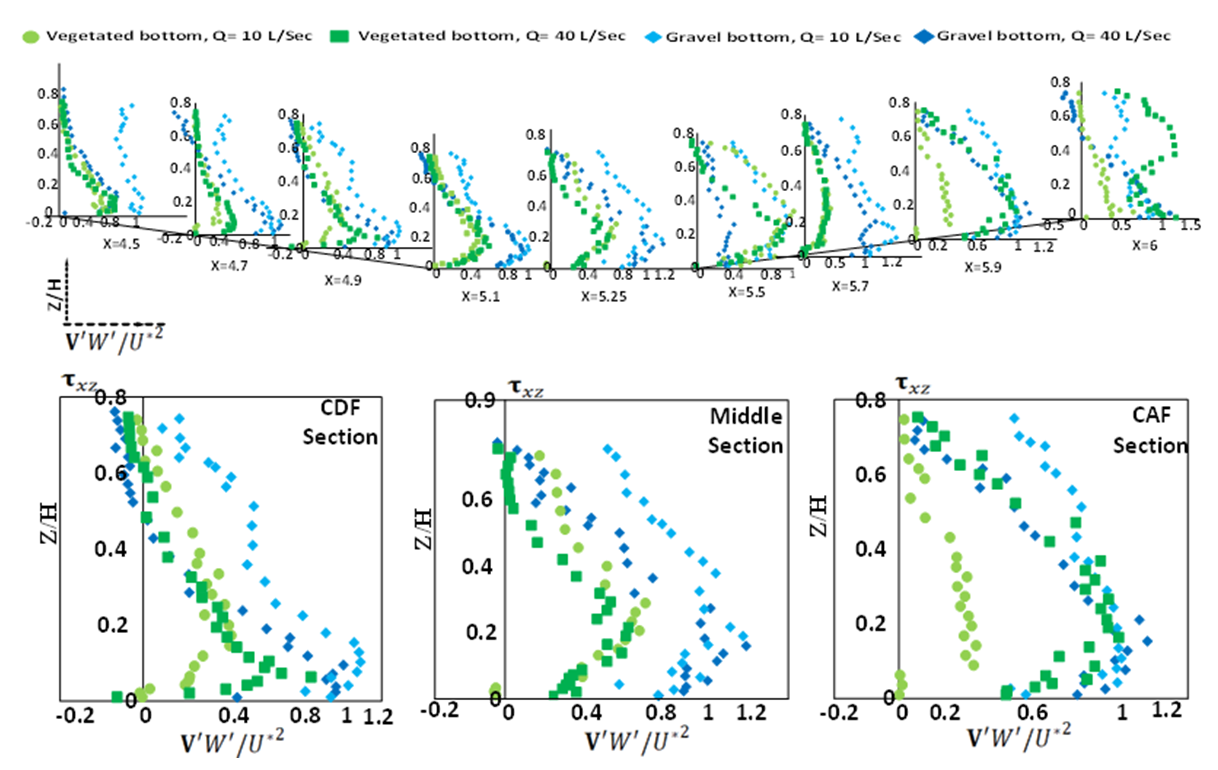 | Figure 6. Reynolds shear stress profiles |
3.4. Investigation of Log Law
- In order to investigate the effect of vegetation on velocity profiles in the inner layer, and to check the validity of rules governing the flow in the zone near the pool bed-form, the logarithmic law was used to check the accuracy of the obtained velocity profiles. According to this law, the velocity data in the inner region, which is known as
 follows the logarithmic function, where Z is the distance from the bed and H is the total depth in the channel. Many researchers have shown that this law fits well the inner region of the velocity profiles in
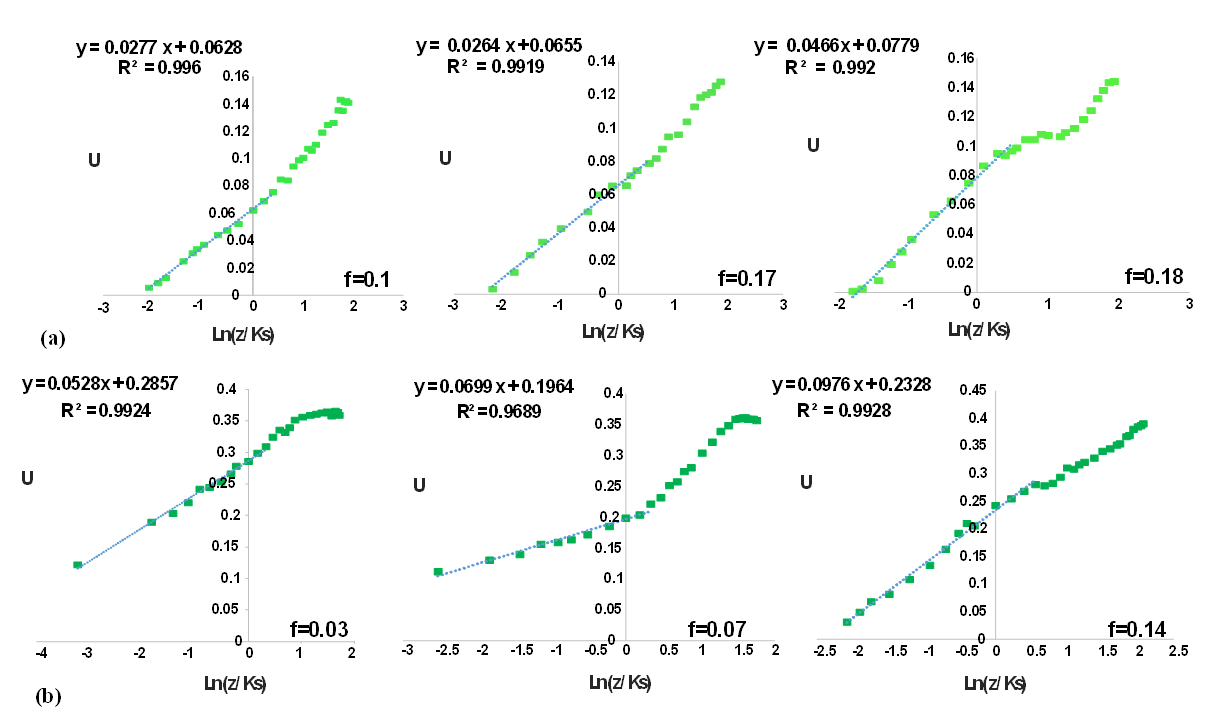
  In addition, in accelerating and decelerating currents the log law is valid [37]. They reported the inner zone as the area of validity of the logarithmic law. Other researchers confirmed the validity of this law in sandy and rubble beds and showed that this law applies to non-uniform currents [41-42]. In non-uniform flow, the pressure in the validity region of the logarithmic law decreases with increasing gradient. Also, the constant of integral B changes slightly by changing the pressure gradient. The von Karman constant (k) is independent of the pressure gradient and has an average value of 0.4 in non-uniform flow. The results of the log law are presented in figure 7 in the presence of vegetation in three sections of the flow with two different Reynolds numbers.
 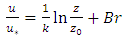 | (12) |
 | Figure 7. Diagram of the log law in flow with discharges, (a)  Lit/Sec, (b) Lit/Sec, (b)  Lit/Sec Lit/Sec |
 | Figure 8. Double average velocity profiles, (a)  Lit/Sec, (b) Lit/Sec, (b)  Lit/Sec Lit/Sec |
 is the average flow velocity,
  is the averaged shear velocity, and "f" is Darcy-Weisbach resistance coefficient:
 | (13) |
 while with increasing flow discharge the area of the validity of log law was in the zone of
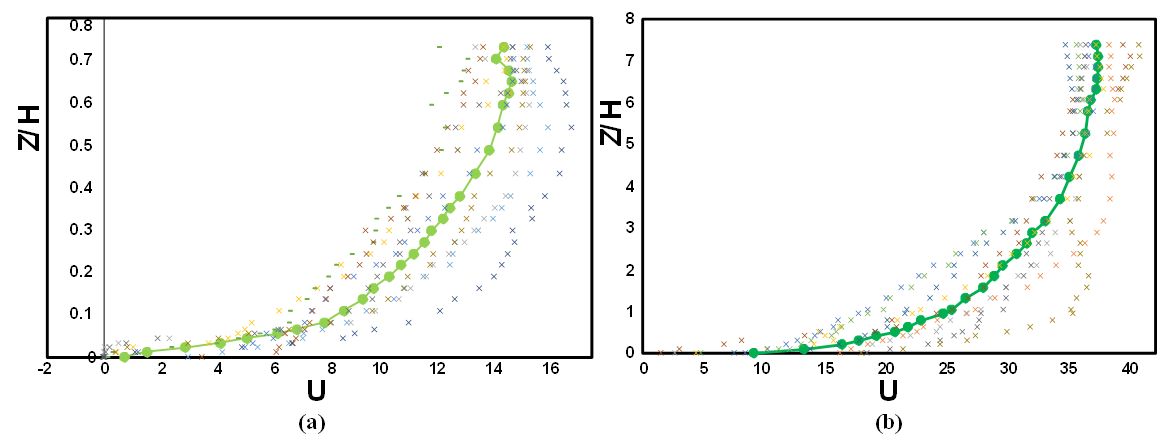
  The trend of the diagrams in the outer layer of the flow showed that the deviation of the log law was upward in the decelerating section and in the middle part of the pool, while the deviation was downward in the accelerating section of the flow. These results are consistent with the research of Afzalimehr and Anctil [37]. It was also observed that with increasing Reynolds number, the data deviation from the logarithmic law in the outer layer increased due to the more turbulent and complex flow at high velocities. The results of logarithmic law presented in figure 7 show that the roughness coefficient decreased with increasing Reynolds number in the flow. Moreover, in different positions of the pool-bed, the roughness coefficient in the accelerating section was greater than in the decelerating section. In addition, by comparing the roughness coefficients (f) in the presence of vegetation with sandy bed, it was observed that the roughness coefficient increased in the presence of vegetation, which indicates the significant flow resistance in the presence of vegetation on pool-bed shape. In order to evaluate the results, the double mean velocity profiles along with time mean velocity profiles were drawn. According to Figure 4, no balanced flow was observed in any of the experiments, because the temporal profiles of velocity did not match each other. Franca et al. stated that the profile of the double mean velocity in a river interval with coarse bed particles in the direction of flow at a distance of
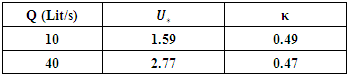
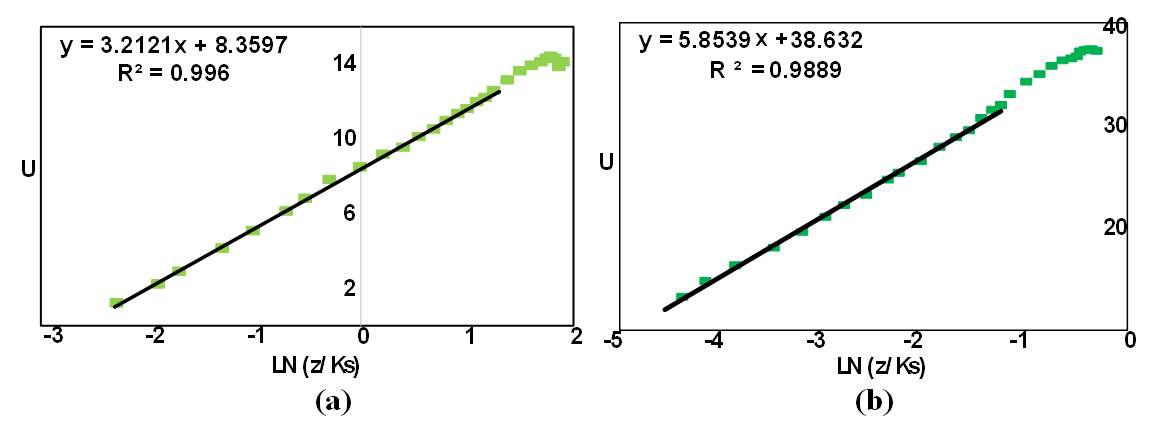
 deviated from the logarithmic function and changed linearly [45]. In the areas near the bed, the velocity profile had indeterminate irregularities. The researchers showed that dual averaging somewhat reduced these random irregularities. In the present study, such irregularities were not observed, because the presence of vegetation reduced irregularities. The solid line in Figure 7 shows the double mean velocity in the presence of vegetation with two different discharges of flow. As it turned out, the double averaging method worked well in the inner region and corrected random irregularities, although due to the effect of the unfavourable pressure gradient in the outer region of the boundary layer, there was not a significant difference between the temporal velocity profiles and the mean velocity profile. According to Figure 7, the velocity profile can be divided into two areas; near the bed, where the velocity profile follows the logarithmic function, and the outer area which deviates from this rule. Figure 9 shows the fitted logarithmic law to the dual average velocity. As can be seen in figure 8, the correlation coefficients of fitted values are greater than 98%, which indicate the wall law fitted well the inner region of the velocity profile with a relative depth of 20 cm. Also, the value of calculated k from the log law over the double average profile is presented in table 2.
|
 | Figure 9. Diagram of the log law in flow (a)  Lit/Sec, (b) Lit/Sec, (b)  Lit/Sec Lit/Sec |
4. Conclusions
- The results of this study with
 showed that the maximum velocities through the central axis of the channel occurred in the range
 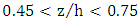 for decelerating flow and in the range
  for accelerating flow. From this observation, it can be concluded that the location of maximum velocity in the decelerating flow was lower than the accelerating current. This observation is consistent with the results of previous research conducted in [27,46]. The calculation of shear velocities in the accelerating section provided larger values than in the decelerating section, which can be justified by the higher velocities close to the bed in the accelerating flow section. By examining the effect of the presence of vegetation over the bed-form in the central axis of the flume, it was concluded that the presence of vegetation absorbed the momentum of flow and reduced the velocity in the flume. It also changed the distribution of Reynolds shear stress profiles and intermittent increasing and decreasing representations occurred in the various parts of the bed form. In addition, the amount of Reynolds shear stress in the presence of vegetation was less than in the sandy bed-form, and positive Reynolds stress indicated the occurrence of sweeping and ejection. The presence of vegetation caused the maximum Reynolds stress to occur at the end of the upstream slope to the middle of the bed. The interaction of vegetation and the bed form in the inner area of the flow played an important role in the velocity distribution in the downstream of the entrance slope due to the high turbulence in this region. In the presence of vegetation in the accelerating flow part with the higher Reynolds stress, the outward event in the centre of channel played a dominant role. The nonlinear Reynolds stress distribution indicates non-uniform flow, and the presence of active secondary currents due to vegetation and channel dimensions. Roughness coefficients decrease with increasing flow rate. In addition, roughness coefficients in the accelerating section are larger than in the decelerating secton and in the middle section of the pool. Also, roughness coefficients increased in the presence of vegetation on the pool-bed. The calculated von Karman constant showed that the double averaging method for the grass-covered bed in a pool bed-form with an angle of 5 degree could be well used for estimating the key parameters of river engineering for low-slope beds. This will considerably improve the estimation of shear velocity, roughness coefficient, and sediment transport parameters, and will decrease the cost of projects.