Negar Soltani1, Hossein Afzalimehr2, Vijay P. Singh3
1Department of Water Engineering, Isfahan University of Technology, Isfahan, Iran
2Department of Civil Engineering, Iran University of Science and Technology, Tehran, Iran
3Department of Biological & Agricultural Engineering & Zachry Department of Civil and Environmental Engineering, Texas A&M Univ., College Station, Texas, USA
Correspondence to: Hossein Afzalimehr, Department of Civil Engineering, Iran University of Science and Technology, Tehran, Iran.
| Email: |  |
Copyright © 2020 The Author(s). Published by Scientific & Academic Publishing.
This work is licensed under the Creative Commons Attribution International License (CC BY).
http://creativecommons.org/licenses/by/4.0/

Abstract
Diverse bedforms are observed in river beds. Pools and riffles occur in the bed due to the nonuniformity of flow, cross-section and the straight path of rivers and natural channels. From a hydraulic point of view, the variation in roughness is due to variations of flow depth and flow cross-section in pools and riffles, leading to energy losses and local erosion. Vegetated banks have a significant effect on the sustainability of banks and flow resistance, increasing the roughness coefficient in banks and floodplain. Due to the adjustment of environmental conditions and energy loss caused by vegetated banks and bedforms, their interaction plays a significant role in river restoration projects. Consequently, it is necessary to investigate the interactions of bedforms, flow, and vegetation on the stability and fluvial processes. The present study was conducted in Plusjan River in the central Iran to investigate the influence of vegetated banks, and accelerating and decelerating flows (non-uniform flows) on turbulent flow characteristics in the gravel-bed river. Results show that interactions between vegetated banks, flow nonuniformity, and bedforms lead to irregular patterns of velocity, Reynolds stress, and turbulence intensity distributions.
Keywords:
Nonuniform flow, Vegetated banks, Turbulent flow characteristics, Bedforms, Reynold stress
Cite this paper: Negar Soltani, Hossein Afzalimehr, Vijay P. Singh, Influence of Vegetated Banks on Turbulent Characteristics of Non-uniform Flow in Gravel Bed River, International Journal of Hydraulic Engineering, Vol. 9 No. 1, 2020, pp. 15-23. doi: 10.5923/j.ijhe.20200901.03.
1. Introduction
In natural rivers flow is non-uniform, which leads to diverse bedforms in gravel-bed rivers [1]. Due to the nonuniformity of flow, accelerating and decelerating flows occur in the pool and riffle sections of the river. Generally, the formation of bedforms arises from the separation [2], and the interaction between the flow and the bed. Vegetation is the other parameter that exists in the river floodplain and riverbed and has a crucial role in rivers for improving the dynamic characteristics and biological standards of the river systems [3-5]. Bank vegetation plays a significant role in the stability and flow resistance and increases the coefficient of the roughness of river banks and their floodplains [6].In a study, MacVicar and Rennie [6] investigated the decelerating flow that occurred on the entry slope of the pool, and the accelerating flow on the exit slope. Some studies have also been done on velocity profiles and turbulent flow characteristics in vegetated channels [7-10]. Earlier studies mostly focused on the interaction between turbulent flow characteristics in various gravel bedforms in the presence or absence of bed or bank vegetation in the laboratory. There are a few field studies on the influence of vegetated banks, and accelerating and decelerating flows on turbulent flow characteristics in gravel-bed rivers.The objective of this study is to investigate the influence of flow nonuniformity on turbulent characteristics in a gravel-bed river where the dominant bedforms are pools and riffles.
2. Experimental Setup
Experiments were carried out in May 2016 in the Plusjan River located in Chadegan city in Isfahan central Iran. Plusjan River is one of the sources of Zayandeh rood River that is located 185 km from west of Isfahan. The water that flows from the fountains of Fereydounshahr city connected to the Zayandeh rood River through the Plusjan River.The site selected to collect data on vegetated banks, accelerating, and decelerating flows is shown in Figure 1. To identify the dominant pool and riffle bedforms and vegetated banks of the river and to find the bed free of pool and riffle sequence, the authors walked more than 20 kilometers along the river. The site was located in the part of the river where to work was easy and safe. 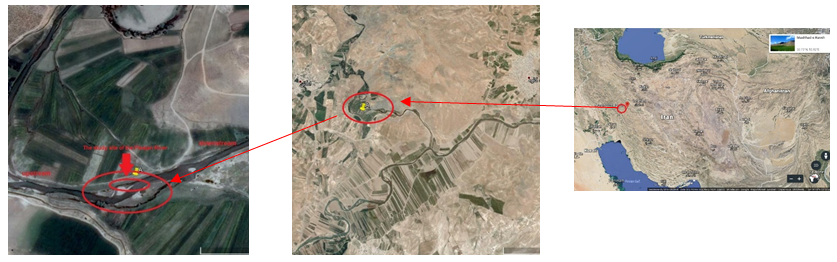 | Figure 1. Geographic map of the river and selected site for reaches |
As shown in figure 2, the selected reach of the river was located between 2082.4 and 2084.2 m elevations, and the latitude and longitude of each point are shown. To study the topography of riverbed and bed slope, the Leica total station camera (TC 1700) with an accuracy of 1.7 seconds was used for mapping the length of 100-meter reach of the river. In order to lessen errors caused by the equipment, two points were chosen to check whether the camera was set up correctly or not: one point was located at upstream of the river before the starting point for mapping and the other point was located at downstream which was after the last point. Before starting the survey, the coordinates of these 2 points were surveyed. If the difference was only 1 millimeter or less, the survey started. According to Afzalimehr, Maddahi [11], the survey grid 2 m × 1 m gives reasonable information on bedforms and the variation of the river bed. Vector data were done on the rectangular grid with dimensions of 2 m × 1 m (figure 3), where the first number is the grid length along the flow direction, and the second one is the grid width crossing the river perpendicular to the flow direction. To achieve the mesh size, ropes with the sign each one meter was used. Figure 2 shows the river bed topography by the contour map and the 3D surface.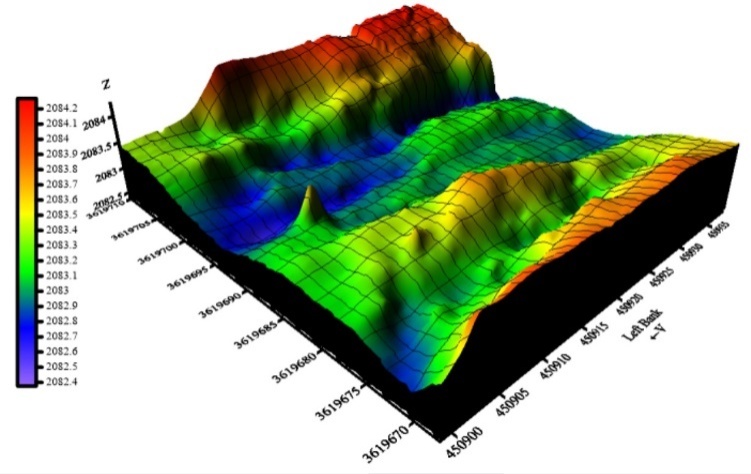 | Figure 2. River bed topography by 3D surface |
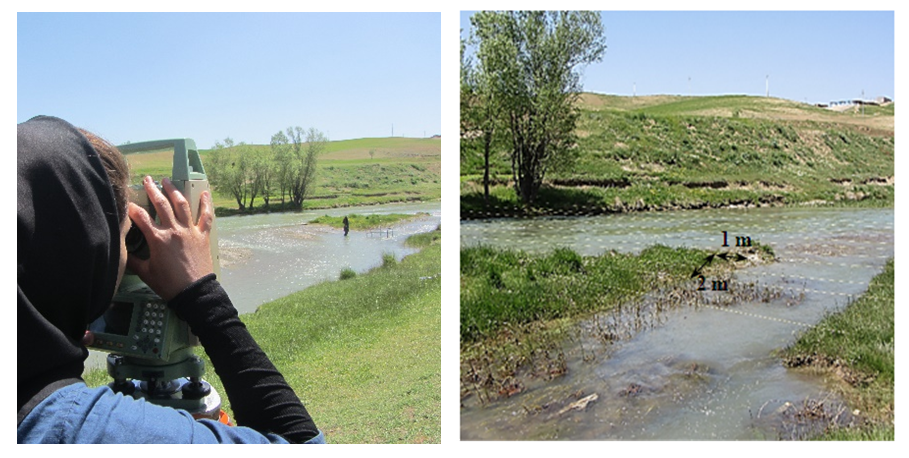 | Figure 3. Survey grid 2 m × 1 m |
To estimate the flow discharge of the river in one cross-section, the mean point velocities were determined at a relative flow depth of 0.2 and 0.8 for every 1 meter in width by butterfly current meter and counted with the calibration of its coefficient. To ensure the accuracy of parameters measured by the butterfly current meter, three repetitions each one in 60 seconds were done at each point, and the average of that was selected as the velocity data. The measurement was done at 24 different points in cross-sections. Figure 4 shows the river bed on the selected section where the flow discharge was measured. By using equation 1 the discharge of each section was calculated, then the total flow of the river was obtained by the summation as follows: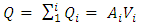 | (1) |
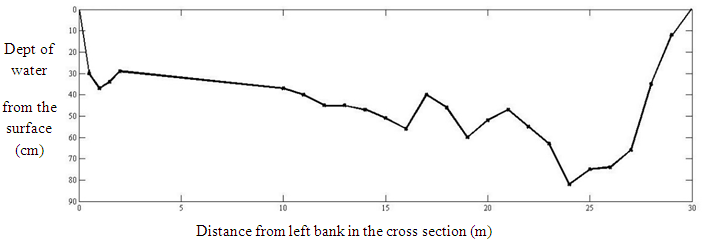 | Figure 4. River bed on the desired section for discharge measurement |
The river was divided into two branches due to the existence of a large bar in the central part. Total flow discharge was 9.74 m3/s, but near the left bank where vegetation existed, it was 0.36 m3/s. To ensure the accuracy of this discharge measured on 14 May 2016, the estimation of the regional water organization of Isfahan province was considered for the Plusjan River which showed the value of discharge of 9.615 m3/s, almost the same as the measured one.As has been mentioned, this study was done near the vegetated banks. The submerged vegetation density criterion was based on the diameters of stems or branches and their number per unit area diameter or width, d, and the average spacing between elements denoted as ΔS. The frontal area per canopy volume was computed as a = d/ΔS2. In the terrestrial canopy literature, this is called the leaf area index [12]. A non-dimensional measure of the canopy density was defined as the frontal area per bed area, λf, known as the roughness density [13]. For canopy height h, and z = 0 at the bed, 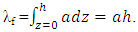 Following Nepf [14] for submerged canopy, there are three limits of behavior, sparse canopy (ah<0.1), transitional canopy (ah~ 0.1), and dense canopy (ah>0.1). During experiments, the distance between plants was measured and the stem diameter, leaf diameter, and cover length were also measured. From calculations and measurements, ah>0.1 was obtained, which indicated the type of dense canopy (Figure 5).
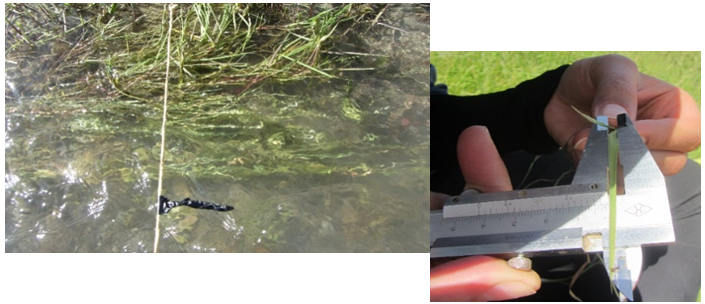 | Figure 5. Dense canopy |
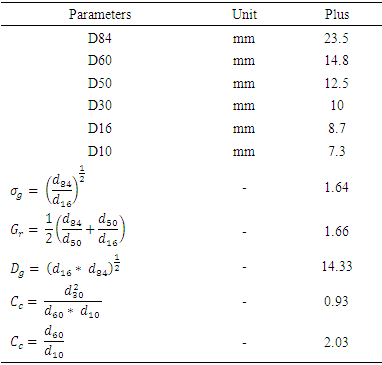
To correctly determine the distribution of bed sand and obtain sand sizes on the floor of the river bed, the Wolman [15] method was used to determine the distribution of different diameters. Figure 6 shows the grain size and table 1 shows parameters of grading.Table 1
 |
| |
|
 | Figure 6. Grain plot of the Plusjan bed River boundaries in the study area |
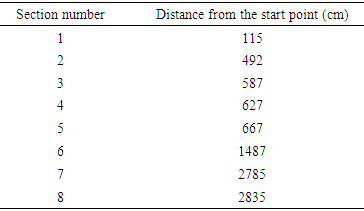
After selecting the river reaches an appropriate site was considered for collecting data in 8 cross-sections. 16 velocity profiles were measured along 30 meters in the longitudinal direction adjacent to the bank vegetation where the pool and riffle riverbed at irregular intervals, existed. Half of the profiles at the distance of 5 cm and half of them were located at 15cm to the bank vegetation. Three witness profiles were picked up at the upstream in a smooth section to compare the results. Table 2 shows sections where the velocities were measured at 5 and 15 cm away from the bank.Table 2
 |
| |
|
As it is shown in figure 7, the Acoustic Doppler Velocimeter (ADV) with a sampling rate of 200 Hz and a sampling duration of 120 s or 300 s in some points was used to measure the velocity profiles; our experience showed that 120 s was enough to collect turbulent flow characteristics. During data sampling, the flow was assumed steady and non-uniform. ADV data were filtered and 90 percent of data were used to calculate the turbulence parameters. For each velocity profile, depending on the water depth, 10 to 25-point velocities were measured. For the relative depth y/H<0.2 (where y is the vertical distance from the bed and H is the water depth) the distance between two points in the vertical direction was 0.2 cm and near the water surface (0.2<y/H<0.9) this distance was 0.5 to 1 cm.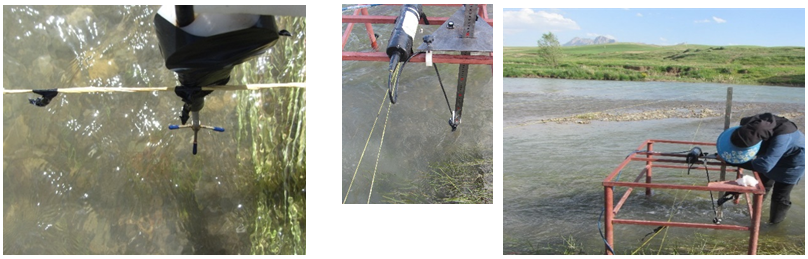 | Figure 7. ADV data velocity capture |
3. Result and Discussion
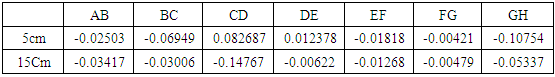
Considering figure 8, experiments were conducted in 8 cross-sections at the distance 5 and 15 cm from vegetated banks to study the turbulent flow characteristics. Table 3 presents the longitudinal slopes along the selected reach. The flow was turbulent and subcritical. Since no scaling was needed for such field experiments and the aspect ratio was > 5, the flow was considered two-dimensional [17].Table 3. Longitudinal slope between points
 |
| |
|
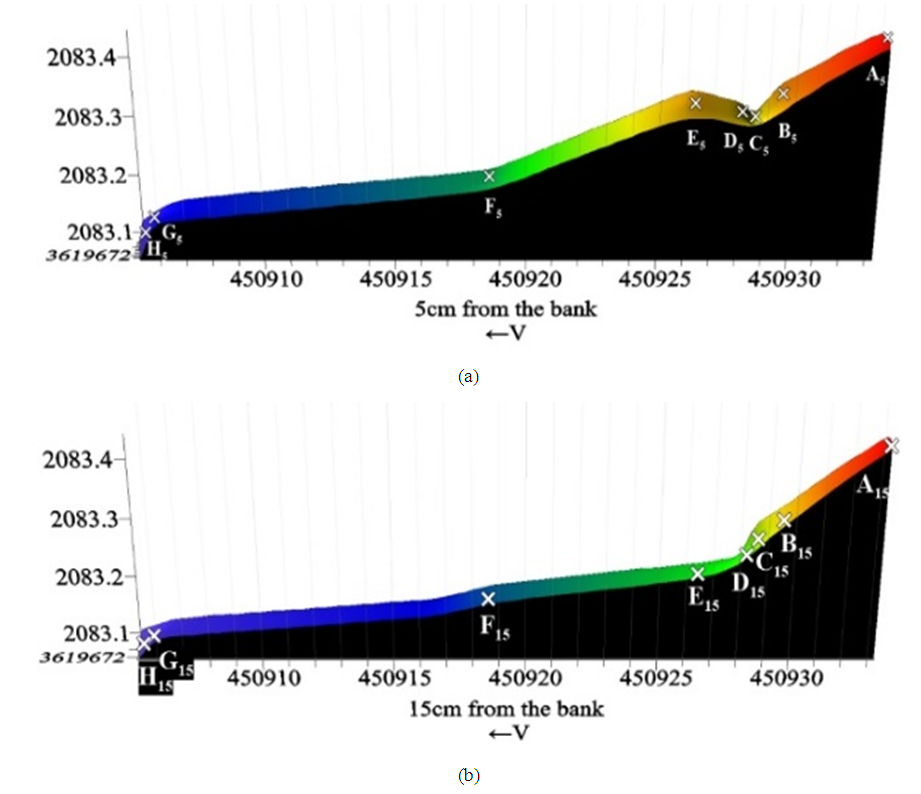 | Figure 8. Experiment point in accelerating and decelerating flow in a) 5 cm and b) 15 cm from the vegetated ban |
Longitudinal velocity profileFigure 9 shows the longitudinal velocity profiles for 8 cross-section distance at 5 and 15 cm from the vegetated banks. In these profiles, the velocity in the longitudinal direction was presented dimensionless by using the maximum velocity in each profile. Also, the flow depth became dimensionless as (Z/H), which (Z) was the point depth from the bed, and (H) was the flow depth of water in that profile. In some situations the velocity distribution was S-shaped and the maximum velocity occurred in the middle of the profile (dip); and in some cases it was convex where the maximum velocity occurred under the water surface. In wide channels (w/h > 5) the flow is two-dimensional and the effect of the bank is less and the effect of secondary flow is limited to the central axis of the channel compared to near the bank [18]. In this study, three velocity profiles were taken in the center of the river so the effect of vegetated banks was ignored. All three control profiles were converted to a reference profile by double averaging and used in comparison with other profiles which is called center in the charts. In the central part, the velocity profile was convex and the maximum velocity occurred near the water surface. Although distances from the banks influenced the velocity profile, acceleration, and deceleration of the flow played a more significant role in the location of the maximum velocity in each profile [19]. As shown in figure 8(a) and table 3, at 5 cm from the bank at points A, D, and E the accelerating flow existed. At point E5 the flow velocity indicated a wavy profile where the maximum velocity occurred at Z/H = 0.2 for accelerating flow [7]. At points G and H, the depth of water was maximum, showing a decelerating flow where the peak velocity was located near the water surface.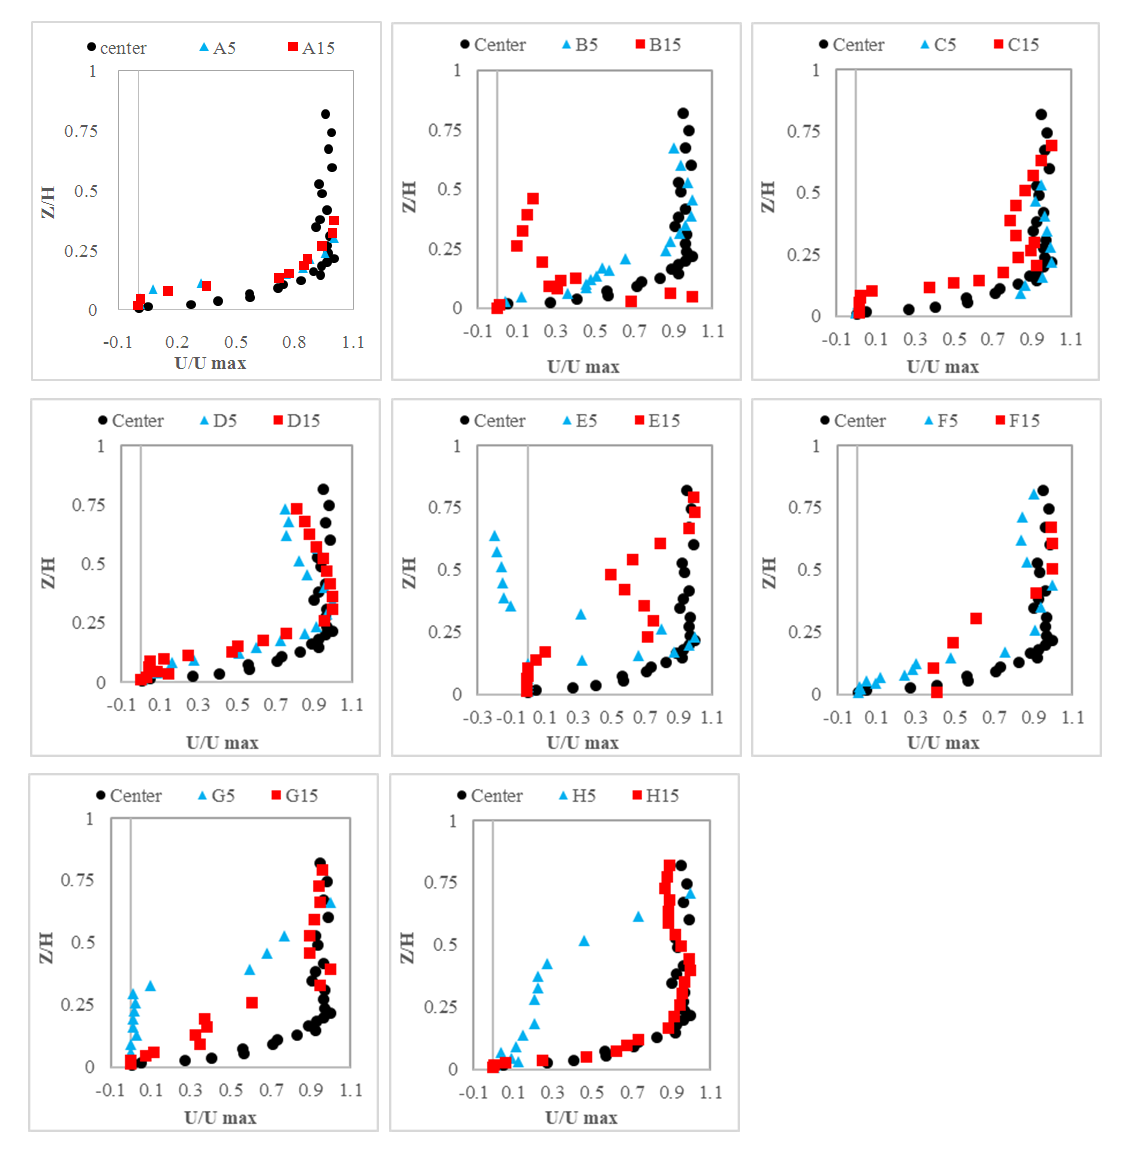 | Figure 9. Longitudinal slope between points |
Reynolds stress profilesFigure 10 shows the Reynolds stress profiles for 8 cross-section distance at 5 and 15 cm from the vegetated banks. Each Reynolds stress profile was presented dimensionless by drawing Z / H versus -U'W' /U*2. On a wide channel, the effect of the vegetated bank decreased towards the center of the river. In the centerline of the channel, Reynold stress showed a convex shape, but near the bank, a wavy distribution was observed. At 5 cm away from the bank, the effect of the vegetated bank was more and in accelerating flow than decelerating one, the maximum Reynolds stress was located near the bed. Figure 10 shows that in both accelerating and decelerating flows the positive shear stress occurred near the bed and the negative values occurred near the water surface.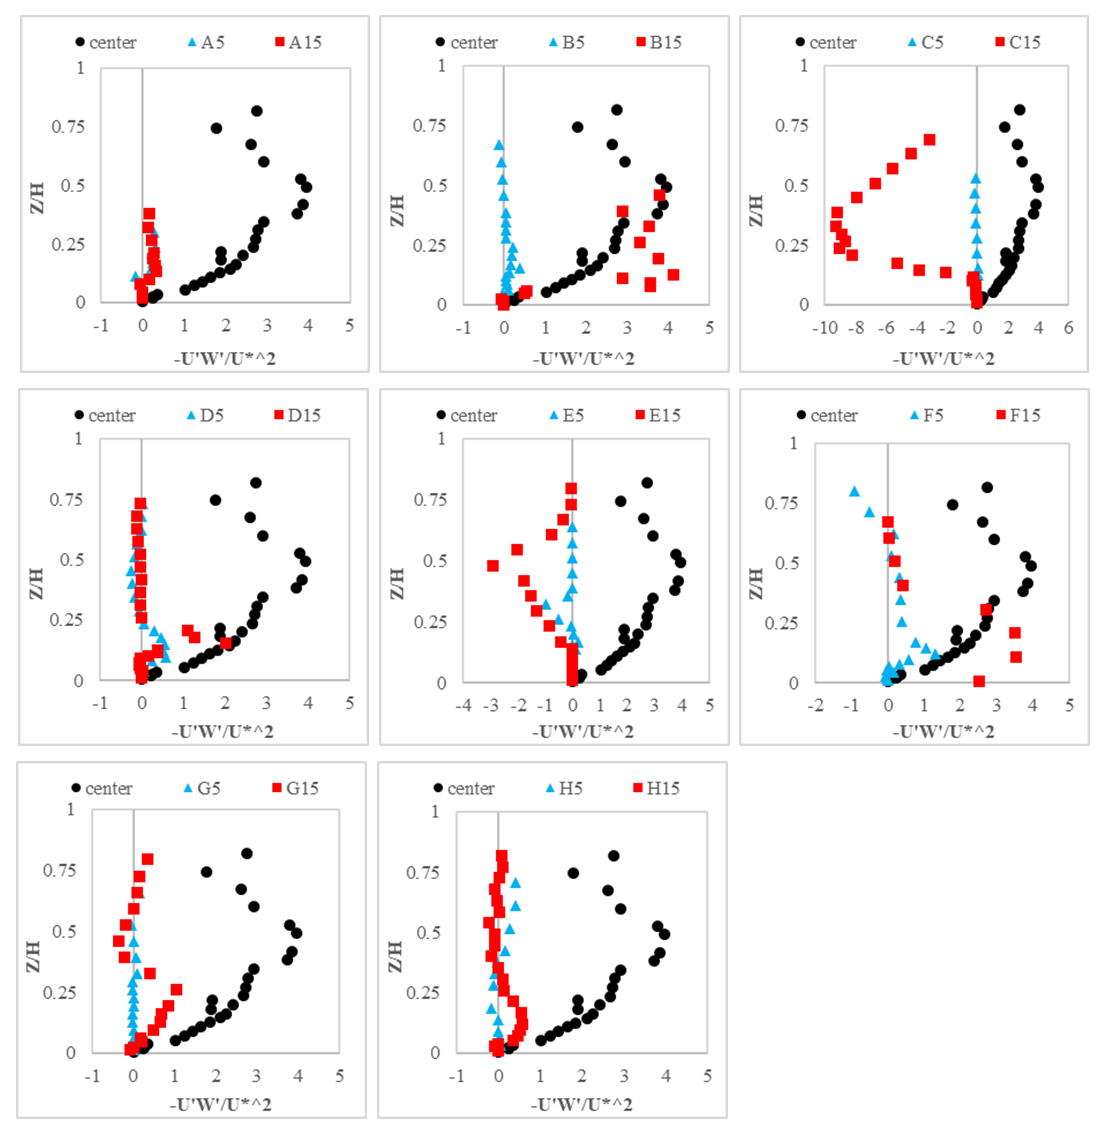 | Figure 10. Reynolds stress profiles |
Turbulence intensity profileFigure 11 shows the turbulence intensity profiles for 8 cross-section distance at 5 and 15 cm from the vegetated banks. The turbulence intensity was presented as dimensionless by drawing Z / H versus -U' / U*. The results of this study showed that for a central profile and both accelerating and decelerating flows turbulence intensity in longitudinal direction had a convex shape. At 15 cm away from the vegetated bank, as the effect of the bank was lesser than 5 cm, in decelerating flow, the maximum turbulence intensity occurred at Z/H = 0.3 to 0.4, but near the bank at 5 cm away from the bank, the maximum turbulence intensity occurred near the bed for Z/H< .025.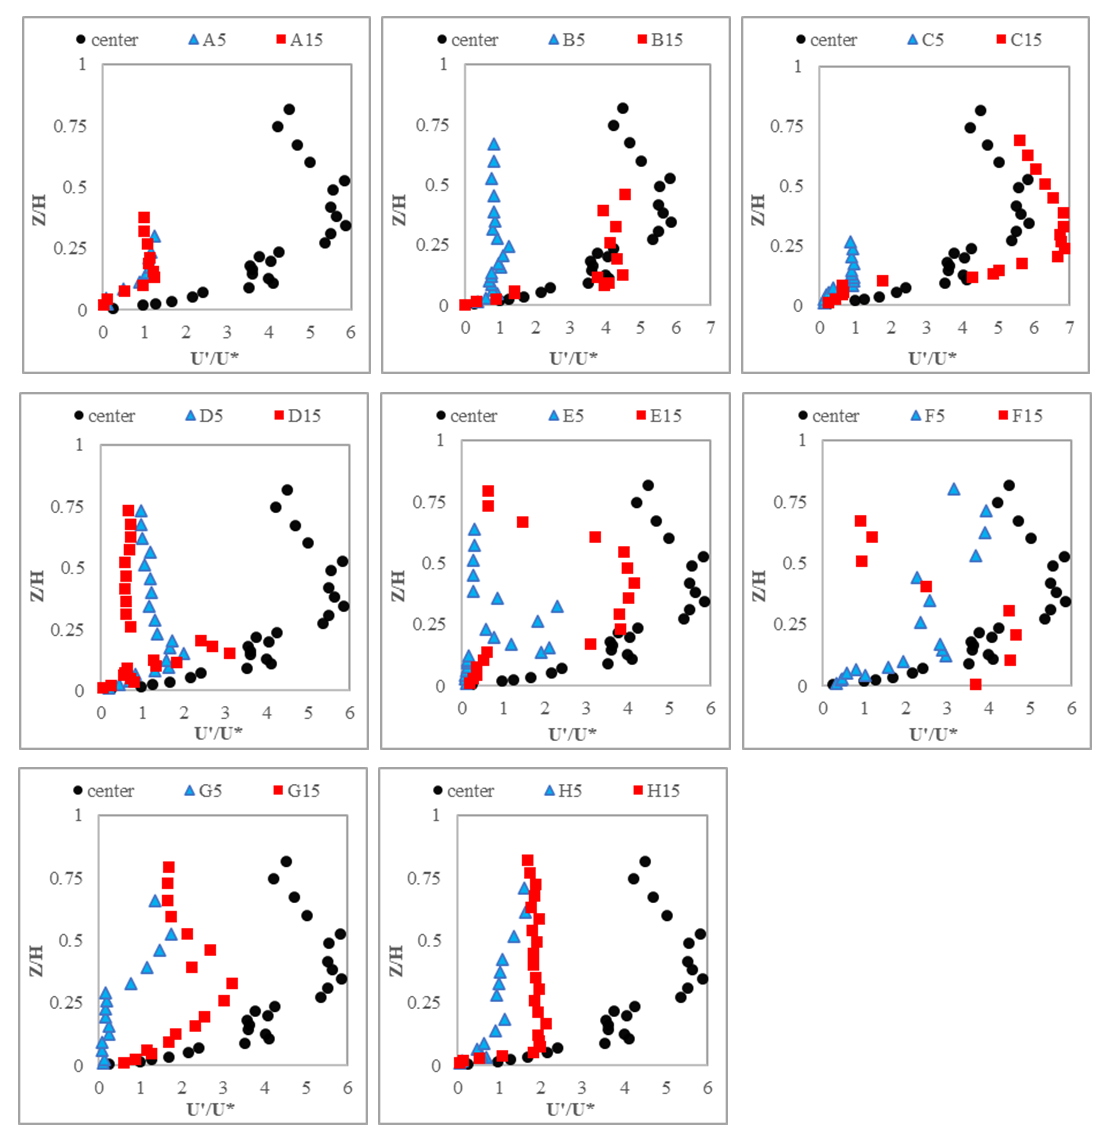 | Figure 11. Shear stress profile |
4. Conclusions
The objective of this field experimentation was to investigate the turbulent flow characteristics near the bank vegetation in different sections along a gravel-bed river where the pools and riffles were dominant bedforms. The results of this study showed the following results:1. The interactions of non-uniform flow, bedforms, and vegetation affected considerably the velocity distribution, indicating a clear dip near the banks. No clear pattern was observed for velocity profiles where vegetation was prevalent. However, the velocity distribution in the central part of the river where the effect of vegetation was weak followed the classic form reported in the literature. There is no hydraulic explanation for the negative values of velocity, however, these may be related to the interaction vegetation with the nonouniform flow.2. In central profiles and for both accelerating and decelerating flows, Reynolds stress (RS) and turbulence intensity (TI) follow a convex form in the main direction of the flow. The maximum values of RS and TI near the vegetated banks occurred under the water surface at Z/H = 0.5 or lower with an irregular distribution and without negative values.3. More data need to investigate the interaction of flow, vegetation, and bedforms on the turbulent flow characteristics.
References
| [1] | Afzalimehr, H., et al., Impacts of vegetation over bedforms on flow characteristics in gravel-bed rivers. Journal of Hydrodynamics, 2019. 31(5): p. 986-998. |
| [2] | Ferraro, D. and S. Dey, Principles of mechanics of bedforms, in Rivers–Physical, Fluvial and Environmental Processes. 2015, Springer. p. 79-98. |
| [3] | Brachet, C., The Handbook for Management and Restoration of Aquatic Ecosystems in river and lake basins. 2015. |
| [4] | Lera, S., et al., The impact of submersed aquatic vegetation on the development of river mouth bars. Earth Surface Processes and Landforms, 2019. 44(7): p. 1494-1506. |
| [5] | Najafabadi, E.F., H. Afzalimehr, and P.M. Rowiński, Flow structure through a fluvial pool-riffle sequence–Case study. Journal of Hydro-environment Research, 2018. 19: p. 1-15. |
| [6] | MacVicar, B.J. and C.D. Rennie, Flow and turbulence redistribution in a straight artificial pool. Water resources research, 2012. 48(2). |
| [7] | Afzalimehr, H., E.F. Najafabadi, and J. Gallichand, Effects of accelerating and decelerating flows in a channel with vegetated banks and gravel bed. International Journal of Sediment Research, 2012. 27(2): p. 188-200. |
| [8] | Dehsorkhi, E.N., H. Afzalimehr, and S. Jueyi, Effects of vegetation channel banks and gravel size on flow structure. International Journal of Sediment Research, 2010. 25(2): p. 110-118. |
| [9] | Nepf, H., J. Rominger, and L. Zong, Coherent flow structures in vegetated channels. Coherent Flow Structures at Earth's Surface, 2013: p. 135-147. |
| [10] | Vanoni, V., Sedimentation Engineering (2nd print). ASCE, New York, 1977. |
| [11] | Afzalimehr, H., M.R. Maddahi, and J. Sui, Bedform characteristics in a gravel-bed river. Journal of Hydrology and Hydromechanics, 2017. 65(4): p. 366-377. |
| [12] | Kaimal, J.C. and J.J. Finnigan, Atmospheric boundary layer flows: their structure and measurement. 1994: Oxford university press. |
| [13] | Wooding, R., E.F. Bradley, and J. Marshall, Drag due to regular arrays of roughness elements of varying geometry. Boundary-Layer Meteorology, 1973. 5(3): p. 285-308. |
| [14] | Nepf, H.M., Flow and transport in regions with aquatic vegetation. Annual review of fluid mechanics, 2012. 44: p. 123-142. |
| [15] | Wolman, M.G., A method of sampling coarse river‐bed material. EOS, Transactions American Geophysical Union, 1954. 35(6): p. 951-956. |
| [16] | Goring, D.G. and V.I. Nikora, Despiking acoustic Doppler velocimeter data. Journal of hydraulic engineering, 2002. 128(1): p. 117-126. |
| [17] | Afzalimehr, H. and D. Subhasish, Influence of bank vegetation and gravel bed on velocity and Reynolds stress distributions. International Journal of Sediment Research, 2009. 24(2): p. 236-246. |
| [18] | Kironoto, B., W.H. Graf, and REYNOLDS, Turbulence characteristics in rough non-uniform open-channel flow. Proceedings of the institution of civil engineers-water maritime and energy, 1995. 112(4): p. 336-348. |
| [19] | Graf, W.H. and M.S. Altinakar, Fluvial hydraulics: Flow and transport processes in channels of simple geometry. 1998. |

 Abstract
 Reference
 Full-Text PDF
 Full-text HTML