-
Paper Information
- Paper Submission
-
Journal Information
- About This Journal
- Editorial Board
- Current Issue
- Archive
- Author Guidelines
- Contact Us
International Journal of Hydraulic Engineering
p-ISSN: 2169-9771 e-ISSN: 2169-9801
2020; 9(1): 1-8
doi:10.5923/j.ijhe.20200901.01
Received: Jun. 9, 2020; Accepted: Jul. 30, 2020; Published: Sep. 26, 2020

Effects of Limited Access for Potable and Adequate Water Supply on Sustainable Development in the Lowland Area of Bale Zone, the Case of Lagahidha Woreda
 Abstract
 Reference
 Full-Text PDF
 Full-text HTML
Siraj Abduro, Dereje Tolosa, Tasfahun Addisu
Lecturer at Department of Water Resources and Irrigation Engineering, Engineering College, Madda Walabu University, Bale Robe, Ethiopia
Correspondence to: Siraj Abduro, Lecturer at Department of Water Resources and Irrigation Engineering, Engineering College, Madda Walabu University, Bale Robe, Ethiopia.
| Email: |  |
Copyright © 2020 The Author(s). Published by Scientific & Academic Publishing.
This work is licensed under the Creative Commons Attribution International License (CC BY).
http://creativecommons.org/licenses/by/4.0/

The aims of this research is to assess the problems associated with limited access for water in study area. Evaluation and interpretation of structured questionnaire and checklist for water supply office professionals and experts was conducted. The study took a sample of 132 households to conduct the survey from randomly selected 7 kebeles. In sampled household no one can get water in the radius of 0.5km. The high percent (46.97%) can go long distance (2000-3000m) to fetch water, whereas only (3.78%) get water within the radius of 500-1000m and (9.85%) bring water from a distance greater than 3000m. The survey result revealed that 38.63% receiving water from open wells, 33.34% from hand dug wells, 7.57% use deep well and 14.37% and 6.07% using ponds and stream respectively. The average of time consumed for waiting was 20-30minutes per day. There were huge variation between water supply-demand, thus the minimum and maximum of house hold consumption was 25 to 125 lit/day respectively. Whereas minimum and maximum demand of household was 50 to 160 lit/day respectively. In woreda female were responsible for collecting water (38.6%), both children and female (61.4%) which indicate there was over burden on female and child for water fetching. Partners need to give due consideration for provision of safe drinking water in line with the current population growth. The process of supplying sufficient water for the community needs to develop the integrated and multi-village water supply project system that can supply water from adjacent highland to lowland kebeles within the same line.
Keywords: Water supply, Water demand, Consumption, Effects, Limited access, Lagahidha Woreda
Cite this paper: Siraj Abduro, Dereje Tolosa, Tasfahun Addisu, Effects of Limited Access for Potable and Adequate Water Supply on Sustainable Development in the Lowland Area of Bale Zone, the Case of Lagahidha Woreda, International Journal of Hydraulic Engineering, Vol. 9 No. 1, 2020, pp. 1-8. doi: 10.5923/j.ijhe.20200901.01.
Article Outline
1. Introduction
- Access to water resource is an uninhibited right of the community. With this in mind, the United Nations Millennium Development Goals (MDG) aims to reduce the proportion of people without sustainable access to safe drinking water and basic sanitation by 50% by year 2015 [17]. The Joint Monitoring Programme (JMP) is the official United Nations body responsible for monitoring progress towards Millennium Development Goal 7, target 7c. This target aims to “halve, by 2015, the proportion of people without sustainable access to safe drinking-water and basic sanitation” [6]. Access to safe drinking water is the proportion of people using improved drinking water sources such as household connection, public standpipe, bore hole, protected dug well, protected spring and rainwater [17]. Poor or absence of safe water may lead to many unfavourable consequences, such As more time and energy consumption for collecting and carrying water and insufficient water to maintain good hygiene practices [4]. Consequently, water and sanitation related diseases are widespread [15].The health of the community entirely depends on the availability of adequate and safe water. Hence, water is primarily essential for life, health and for human dignity. However, the access coverage of safe water provision and utilization in the country is not yet ensured to address the increasing water demands from a growing population, economic expansion and increasing mean water required per capital [9].With the increase in population size and rapid growth of modernization, especially in developing countries, the demand for water is increasing from time to time. It is becoming a big challenge to cope up this increase in demand because of several limitations. Potable and enough quantity of water is very essential for all living things. There are different types of demands such as domestic, commercial, institutional and industrial demands. The issue of water is observed as a general problem for both urban & the rural population; and women’s are the one who bear the greatest burden because of their social gender roles including collecting water for households [15].Major sources of drinking water come from groundwater and surface water. The groundwater is believed to be comparatively cleaner and free from pollution compared to surface water [10]. But during last decade, it has been observed that groundwater gets polluted drastically because of increased human activities [8]. On the other hand, surface water is a source which has a wide chance of contamination from the surround area. Consequently, a number of cases of water borne diseases have been seen as the causes of health hazards. Therefore, monitoring the quality of water is one of the essential issues of drinking water [12]. The existing situation of water supply system in the country including lowland woreda, not meet the demand [8]. Currently water supply scheme (sources) of the low land areas is almost from natural pond, stream flow which depends on seasonal, protected/unprotected springs and shallow wells etc. so, the degree of insufficient is both on the quality and quantity of water that has becoming the adverse effect on sustainable development and public health.The current situation in study area due to lack of potable and enough water for domestic uses is very critical. As Laga-hidha woreda water office, 2016 report, in woreda there is no tap water rather hand pump that provided for some villages. Currently, there are only 65 hand pumps & 2 deep wells. According to woreda water office report [7], rural population of the district has no access to water. Almost large number of population depend upon traditional water source like unprotected wells, river/pond. As a result, the health and well-being of the population is at risk. By the year 2015 the national water supply and sanitation program under the MDG planned to increase the coverage of water supply and sanitation by 64% and 54% respectively [4]. It has been said that the chances of achieving the Millennium Development Goal of halving the proportion of people without access to safe water by 2015 seriously lowered unless levels of sustainability can be greatly improved [16]. Therefore, assessing the current status of drinking water supply sources and impacts of the limited access on socio-economic activities at lowland woreda is very crucial and urgent need. The general objective of this research was to assess the Challenges of limited access of water supply on socio-economic activities and sustainable development. Whereas the specific objectives were:§ To identify the types and nature of water supply sources§ To identify the gap between water supply and demand in the woreda § To assess challenges of limited access of water supply on socio-economic and development activities
2. Methodology and Materials
- Lagahidha district is one of the administrative territory of Bale zones, Oromia Regional state with an area of 5648 km2 (564,800ha) [3]. It has distance of 250 km from zonal capital Robe 680km from Addis Ababa. Lagahidha is bounded by West Hararge in the North, Sewena in the South, East Hararge in the Northeast, Ethio-Somali region in the east & Gololcha in the West. The astronomical location is 07° 23”00’– 07° 56”24’ N and 33° 56”00’– 46° 32” 30’ E respectively [3].
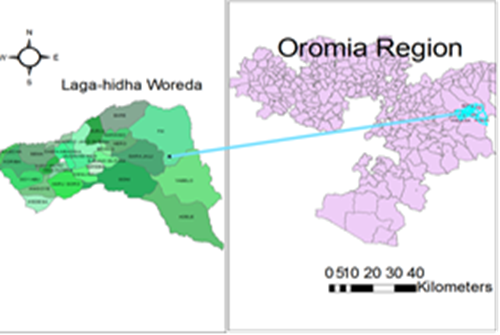 | Figure 1. Location map of study area |
2.1. Data Collection
- A combination of both quantitative and qualitative method was employed. Pre-tested structured questionnaires used to gather quantitative data after translated into local language ‘Afaan Oromo’. The questionnaire covered information on socioeconomic characteristics of the respondent, availability of the water supply sources, types of sources nearness or farness of the source, time consumed to fetch water, women burden, sustainability factors of the existing service, physical condition of the water supply points. Field observation using a structured checklist was done focusing on physical condition of the scheme, level of protection, construction quality and protection mechanisms. A discussion was conducted with woreda water supply staff to collect qualitative data using a semi-structured questionnaire guide and note taking.
2.2. Research Design and Sampling Procedures
- Different methods of data collection like structured questionnaires, interviews and personal observations was employed to produce primary data. Moreover, secondary data was collected from existing documents, books, journals, reports, and others sources from sectorial offices and concerned bureaus inside and outside the Woreda.
2.3. Sample Size Determination
- To determine sample size, a sampling technique (formula), which was developed by Cochran, [23] used to determine sample size (n).
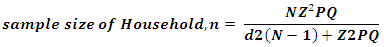 Where n= Sample size of households; P= Households variable (residential houses) Q= Non-residential houses = 1- P; N= Total number of HH; Z= Standardized normal variable & its value that corresponds to 95% confidence interval equals 1.96; d = Allowable error (0.05).As per the statistical data collected from the woreda, there are 17,408 households in woreda. Out of these, 96.2% are rural resident while only 3.8% are urban residents.
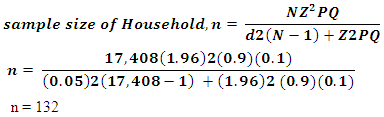 As beneficiaries are the main primary data sources in this study, nineteen households was selected from sample kebele resulting in a total of 132 households. For sampling, seven kebeles namely; Semma, Hidha-hunda, Doya-abu, Hara-Goro, Hero, Goni and Mumicha-Nadhi were selected purposely. Checklist prepared for discussion with woreda water supply staffs and officials, was also carried out.In order to facilitate the interpretation of the finding of the study, accordingly, statistical tools such as descriptive statistics for comparing similarities and differences was employed.
3. Result and Discussion
- This part includes detail description of results obtained from survey carried out to collect information about existing domestic drinking water supply along with the effects of limited access on socio-economic and sustainable development in rural area of Laga-hidha woreda. Questionnaires were distributed to randomly selected HHs and 100% responses were obtained. The information were analysed to determine the current water supply status and water demand of the household.From the total sampled population, 40.9% are females while 59.1% are males (Table 1). The high percent (31.81%) of respondents were in the ages of 36-46 years. Farming & pastoralism are the major source of income. Due to the suitability of woreda for practicing of different income source the community has one or two source. Thus, (28.79%) are farming, (6.82%) are pastoral and (64.39%) are getting their income from mixed of both farming & pastoral. In sample kebele there are no daily labours and other alternative income source.
|
3.1. Source Protection and Quality Satisfaction
- The problems associated from the availability of potable water supply. The challenges has different impacts on community development unless it gives attentions by every stakeholders and responsible bodies. In Laga-hidha woreda community gain water from different sources i.e. hand dug wells, springs (protected and unprotected), pipe line (which is very rare), Rivers/streams and from ponds (man-made or family pond) which are found nearby or far away from their home. The survey result revealed that 38.63% are receiving water from open wells, 33.34% from Hand dug wells, deep well 7.57% and 14.37% and 6.07% are from ponds and stream respectively.
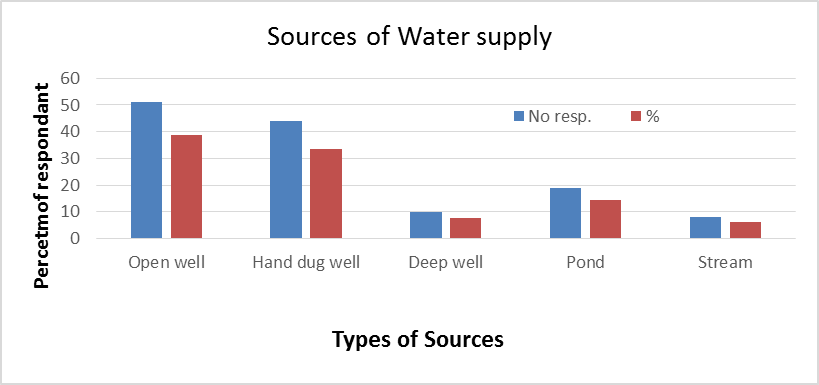 | Figure 2. Major sources of water supply |
|
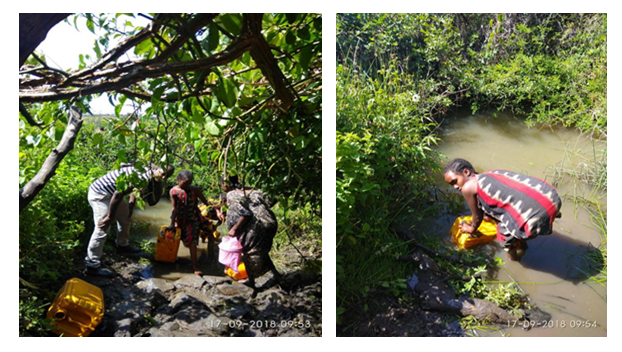 | Figure 3. Open well used as sources of water supply |
3.2. Household Water Consumption
- The distribution of the water consumption varied among different sampled households. As indicated by household survey more or less the variation was observed. On the one hand, according UAP, when the water consumption of the HH was converted to per capital consumption, the minimum value was 3.8 lit/person/day, which is very less while it compared with that of country level for rural community which is minimum of 15 lit/cap/day. In the study area there are many factors those affect water consumption such as; long distance of the sources from the settlement, availability of the sources depend on seasonal, quality of the sources, livestock watering and other challenges may affect and limit the daily water consumption., since Jerry can was the most common types of materials. It was issue that women carry heavy loads to collect water.
3.2.1. Determinants of Per Capita and Total Household Water Consumption
- The results of the comparison shows, when there is an increase in household size, there is probability of collecting more water for larger household. As a result, there is a positive relationship between household size and total water consumption. However, the per capital water consumption decreased with an increase in household size because there is a problem of access and adequacy when considering the supply necessary to meet the needs of a large family. Family size had a negatively to per capital water consumption. This implies that there was a negative relationship b/n household size & per capital consumption.
3.3. Daily Household Water Demand
- Water demand is defined as the volume of water quested by users to satisfy their needs. In a simplified way it is often considered equal to water consumption, although conceptually the two terms do not have the same meaning [21]. In most developing countries, the theoretical water demand considerably exceeds the actual consumptive water use (lit/cap/day) [22]. As the survey of household indicated, about 44 respondent need water more than 125 lit, 27 needs 80 lit whereas only 3 need 60 litres for the daily household domestic purpose. According to this study, there is a significant variation between daily water supply and demand which was caused due to inaccessibility of water supply in study area. These inaccessibility causes for many problems which has great effect on sustainable development.
3.4. Comparison Daily Consumption and Demand
- As it’s observed from the survey of HH, there is a gap between water consumption and demand. In the study area the household response 46.96% can get water only one Jerrycan (25 lit) whereas only 3.78% consume 5 and above Jerrycan (>=125 lit). In the same way, about 43.94% need water more than 5 Jerry can (>=125 lit). Therefore, to full fill this demand it required to improve the supplying system. This result was also below the threshold level of Ethiopian standard (20 litres per person per day [20].
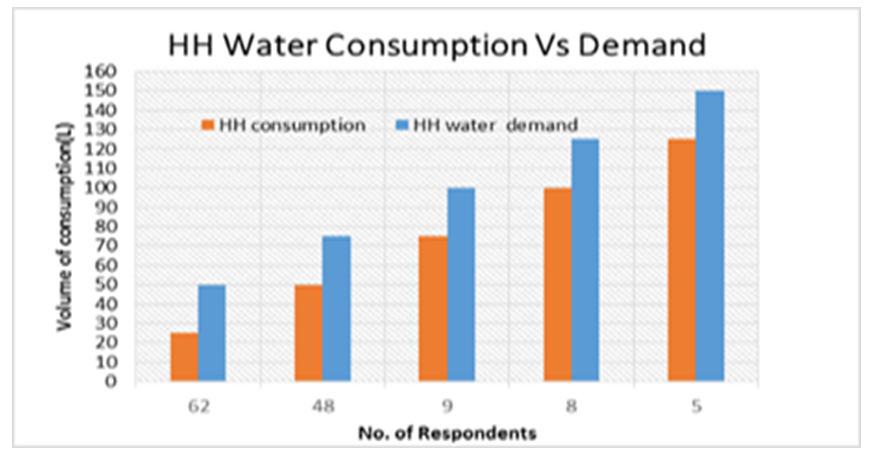 | Figure 4. Comparison of water consumption and demand |
3.5. Water Supply and Demand Gap
- In the study area there was no balanced system for supply-demand. Variation is the amount of water needed by HH minus the consumed by HHs. There are huge variation b/n supply-demand. In considering the minimum & maximum variation were from 25lit/HH to 50lit/HH respectively.
3.6. Major Challenges of Limited Access at Woreda
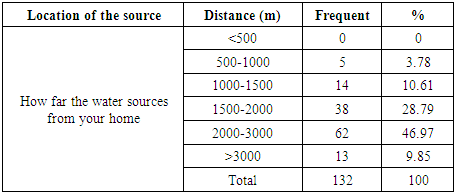
3.6.1. Long Distances of Water Sources
- The nearness or the distance of the source has great effect on day to day activities. In woreda most of the community get water from natural sources (i.e. there was no piped system at all). The available system at some kebeles was only water point. In sampled HH no one can get water from the radius of 500m. The high percent (46.97%) can go long distance (2000-3000m) to fetch water, whereas only (3.78%) get water within the radius of 500-1000m and (9.85%) bring the water from a distance greater than 3000m or 3 km.
|
3.6.2. Long time Consumed for Fetching Water
- According to Dublin (1992) principle women play a central part in the provision, management, and safeguarding of water. It is widely acknowledged that women play a key role in the collection and safeguarding of water for domestic use.Time savings, is important items to perform more duties in households. The situation effective in saving time spent in fetching water and most of the time saved was used for domestic activities including cooking and other unpaid work. The travel time spent on fetching water from 60 to 120 minutes (27.27%) per a trip. In addition to that, about 23.48% of sample respondents spent 2.5hrs to 3 hrs per trip per day.In addition to the time taken to go the distance there is a time consumed during waiting the order. According to this, the water collector waiting from 10 minutes to 1hr. The average of time consumed for waiting was 20-30 minutes.
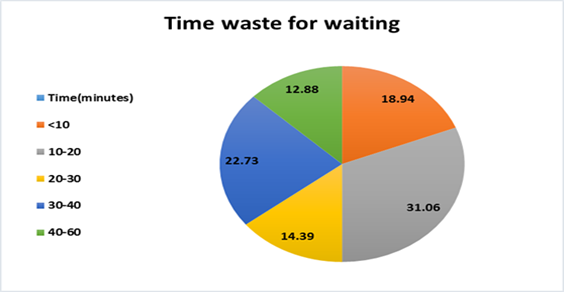 | Figure 5. Consumed time for waiting the order |
3.6.3. Extra Burden on Women
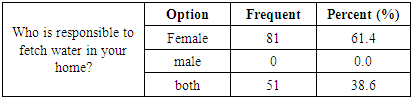
- Lack of access to safe and clean water is locked in the heart of the poverty. Even though the issue of water is observed as a general problem for both the urban and the rural population, women bear the greatest burden because of their social gender roles including collecting water for their households [15]. During the Household survey, respondents gave their answer 61.4% that the female were responsible for collecting water and no one respond male was responsible. However, both male and female (38.6%). this indicate that in addition to female children were take responsibility of water collection.
|
3.6.4. Inaccessibility of Sanitation
- Sanitation is essential to promote health and prevent diseases. It is described in terms of personal hygiene, toilet facilities and surrounding environment. Water supply conditions without sanitation and hygiene behaviour looks nothing (Water Aid, 2009). According to the report found from the expert in the study area, there is no visible sanitation that described as percentage or coverage. This need more focus. Besides that out of the total sample households had accessed only latrine facilities such as simple pit latrines. Plus to that, the condition of toilets was also not so hygienic due to scarcity of water and problem of awareness created among the existing households.
3.6.5. Reason for Conflict Emerge
- In woreda, due to limited accessibility of water supply, there are different challenges in different aspects. As observed during the discussion with woreda water office staffs, there were a time that water sources caused as sources of conflict. In woreda, mostly the communities used traditional open wells for domestic drinking and livestock watering purpose. Since there are influences of the sources’ ownership, as it’s found in kebele’s territory, the conflict emerged which its consequence was very bad unless it should be resolved immediately.
3.6.6. Challenges of Limited Access on Institutions
- Due to inaccessibility of water supply in woreda, there are many challenges those facing different institutions. Health centers, schools and governmental offices need water for efficient functions.i) Challenges at Health CentersAccording to Laga-hidha health office 2017 report, in woreda, there are many health institutions found at different level and serving the community. There are 5 health centers (HC) and 24 Health post (HP) in the district. Although, as it’s obviously known to give full and sustainable services the provision of enough water is important and critical issues, there are no access to water supply. Depending on the levels of health stations having enough clean water is needed for different ordinary activities such as washing utensils, sterilization of materials, in laboratory rooms and delivery rooms. However, due to absence of supplying water for those health centers, the problems are very critical. The questions raised in relation with these are; how these institution perform their regular works? Where do the workers get water for their life? The answer is difficult because at some place of the woreda like Doya-Abu and Adele kebeles especially during dry season the situation is worst. Therefore, in most areas of the woreda, at dry season not only performing the regular works even staying at the site is very challenging and the consequence of such situation has its own impacts on the provision of enough and sustainable service for the communities and this has a great effect on over all communities’ development.ii) Challenges at Education CentersAlmost every kebele of the woreda has education centers (schools). In woreda there are more than 42 primary schools (grade 1-8), 2 high schools (grade 9-10) & 1 preparatory school (grade 11-12). However, there is no facility of water supply at all and this has a negative impacts on educational situation. For instance, the students/teachers has facing problems for using water for toilet, they have no chance to practice plantation as well conserving their environmental. In addition to that, the sanitation system in the primary and secondary schools are very harmful. The toilet are only dry pit latrines those need cleaning periodically. Even class rooms and offices require washing/cleaning from time to time. Therefore, the effects of this limitation of water supply in this education centers has its own challenge in having and performing regular work effectively where the situation was not safe and nu-attractive environment. Thus, this has a consequence on the community sustainable developments.
3.7. Effects on Socio-Economic Aspect
- Lack of access to adequate water supply leads human life to multidimensional problems. It affects different aspects of human life including their social, economic, health, education and dignity. The spread of water related and water borne diseases is associated with poor water supply, sanitation and hygiene and women and children bear the greatest burden related with inadequate water supply [19]. Due to the absence of adequate and sufficient water supply, there are a various effects on social, economic and health developments of the community. Among these, absence of children from the schools, losing more time and energy of women for collecting water, absence of sanitation facility, cost of the water during supplying water by truck. On the other hand, during dry season in the woreda more than 13 kebeles faces critical problems, for the schools closed, DAs and teachers not available at working place due hardship condition. At that season, the government may survive the life by supplying water by truck as emergency situation. In this more than 7,117 HHs get the service. Huge budget is allocating for this emergency supply (i.e. 2 to 3 million birr/month spent). However, according to woreda expert opinion, rather than budgeting for emergency, it’s better if the government spent money for construction of water supply schemes for those kebeles.
4. Conclusions
- In sampled HH no one can get water from the radius of 500m distances. The high percent (46.97%) can go long distance (2000-3000m) to fetch water, whereas only (3.78%) get water within the radius of 500-1000m and (9.85%) bring the water from a distance greater than 3000m. In addition to that, the water collector waiting from 10 minutes to an hour accordingly. The average of time consumed for waiting was 20-30 minutes per day. On the other hand, that the average maximum distance covered from the sources of 14 to 21 kilometer, 7 to 14 Hrs per week and 3.5 hours for queuing time were spent. In the woreda there are more than 13 kebeles those getting water by truck every year during dry season as emergency situation. In this more than 7,117 HHs got the service.
5. Recommendations
- § In the woreda, the measures required to be classified as short and long term. In the short run, communities has to be secured from the negative consequences of water through awareness-creating campaigns in order to minimize the effect of water borne, water related diseases. In the long run, it should focus on expanding the schemes by collaborating with partners those works in the development of water supply. § In a kebele size of the family is one of the factors that determine the quantity of water number of water points to be constructed for that kebele should consider number of users. Unless its difficulties to talk about water supply coverage level, population with accessibility of water supply, and management of the conflict among users. § In the woreda, the process supplying sufficient water for the community needs to develop the integrated and multi-village water supply project system that can supply water from adjacent highland to lowland kebeles within the same line.
ACKNOWLEDGEMENTS
- We would like to express our thanks and gratitude to Madda Walabu University for granting funds to us. Also our thanks goes to the woreda & local administrators, & respondents for their continual provision of data and constructive ideas during data collection.