-
Paper Information
- Paper Submission
-
Journal Information
- About This Journal
- Editorial Board
- Current Issue
- Archive
- Author Guidelines
- Contact Us
International Journal of Hydraulic Engineering
p-ISSN: 2169-9771 e-ISSN: 2169-9801
2018; 7(1): 1-10
doi:10.5923/j.ijhe.20180701.01

Flow Characteristics around Wall-Mounted Circular Cylinder above the Horseshoe Vortex Region in Sub-Critical, Critical, and Super-critical Flow Conditions
 Abstract
 Reference
 Full-Text PDF
 Full-text HTML
1Department of Civil and Structural Engineering, University of Sheffield, Sir Frederick Mappin Building, Sheffield, UK
2RPS Group, 3 Pellon Place, Dyson Wood Way, Bradley Business Park, Huddersfield, DH2 1GT, UK
Correspondence to: Manar S. Al-Saffar, Department of Civil and Structural Engineering, University of Sheffield, Sir Frederick Mappin Building, Sheffield, UK.
| Email: |  |
Copyright © 2018 Scientific & Academic Publishing. All Rights Reserved.
This work is licensed under the Creative Commons Attribution International License (CC BY).
http://creativecommons.org/licenses/by/4.0/

The relations between the flow characteristics around a circular cylinder have been investigated experimentally. The flow characteristics within three planes around a cylinder, mounted normal to the bed in an open channel, have been chosen for this study. Four different flow conditions were used in the study, changing from sub-critical to super-critical conditions. Two dimensional laser Doppler velocimetry was used to measure the instantaneous velocity components of stream-wise and vertical direction. The turbulent stresses of the flow field were calculated as a measure of the turbulent flow property criterion. The correlation coefficients between the turbulent stresses of points that are on the same height from bed within two different planes have been calculated as a measure for the relation between the different planes around the cylinder. A strong and stable relation has been found between the upstream and perpendicular profiles. Also, the spectra of the two velocity components time series at each of the measured points have been calculated, and similar peaks have been found in points with similar positions within the perpendicular and downstream planes. The results show existence of two different relations among the planes around the cylinder.
Keywords: Circular cylinder, Laser Doppler velocimetry, Turbulent stresses, Spectral analysis
Cite this paper: Manar S. Al-Saffar, Flow Characteristics around Wall-Mounted Circular Cylinder above the Horseshoe Vortex Region in Sub-Critical, Critical, and Super-critical Flow Conditions, International Journal of Hydraulic Engineering, Vol. 7 No. 1, 2018, pp. 1-10. doi: 10.5923/j.ijhe.20180701.01.
Article Outline
1. Introduction
- A flow is disturbed when it encounters an obstacle, and it may continue to flow around it. The flow around obstacles resembles different situations, such as flow around buildings and bridge piers. A cylinder mounted in the bed of an open channel is one example of the obstacles that disturb the flowing water. Though, the flowing water continues to flow after hitting the obstacle, in which some of the flow retards in a backflow stream while the rest moves around and passes the obstacle. In the near bed flow, the retarding flow roles and form the well-known flow structure so-called horseshoe vortex (HV) system. To the downstream of the cylinder, a phenomenon known as Von-Karman street develops in the wake of the obstacle which extends to a limited distance depending on the flow, fluid and geometry characteristics. This experimental study investigates the velocity distribution in three planes around circular cylinder, fixed in a rigid bed conditions, at upstream (US), α=0o, from one side of the cylinder and perpendicular to the plane of symmetry, α=90o, and downstream (DS) of a cylinder, α=180o, where α is the angle between the plane of symmetry upstream of the cylinder and the plane where the measuring points are, in the counter clockwise direction as shown in figure 1. The aim of this research is to understand the relationship between the flow characteristics around a circular cylinder under different flow conditions in the region above the HV activity. The available studies that examined the flow around cylinders do not show if there is a relationship between the flow characteristics in different planes around cylinders. Many researches have been conducted to study the flow characteristics around cylinders focusing on the region where the horseshoe vortex system is active [1-6], while this work excludes the region of the horseshoe vortex and focuses on the region that extends above. The reason to avoid the HV region is due to the complexity of the system which has been confirmed in previous studies [7-9]. In this study, four tests have been conducted with different flow and geometry characteristics as shown in Table 1. The data has been collected using laser Doppler velocimetry (LDV) from three profiles, each of 70 points, US, perpendicular to the plane of symmetry, and DS of the cylinder. Turbulent stresses have been calculated from the fluctuations of the two instantaneous velocity components, in the stream-wise direction (u) and vertical direction (w). The flow characteristics represented by the two velocity components and turbulent stress have been studied as a measure for visualising the changes with the distance from the cylinder at different heights from bed for the three different planes around the cylinder. Also, the correlations between the flow turbulent stresses in the three profiles at different positions around the cylinders have been calculated and studied to understand if there is a relationship among them under different flow conditions. In addition, the spectra of the stream-wise velocity component were also used for comparison.
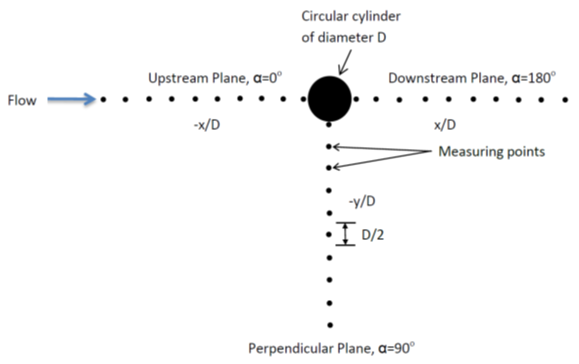 | Figure 1. A top view schematic drawing shows the circular cylinder and the measuring points within the planes where the velocity data have been collected |
|
2. Experimental Work
2.1. Measuring Apparatus
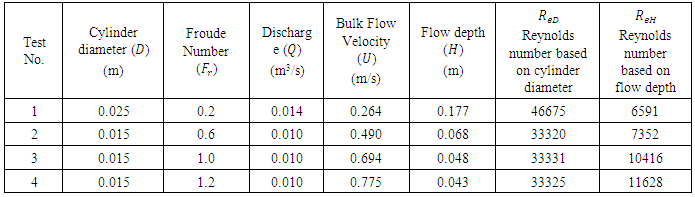
- The experiments were conducted in the hydrodynamics laboratory at civil and structural engineering department of The University of Sheffield, UK. A tilting water flume of 8.0 m long, and 0.3 m wide and deep has been used. The fully developed flow section starts at 4.0 m from the entrance of the flume. Two cylinders of 0.015 and 0.025 m diameter and 0.3 m height were used in a position normal to the bed and along the centreline of the flume. A laser Doppler velocimetry was used to measure the stream-wise and vertical velocity components. The LDV is of two-component backward scattering type with 400mW argon-ion air cooled laser model 543-TSI-A01a, fiber-optic probe, a three-dimensional traverse system, associated optical lenses, scattered light receiver, and signal processor, see figure 2 for flume measuring section and the LDV system. To ensure the quality of data of the experiments, a frequency of 100-200 Hz was maintained in all of the experiments. To maintain high range of frequency, the water was seeded with silicon carbide powder of 15 micron mean diameter, which helped to keep the number of particles that passes the measuring volume always enough for achieving high frequency of velocity measurements.
 | Figure 2. Experimental set-up with the LDV system, showing the flume measuring section and the cylinder |
2.2. Distribution of Measured Velocity Locations
- In this work, two instantaneous velocity components, u and w were measured at different points that distributed over three planes around circular cylinder. The velocity measurements fell in the vertical range of 0.2D to 2D from the bed in which it is above the horseshoe vortex activity region. The horseshoe vortex activity region is always under 0.2D as observed from the researches that studied the phenomenon [1, 2, 10]. The horizontal range for the measurements extended from 0.55D to 5D, from the centre of the cylinder.
2.3. Data Processing
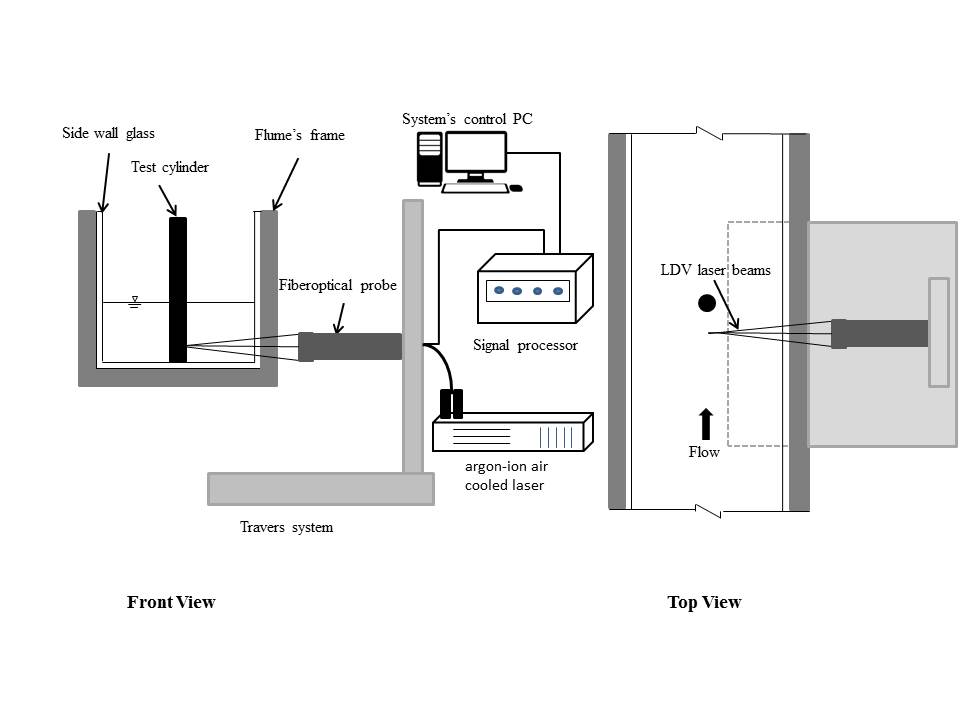
- The velocity time series for each component have been despiked using a Matlab code based on a two steps technique developed by Goring and Nikora [11]. The first step is to detect the spike of the signal by using a three-dimensional phase-space thresholding method, with the phase-space formed by the signal and its first and second derivatives. The points that are outside an ellipsoid defined by a universal thresholding criterion [12] are considered as spikes. These are replaced by interpolation (a third order polynomial is fitted to the 12 points on each side of the spike and used to re-estimate the value at the centre of this 25 point time series). Figure 3 shows the despiked time series in grey for the two velocity components, u and w, and the original data shown in black, < 1% of the points were considered as spikes in all the cases.
 | Figure 3. Two time series before and after despiking. The top plot shows the longitudinal velocity component, u, and the bottom shows the vertical velocity component, w. The black and grey lines indicate the signal before and after despiking, respectively |
3. Analysis and Results
3.1. Flow Profiles around the Cylinder
- The flow characteristics from 210 points around the cylinder have been studied by using the time averages of stream-wise and vertical velocity components normalised by the bulk velocity,
 , respectively and the time-averaged of turbulent stresses normalised by the square of the bulk velocity
  . Also, both of the horizontal and vertical distances are normalised by the cylinder diameter
  , and
, and  . Here the flow characteristics have been studied from the perspective of how the three quantities representing flow characteristics are changing with the distance from the cylinder at different heights from bed through a visual observation as shown in figures 4, 5, and 6.
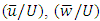
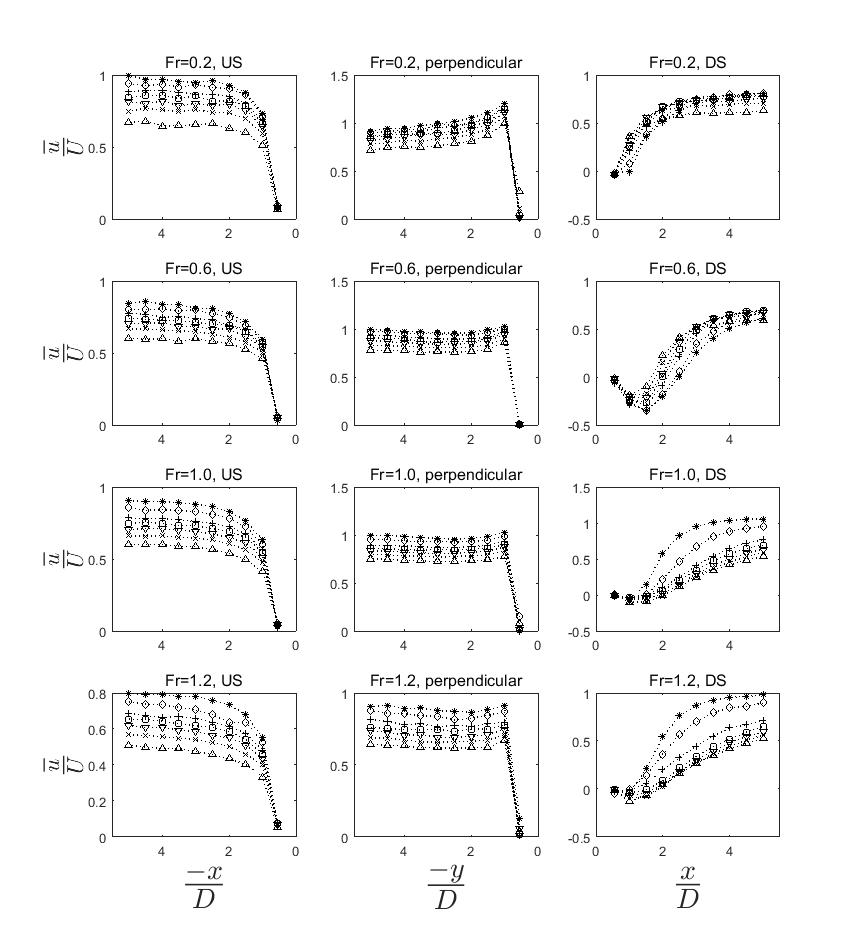 | Figure 4. Time-averaged stream-wise velocity profiles normalised by the bulk approaching velocity in the planes upstream, perpendicular and downstream of the cylinder respectively for four different Froude numbers. The following symbols are representing the distance from the bed z/D: ∆ @ 0.2, x @ 0.4, ∇ @ 0.6, □ @ 0.8, + @ 1, ◊ @ 1.5, and * @2 |
 | Figure 5. Time-averaged vertical velocity profiles normalised by the bulk approaching velocity in the planes upstream, perpendicular and downstream of the cylinder respectively for four different Froude numbers. The following symbols are representing the distance from the bed z/D: ∆ @ 0.2, x @ 0.4, ∇ @ 0.6, □ @ 0.8, + @ 1, ◊ @ 1.5, and * @ 2 |
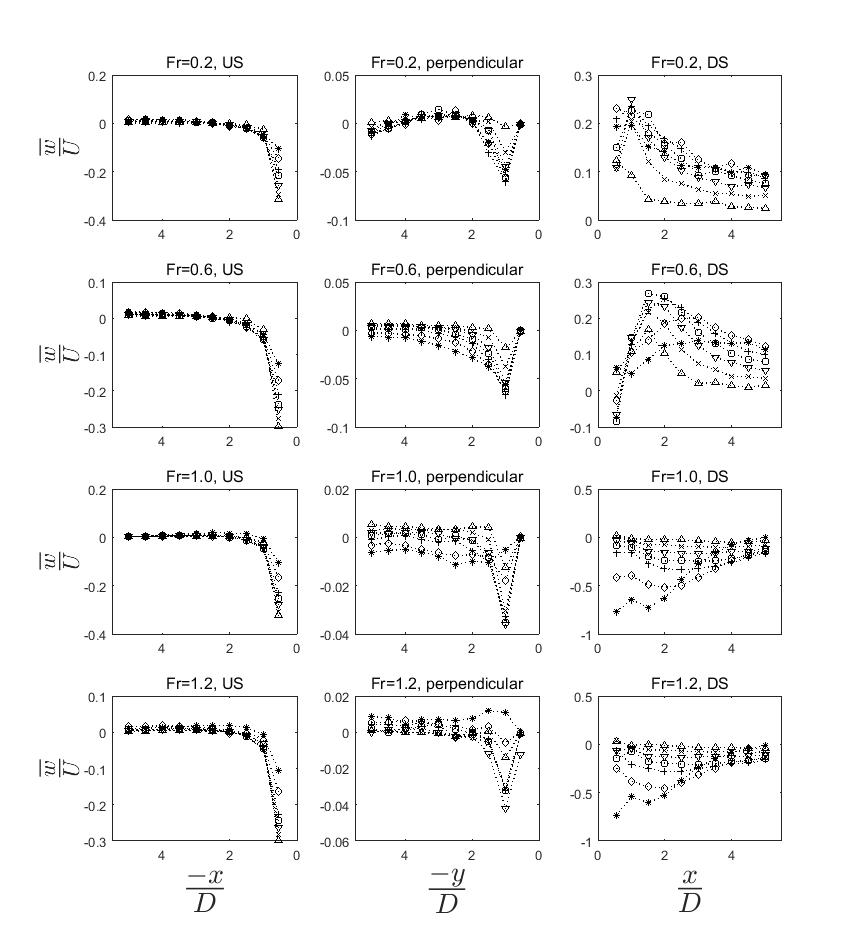
 | Figure 6. Time-averaged turbulent stresses profiles normalised by the bulk approaching velocity in the planes upstream, perpendicular and downstream of the cylinder respectively for four different Froude numbers. The following symbols are representing the distance from the bed z/D: ∆ @ 0.2, x @ 0.4, ∇ @ 0.6, □ @ 0.8, + @ 1, ◊ @ 1.5, and * @ 2 |
3.1.1. Upstream Profile
- The two velocity components and turbulent stress profiles to the US of the cylinder are shown in the columns to the left side of figures 4, 5, and 6. - The time-averaged stream-wise velocity components normalized by the bulk flow velocity and measured at the plane of symmetry, upstream of a cylinder, seem to have similar distribution patterns under sub-critical, critical and super-critical flow conditions as shown from the plots in the left side column of figure 4, where the closest vertical profile to the cylinder,
 from the cylinder centre, is always with very low normalised velocity values followed by the rest of the points, with values of
  . As the points move away from the cylinder, the
  values are slightly increased. At the same time, as in any open channel velocity profile, the values of velocity are increased as moving away from the bed. The
  values are similar for flow conditions of Froude number
  while they are different when
  and that is probably because of the effect of the high bulk flow velocity on the normalized time-averaged stream-wise velocity component within the plane of symmetry at higher Froude numbers. - The case is not very different for the vertical velocity components normalised by the bulk flow velocity in the plane of symmetry upstream of a cylinder, where they seem to behave similarly under different flow conditions as shown from the plots in the left side column of figure 5. Also, it is noticed that the velocity values are the lowest close to the cylinder and they increase gradually when moving away from the cylinder. At the same time it is shown that the velocity is the lowest for the points near the bed and it increases gradually as moving upwards. This applies clearly for the first few points from the cylinder and the differences shrink to the degree that they are not clearly noticed. The values are similar under different flow conditions, which mean no effect of the obstacle is shown to change the ratio between the vertical velocity component and the bulk flow velocity.- The turbulent stress profiles at upstream of the cylinder are behaving similarly across the four different flow conditions, and that came consistent with the other two cases of stream-wise and vertical velocity components. At the same time it is clear from the left side plots of figure 6 that the smallest turbulent stresses are for the sets of points measured at the highest elevation from bed within the plane of symmetry. It is also interesting that the nearest points to the bed are among the second or third lowest turbulent stresses in the profile, while the values of the points in the middle way from bed are having the highest stresses, and that is understood as they are away from the bed effect that hampers the flow velocity, at the same time these points are not very far from the bed where the back flow still has some effect.
3.1.2. Perpendicular Profiles
- The perpendicular profiles are represented in the plots shown in the middle columns of figures 4, 5, and 6. - For the stream-wise velocity profiles, the changes in flow distribution patterns are not very significant across the different flow conditions, especially for the highest Froude numbers. The time-averaged stream-wise velocity values have a different trend when moving away from the cylinder. At lowest
 , the
, the  values are very small at the points close to the cylinder then they increased dramatically at
  and decreased as moving away from the cylinder. In the three other cases of
  we see significant increase in
  values at
  then almost the same values for the rest of the points, this is an indication for the absence of the cylinder effect on the profiles and that is probably because of the small cylinder diameter as shown in table 1.- The vertical velocity components in the perpendicular plane are changing between very small positive to a greater negative peak values at distance of
  from the cylinder knowing that these values behave differently under different flow conditions. At low
  and particularly at
  the vertical velocity values at different elevations have almost similar values at all locations from cylinder except at the distance of
  and 1. As the
  increases a divergence in the values at different elevations becomes clear and that is again because the smaller sizes of the cylinders.- The turbulent stresses distribution patterns are not varying with different flow conditions apart from the largest
  cases where
  values start to deviate after
  , while for the rest of the flow conditions, the values slightly increase and become stable after the distance of
  from the cylinder apart from the lowest levels for
  and 1.0, and that because of the effect of the boundaries of both the cylinder and bed where the effect decreases as the flow becomes faster and the cylinder sizes are smaller. From the comparison of stream-wise and vertical velocity profiles with turbulent stress profiles, it seems that the turbulent stress profiles are dominated by the former rather than the latter velocity component.
3.1.3. Downstream Profiles
- The downstream profiles of stream-wise, vertical velocity components and the turbulent stresses at the plane of symmetry and in the wake of the cylinder under different flow conditions are shown in the right side column of figures 4, 5, and 6 respectively. - Regarding to the stream-wise velocity profile, the velocity seems to change across the different flow conditions, especially when the normalized velocity component profiles change when Froude number increased from 0.2 to 0.6. In the former, there is a constant increase in the
 values as
  increased, while for the latter, the
  values decreased to become negative then they start to increase as moving away from the cylinder. The difference between the top plot of the right side column of figure 4 and the bottom ones is clear when the values of
  are increasing as the points move away from the cylinder at
  while in the other cases the values start to increase at
  and that is due to the increased turbulence in the wake of the cylinder as the
  increased. - The vertical velocity component to the downstream of the cylinder have similar distribution at both
  and 0.6, and different from the velocity distribution at
  and 1.2. However, there are some differences between the two cases of each group. - The turbulent stress profiles in the wake of the cylinder are demonstrating obvious variation under different flow conditions as shown in figure 6. In the lowest Froude numbers neither the stream-wise nor the vertical velocity component has the dominant effect on the turbulent stresses profile. It is noticed that the flow characteristics are different under
  and 0.6 than
  and 1.2. The upstream profiles of stream-wise and vertical velocity components are consistent with turbulent stresses and that is because the turbulent stresses are a direct result of the multiplication of the two velocity components fluctuations, and the flow is showed to be organised and not very different under various flow conditions in the US and perpendicular velocity profiles. However, the profile perpendicular to the cylinder showed a less organised flow in the four different flow conditions. For the downstream profiles, the plots in figures 4, 5, and 6 show different flow characteristics, as they have changed under different flow conditions, and that is interpretation for the more complicated flow with higher values of normalised turbulent stresses as an indication of the most turbulent flow.
3.2. Relations among the Three Profiles around the Cylinder
- The relationship between each two of the three profiles around the cylinder has been investigated using two different approaches. The first one is through finding the correlation coefficients between the turbulent stresses values for each two of the profiles around the cylinder. The second approach has been done when the spectral analysis of the velocity time series for points of the same position around the cylinder has been calculated and compared.
3.2.1. Correlation Coefficient Analysis
- The correlation coefficients have been calculated between the points of the same elevation under the same flow conditions, and the results are plotted in figures 7, 8, and 9 representing the relation between the upstream and perpendicular profiles, upstream and downstream profiles, and perpendicular and downstream profiles respectively. The correlation coefficient is defined as a measure that determines the degree to which two variables' movements are associated. The range for the correlation coefficient values are between -1.0 and 1.0. The correlation coefficient of two random variables is a measure of their linear dependence. In this study, the correlation coefficient has been calculated from the following equation:
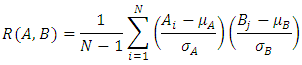 Where: N is the number of observations
  are mean of A and B respectively.
  are standard deviation of A and B respectively.Figure 7 shows a strong and stable relation between the turbulent stresses in points at seven different elevations from the bed and within the upstream and perpendicular profiles under different flow conditions. It is also shown that the relation is stronger for the high
  flow conditions.The relations between the points in the upstream and downstream profiles are shown in figure 8, where the general trend of the relations is that the correlation increases as the points move away from the bed, and that is more obvious in the higher Froude number cases. This underpins that the turbulent stresses become less dependent on the cylinder wake effect at both higher elevations and as the Froude number increases.
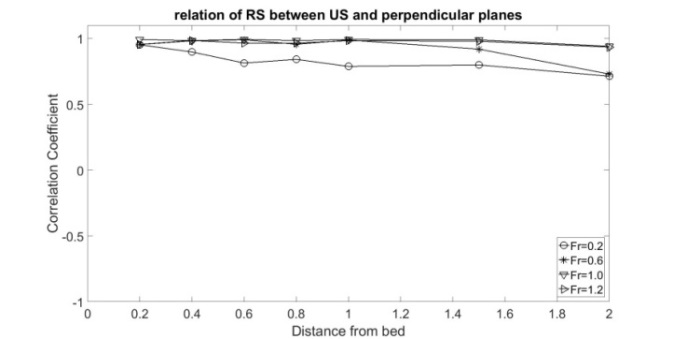 | Figure 7. Correlation coefficients between the turbulent stresses at similar levels from the bed between the upstream and perpendicular profiles around the cylinder for four different Froude numbers. The following symbols are representing the four different flow conditions per Froude number: o for  * for * for  |
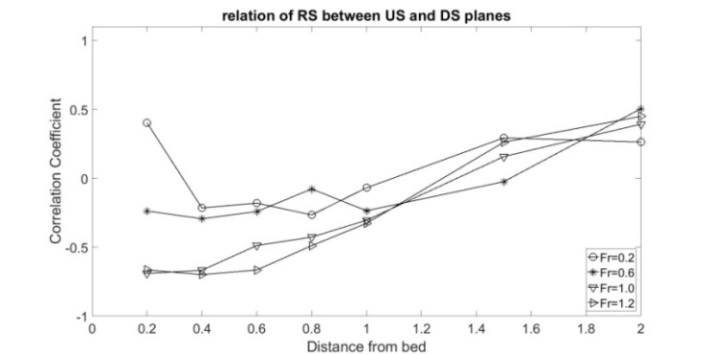 | Figure 8. Correlation coefficients between the turbulent stresses at similar levels from the bed between the upstream and downstream profiles around the cylinder for four different Froude numbers. The following symbols are representing the four different flow conditions per Froude number: o for  * for * for  |
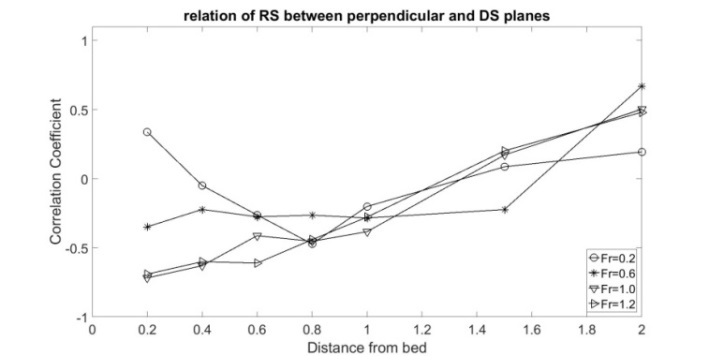 | Figure 9. Correlation coefficients between the turbulent stresses at similar levels from the bed between the perpendicular and downstream profiles around the cylinder for four different Froude numbers. The following symbols are representing the four different flow conditions per Froude number: o for  * for * for  |
3.2.2. Spectral Analysis
- The spectral analysis for both velocity components of all the 210 points around the cylinder have been done using the fast Fourier transform (FFT). The comparison between the spectra was based on the existence of a significant peak at the same frequency and magnitude. The upstream points have not shown any significant peaks. The peaks could be found in the perpendicular and downstream profiles. However, these peaks don’t exist in the spectra of some locations and not significant enough to be recognized in others. The most recognized peaks were found in the spectra of stream-wise velocity component within both the perpendicular and downstream planes at the distance of
 , and
, and  , and of elevations z=0.2, 0.6, 1.0, 1.5 and 2D. We understand that the peaks are representing a phenomenon that is happening in the downstream and perpendicular planes but no peaks are shown in the upstream region. Figure 10 illustrates the power spectral density (PSD) function of one of the four groups that have been used in the analysis. The peaks were easily recognized in the lowest Froude number flow,
  and less stood out as the Froude number increased. The peaks are believed to be representing the shedding of the vortices in the wake of the cylinder, the peaks are not significant in the downstream region and probably because the stream-wise velocity component was used rather than the span-wise velocity component as used by other researchers [14-16]. Also, the peaks are better represented in the case of low Froude numbers rather than the higher ones and the reason is because of the high flux that overcomes the shedding of the wake vortices, and also for the fact that the cylinder sizes are smaller Fr cases.
 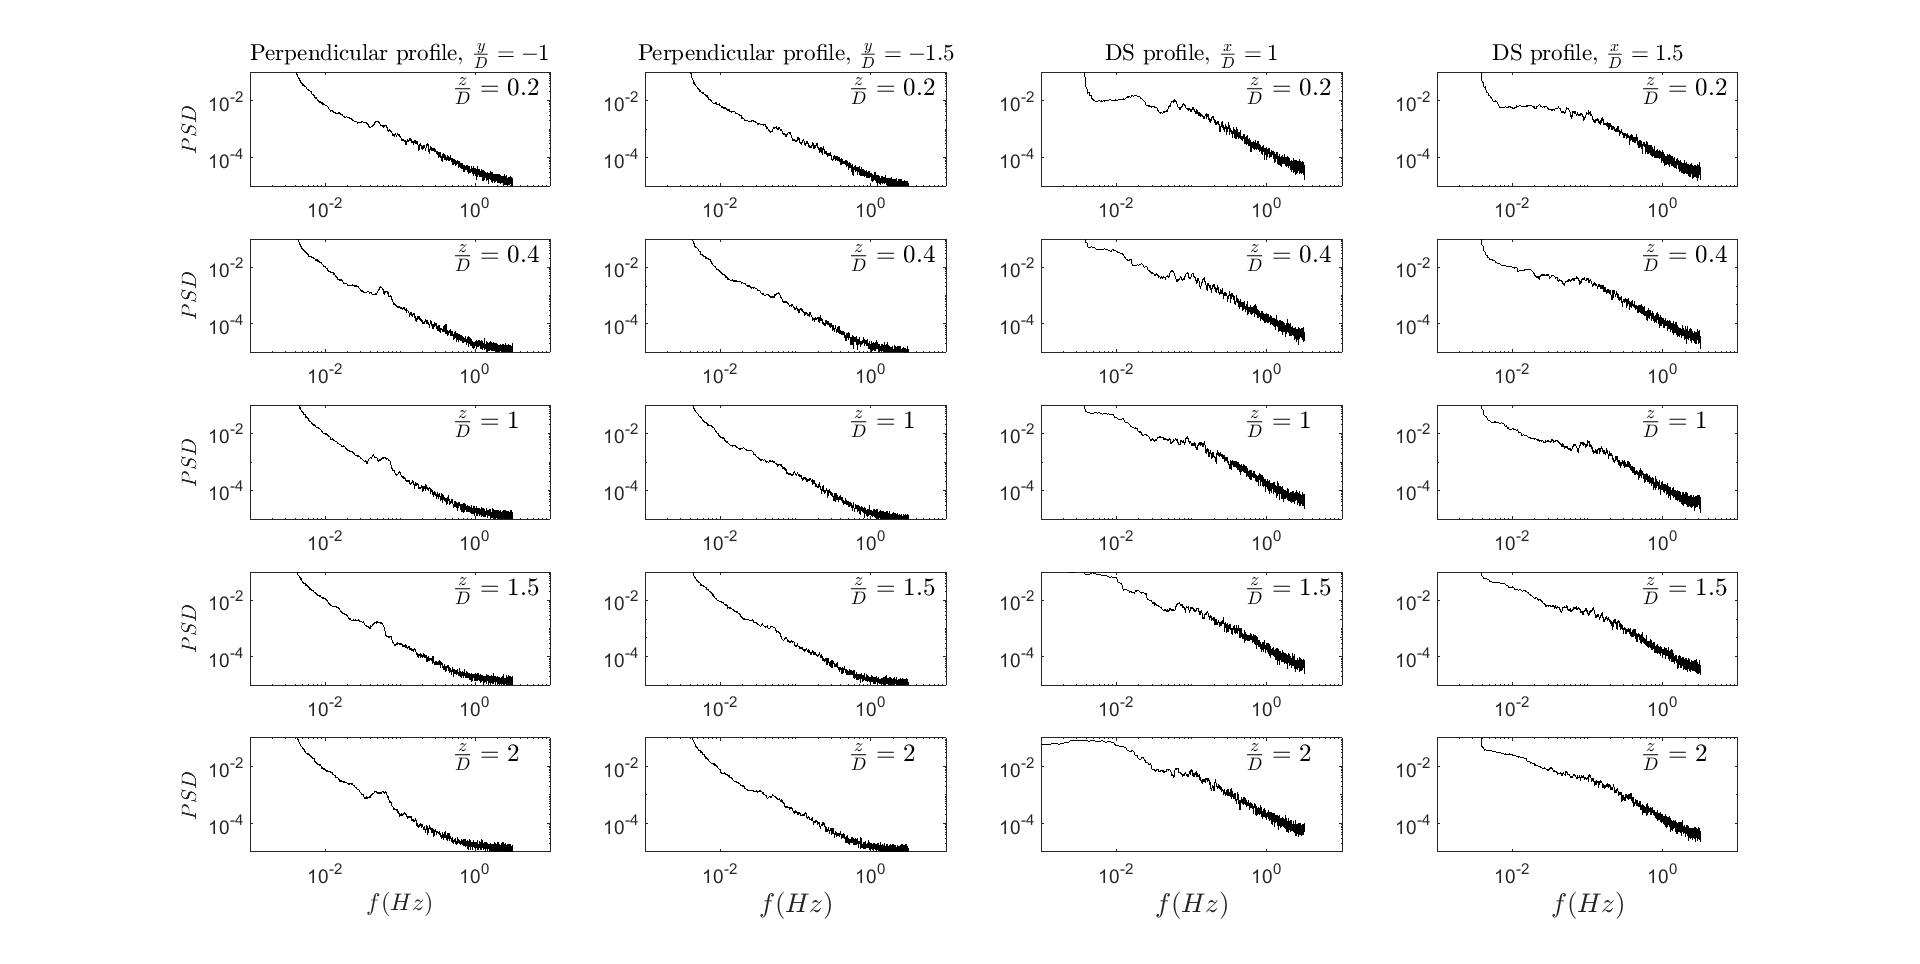 | Figure 10. Spectra of the stream-wise velocity components for selected perpendicular and downstream profiles. Here the cases at two distances from the cylinder and five elevations from bed have been presented for each profile |
4. Conclusions
- This study covered the instantaneous measurements of the stream-wise and vertical velocity components from three planes around circular cylinder mounted vertically in a flatbed in a fully developed open channel flow. The fully developed flow was disturbed due to the presence of the cylinder. The normalised time-averaged two velocity components at 210 points and the turbulent stresses have been documented. The velocity measurements were made using LDV instrument. It is observed that the upstream profiles of the two velocity components and the turbulent stresses are the most organised, see figures 4, 5, and 6, followed by the profile perpendicular to the plane of symmetry which showed to be less organised. The downstream profiles showed different flow characteristics, as they have changed under different flow conditions, and that is interpretation for the more complicated flow with higher values of normalised turbulent stresses as an indication of the most turbulent flow region around cylinder. Also, it has been shown from the results that the flow characteristics almost remain without any changes in the upstream and perpendicular profiles while there are significant changes in the down-stream profile under different flow conditions. In addition, two different approaches have been used to find the relationship between each two of the three profiles around the cylinder. Firstly through finding the correlation coefficients between the turbulent stresses values for each two of the profiles around the cylinder, where it has been found that there is a strong and stable relationship between the flow characteristics in the upstream and the perpendicular profiles, while variable relations have been found between the flow characteristics in the aforementioned profiles and the downstream profiles in the region of our study which excluded the region of the Horseshoe vortex activity. The second approach has been done when the spectral analysis of the velocity time series for points of the same position around the cylinder has been calculated and compared. From the spectral analysis, a relationship between the perpendicular and downstream planes has been determined due to the presence of peaks in the spectra. It is interesting that from the correlation analysis, a strong relationship has been found between the turbulent stresses of points from upstream and perpendicular planes that have similar positions. While from the spectral analyses, it has been found that there is a relation between the spectra peaks from points at perpendicular and downstream planes. These findings explain the existence of two different relations among the planes around the cylinder. The two different relations may refer to two different phenomena. Understanding of the two phenomena will help in understanding of the flow characteristics. So, more investigation is necessary to understand these phenomena and reach a general conclusion about these relations.
ACKNOWLEDGEMENTS
- The author is grateful to the Engineering and Physical Sciences Research Council (EPSRC) for lending the LDV and to Dr. W. Brevis for liaising with EPSRC. This research did not receive any specific grant from funding agencies in the public, commercial, or not-for-profit sectors.