Mehrdad Pourhosein1, Hossein Afzalimehr2, Vijay P. Singh3, Amir Ahmad Dehghani1
1Department of Water Engineering Gorgan, University of Agricultural Sciences & Natural Resources
2Department of Water Engineering, Isfahan University of Technology, Isfahan, Iran
3Department of Civil and Environmental Engineering, Texas A&M Univ., College Station, TX
Correspondence to: Hossein Afzalimehr, Department of Water Engineering, Isfahan University of Technology, Isfahan, Iran.
| Email: |  |
Copyright © 2015 Scientific & Academic Publishing. All Rights Reserved.
Abstract
Bed load transport is needed for river training works, reservoir management, watershed management, and ecosystem maintenance. A number of equations have been developed for determining bed load transport, primarily for alluvial rivers. This study applies the boundary-layer characteristics to evaluate bed shear stress and the rate of bed load. Also, seven bed load equations are evaluated by using field measurements from twelve cross-sections in three reaches of Babolroud River in northern Iran. It is found that only the equations of Duboys (1879), Hasanzadeh (1995) and Recking (2013) predict bed load reasonably when compared with observed bed load values. The bed load is about 2.70% of the suspended sediment load which is less than what is generally reported in the literature. The sediment rating curve developed using sediment discharge and water discharge relationshipfor all available data from four hydrometric stations produce satisfactory results.
Keywords:
Bed load, Suspended load, Boundary-Layer characteristics, Field measurements, Rating curve
Cite this paper: Mehrdad Pourhosein, Hossein Afzalimehr, Vijay P. Singh, Amir Ahmad Dehghani, Evaluation of Bed Load in a Gravel-Bed River, International Journal of Hydraulic Engineering, Vol. 4 No. 3, 2015, pp. 70-79. doi: 10.5923/j.ijhe.20150403.03.
1. Introduction
Prediction of bed load transport is important in many river engineering projects, including environmental, hydraulic, risk management, and reservoir life of dams. For some cases engineers use field measurements to calibrate a sediment curve, but most of the time such data do not exist because measurement of bed load in the field is difficult, expensive, and time-consuming task. This is why engineers employ computational methods, often established with flume experiments (Recking, 2013). When flow conditions exceed the criterion for incipient motion, sediment particles along an alluvial bed start to move. If the motion of sediment particles is rolling, sliding, or sometimes jumping along the bed, it is called bed load transport. Generally, the bed load transport rate of a river is about 5-25% of that in suspension (Yang 1996). Since 1970 a multitude of studies on bed load transport have been undertaken in different regions of the world (Garcia 2008). Many studies have statistically assessed the accuracy of bed-load transport equations, using paired data of measured and predicted bed-load transport rates (Yang and Huang 2001; Bravo-Espinosa et al. 2003; Barry et al. 2004). It is important to take into account the shape of velocity profiles via boundary-layer characteristics in order to better evaluate the main parameters of bed load motion, such as bed shear stress. To the authors' knowledge, no study in the literature considers boundary-layer parameters, the displacement thickness and the momentum thickness, to predict bed load transport. The objectives of this paper therefore are to: (1) apply the boundary layer characteristics to estimate shear velocity and bed load in gravel-bed rivers; (2) assess the performance of seven bed load transport equations in a gravel-bed river located in north of Iran using the estimated parameters by boundary-layer characteristics method; (3) present the best selected equation for the prediction of bed load in the selected reaches; and (4) predict bed load by the rating curve.
2. Study Sites and Methods
2.1. Study Area
The Babolroud River catchment, located in north of Iran, has an area of 1746.42 km². Babolroud River stems from the union of two main branches, as shown in Fig. 1. The maximum stream length within the delineated catchment is 110.7 km. Information on the volume of sediment originating from the drainage basin is needed for protecting reservoirs from high suspended sediment deposition. The climate of the catchment is moderate, with sultry summers and rainfall outspreading in winter based on local statistics for the period of 2000-2013. The annual flow discharge of the river is 11 m3/s. The river bed consists of sand, gravel and cobble. The basin is largely forested with sparse shrubs in higher elevations, and has moderate development.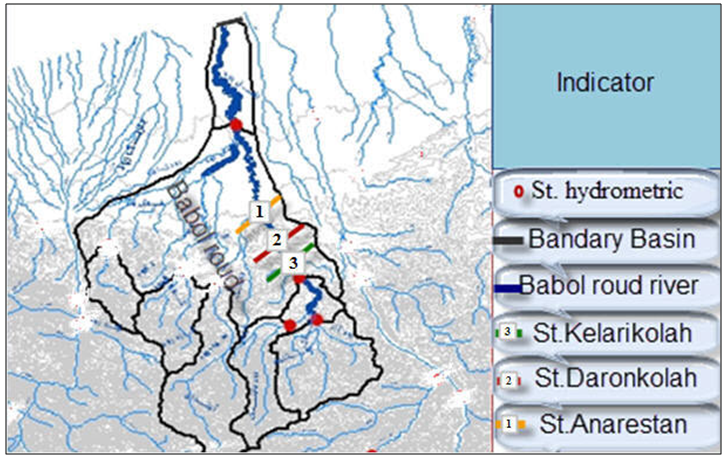 | Figure 1. View of Babolroud catchment |
2.2. Field Data
Field data were collected at 12 cross-sections in three selected reaches of the river, hereafter referred to as the Anarestan, Kelarikolah and Daronkolah reaches. These reaches were selected, because they are straight and relatively stable. The Anarestan reach is located about 20 km downstream of the Kelarikolah reach and about 12 km downstream of the Daronkolah (Fig. 2)a), Fig. 2(b) and Fig. 2(c)). Considering the median grain sizes more than 10 mm for both surface and subsurface layers, Wolman's method was used to analyze the data for all locations. Fig. 3(a) and Fig. 3(b) present surface and subsurface grain size distributions at three sample locations. Flow depth, velocity, bed slope, and bed load transport rate were measured at each cross-section simultaneously. Each cross-section was divided according to the width of the river into one meter intervals to ensure the accuracy of flow discharge measurements. The flow depth was measured by using surveying operations, and flow velocity was measured by a current-meter. The current meter used in this project was the type of Butterfly with the horizontal axis and manufacturing VALEPORT England. This current meter type (BFMS-N-002-1678) has an impeller diameter of 40 mm.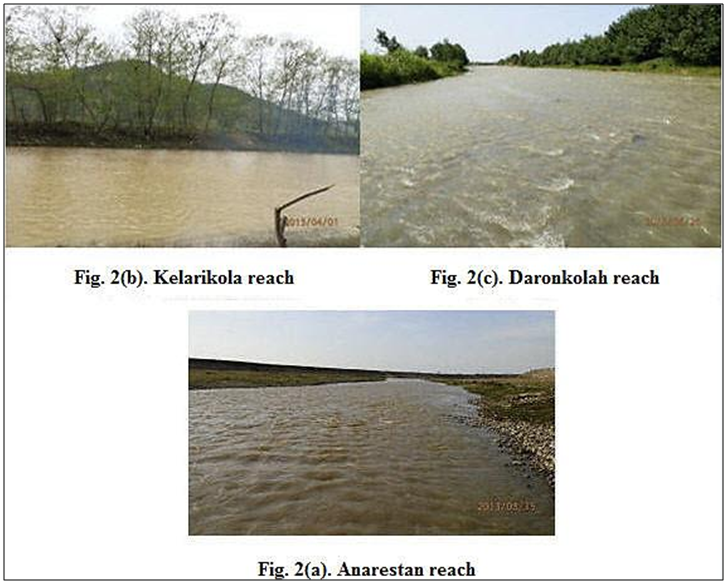 | Figure 2. View of three selected reaches |
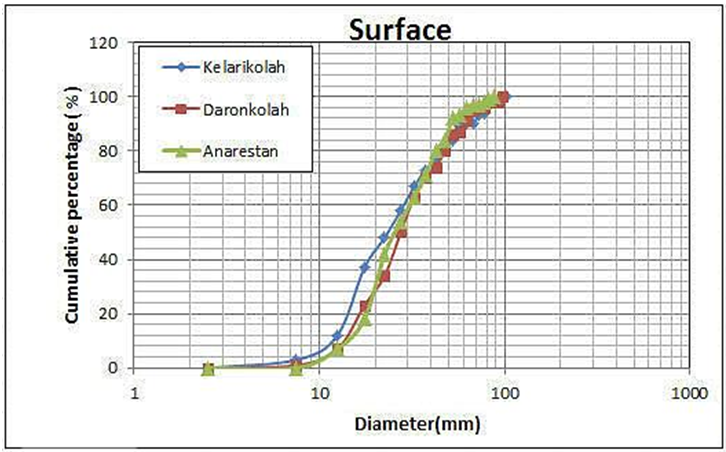 | Figure 3(a). Grain size of surface bed material at three sample locations |
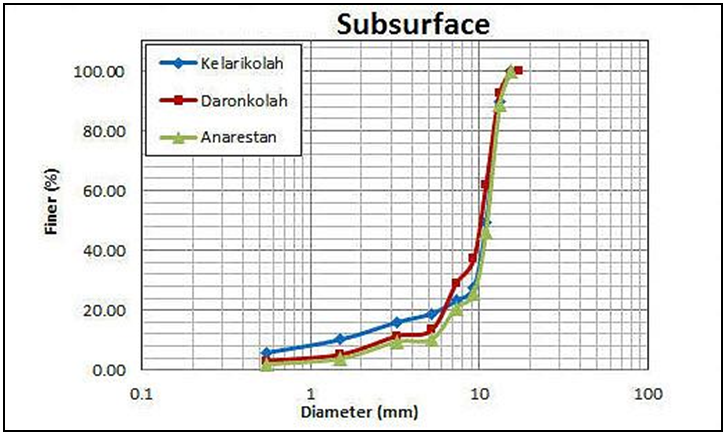 | Figure 3(b). Grain size of subsurface bed material at three sample locations |
The range of velocity was between 0.15 to 3 m/s. Each velocity profile consisted of at least 12 point velocity where each point was measured 3 times to improve the accuracy of data. Also, at each cross section, the velocity profiles were taken in three axes of central, left and right. Before and after field measurements, the current-meter was calibrated in a laboratory flume. A surveying camera (Leica TC 1700) was used to determine the bed slope between cross-sections for each reach. Accordingly, to determine the bed slope of a reach, 15 to 30 points were taken with distances of 15 to 20 m in the longitudinal direction of central axis and then the best line was fitted to these points. Fig (4) displays the bed slope of upstream of A5 which was determined as 0.0098. The bed load measuring instrument was hand-held Helley-Smith sampler weighing about 5 kg with an opening of 7.62×7.62 cm having a sediment collector bag made up of polyester with dimensions of 0.25 mm holes. Helley and Smith (1971) developed this method of handheld pressure difference bed load sampler with an intake nozzle of varying dimensions, a nylon mesh catchment bag attached to the rear of the nozzle, and a handle.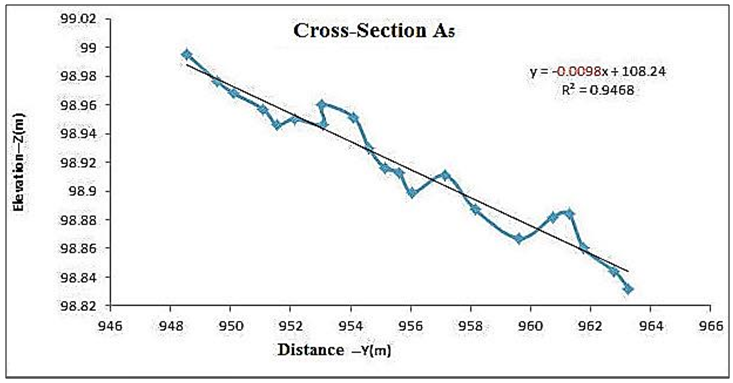 | Figure 4. Presentation of bed slope in cross-section A5 |
The sampler is placed on the streambed for a specified duration (60 seconds) with the nozzle opening facing the upstream flow direction, while particles larger than the mesh size were captured in the sediment collection bag. The Helley-Smith sampler gives a hydraulic efficiency from 0.9 to 1.1 for particles ranging from 0.5 to 16 mm as long as the extent of sampler fill is less than 30% (Emmett 1980). Advantages of the Helley-Smith sampler include portability and ease of use on an unaltered streambed. An example of Helley-Smith instrument is shown in Fig 5.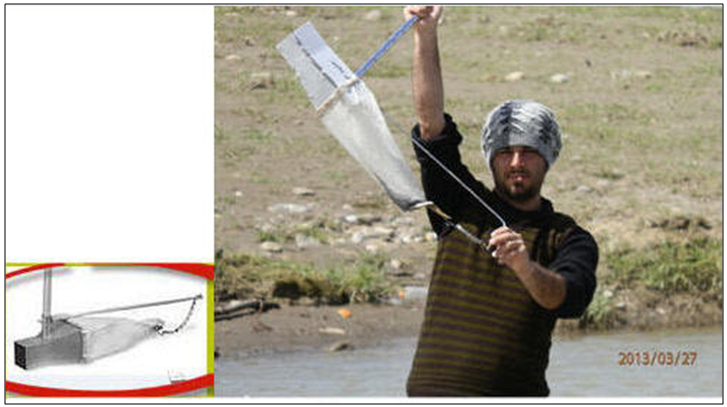 | Figure 5. Helley-Smith sampler |
2.3. Calculation of Shear Velocity and Bed Shear Stress
Shear velocity and bed shear stress are the most important parameters in bed load motion studies. Two methods of the boundary-layer characteristics (BLC) and the log law were used and compared to estimate the shear velocity in this study. Results showed that two methods were in good agreement, however, due to sensitivity of the log law to the reference level and sediment transport conditions, the BLC method [Afzalimehr and Anctil, 2000] which uses all data in each velocity profile, was applied as follows: 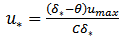 | (1) |
in which δ* (m) is the displacement thickness; θ (m) is the momentum thickness and umax (m/s) is maximum velocity observed in each velocity profile and c is constant that, based on laboratory data (Afzalimehr and Anctil 2000) and field data (Afzalimehr and Rennie 2009), was found to be 4.4 .The displacement and momentum thicknesses are defined as: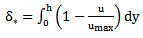 | (2) |
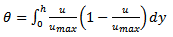 | (3) |
Equation (1) gives the shear velocity for each velocity profile at a specific location. However, to calculate bed load at a cross section, it requires the average of shear velocity at a section (u*). Using the average shear velocity at each section, the bed shear stress was determined as follows:  | (4) |
in which τ (N/m2) is shear stress; and  (kg/m3) is the fluid density.
2.4. Measurement and Calculation of Bed Load Transport Rate
Based on local experiments and the water organization statistics of Mazandaran province in northern Iran, the maximum sediment transport occurs at the end of winter (168 ton/day) and early spring (137.3 ton/day). All data collections were done during the end of winter and early spring. Also, the peak of rainfall was observed in the period of data collection when the river was in flood conditions and the bed load transport was maximum. Since the bed load is rarely measured in Iran, part of suspended sediment is used by the water organization of Mazadaran to estimate bed load transport. Sampling of bed load was carried out by using three methods:1-Single Equal Width Increment Bed Load Method (SEWI):In this method a cross-section was divided into 10 to 30 equal subsections, and sampling was carried out from the middle of each subsection where the sampling time was the same for all subsections.2-Multiple Equal Width Increment Bed Load Method (MEWI):In this method, a river cross-section was divided into 4 to 5 equal subsections. This procedure was repeated 8 to 10 times and in total 30 to 50 samples were taken for each section. Sampling time was the same for all subsections.3-Unequal Width Increment Bed Load Method (UWI)In this method, a cross-section of river was divided into 4 to 5 unequally subsections. Sampling was started from one side of river to the other side, repeating the sampling until reaching the starting point. In this method a total of 30 to 50 samples were taken at each section. This method was especially suitable for the sections where the flow was highly turbulent [Edwards and Glysson 1998]. This study applied the three methods for sampling the bed load.The appropriate sampling time for bed load by Haley-Smith was at least 60 seconds. If there was a low bed load rate, the sampling period was increased to 300 seconds (Ryan 1999). The sampling time in this study was 60,120,300 seconds, depending on the bed load rate in the selected section. Samples from each of the bed load traps were separately bagged in the cross section for laboratory analysis. The grain size was measured in the field using a sieve. Fig (6) shows the grain size curve of bed load for one of cross sections. 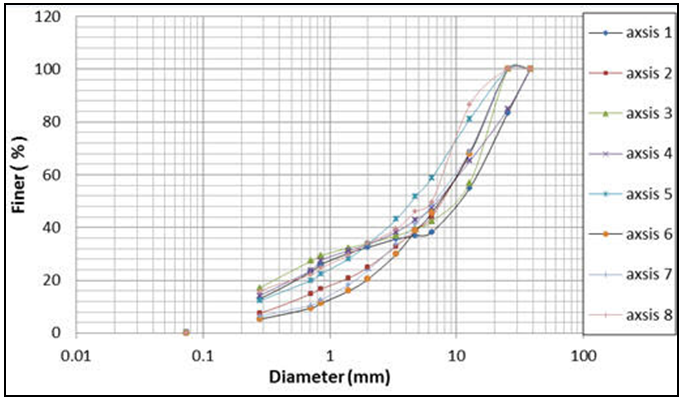 | Figure 6. Grain size distributions of bed load in Anarestan |
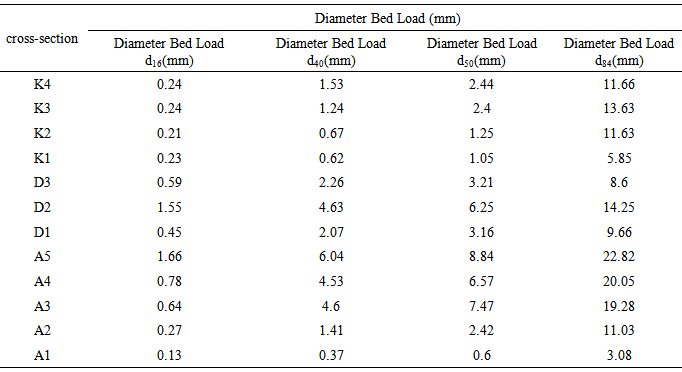
Table (1), presents the grain sizes of bed load in 12 selected cross-sections of Babolroud River.Table 1. Grain size of bed load in Babolroud river
 |
| |
|
Fractional transport rates were computed for each trap. The bed load rate (gr/sec/m) is shown on the vertical axis and the width of the river bed on the horizontal axis Fig (7). By calculating the area under the curve of Fig (7), the river bed load per unit time was evaluated. To calculate the area under the curve, the trapezoidal method was applied. As an example, Fig (7) shows the area under the curve to calculate bed load transport rate at cross-section K2.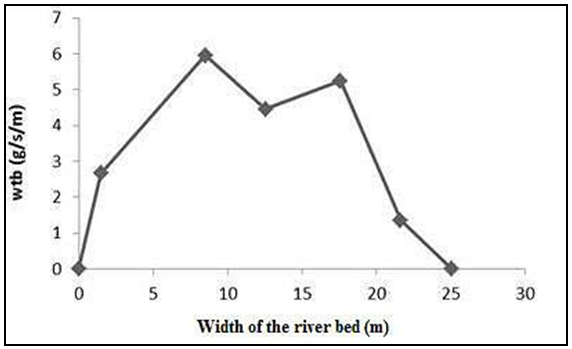 | Figure 7. Presentation of bed load discharge calculation in cross-section K2 |
To determine the bed load discharge, the following equation was applied (Song and Cheiw, 1998): | (5) |
where Qb = the bed load discharge (g/s), L = the length between two points (m), and Wtb = the dry weight per unit time and per unit width (g/s/m) which was calculated as follows: | (6) |
where M = the dry bed load mass (gr); Ws = the width of sampler (m); ns = the number of repeats; and ts = the sampling time (s).Table (2), presents a summary of measured and calculated parameters in this study.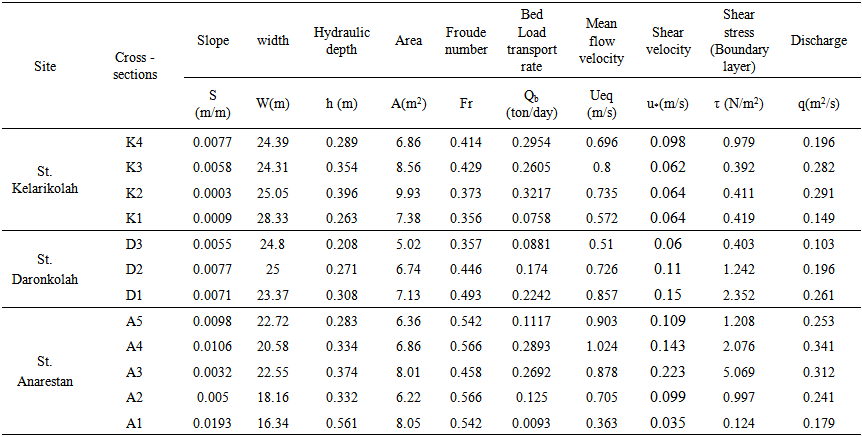 | Table 2. A summary of experimental data in Babolroud river |
2.5. Selected Bed Load Equations
The following seven bed load equations were selected to evaluate their predictive ability in Babolroud River: Duboy’s (1879 see Graf 1971), Schoklitsch (1943 see Graf 1971), Meyer-Peter and Muller (1948), Frijlink (1952), Bijker (1971), Van Rijn (1984), Hassanzade (1995) and Recking (2013). Although these equations were obtained using different approaches, they follow the same general assumptions: (a) The fluid and sediment properties are steady and uniform. (b) There is an infinite and continuous supply of sediment particle sizes representing some component of the bed material. (c) The sediment stored in a reach can be neglected (Graf 1971; Gomez and Church 1989). These assumptions are not well met in many natural streams, but they are considered in practice by river engineers.
2.6. Evaluation and Comparison of Bed Load Equations
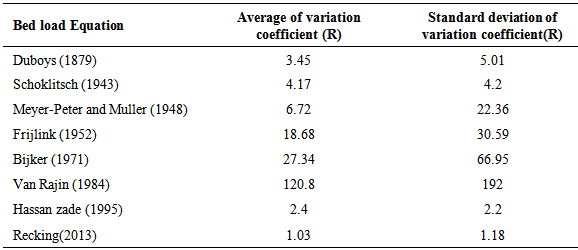
The ratio of calculated and measured bed load discharges (Ri) was used to evaluate the performance of a bed load equation:  | (7) |
where Qbc = the calculated bed load discharge; and Qbm = the measured bed load discharge. When Ri is close to 1, it shows a perfect correlation between Qbc and Qbm. The standard deviation of variation coefficient (R) and the average of variation coefficient (R) are calculated by equations 8 and 9 as follow: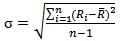 | (8) |
 | (9) |
Results of comparison of calculated and measured bed load transport are summarized in Table (3). Also, Fig. (8), compares the measured and calculated bed load transport rates for the selected equations for Babolroud River. Both table 3 and Fig. (8), show that Duboy’s (1879), Hasanzadeh (1995), and Recking (2013) equations present a reasonable agreement with measured data. 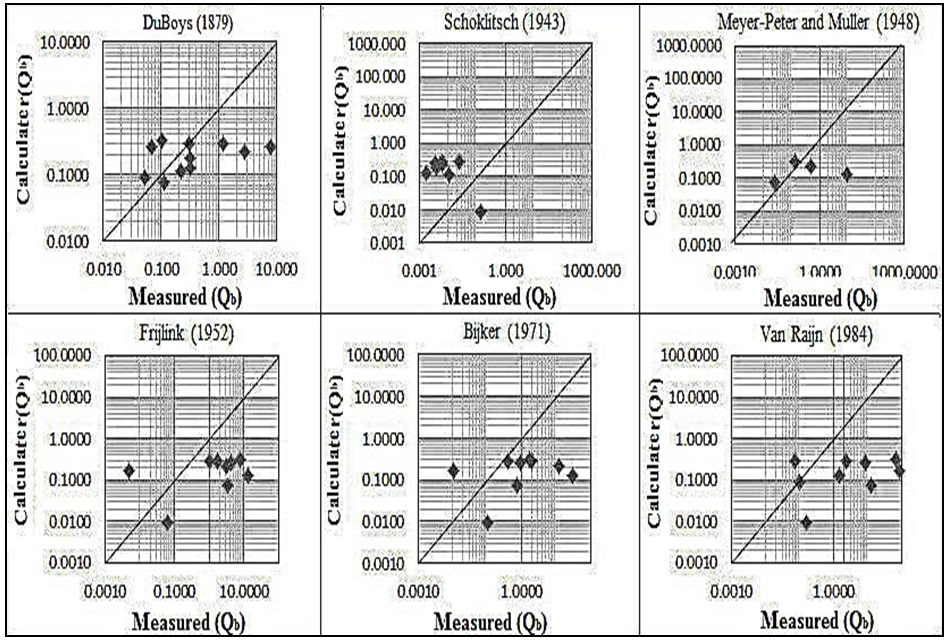 | Figure 8. Comparison of calculated and measured bed load rates for Babolroud river |
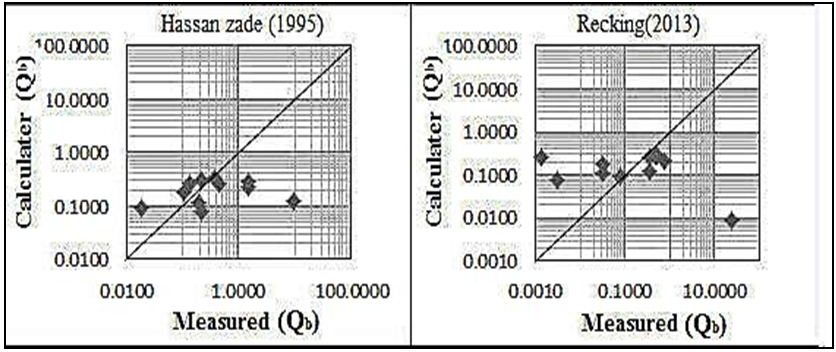 | Figure 8. Comparison of calculated and measured bed load rates for Babolroud river (continuance) |
Table 3. Variation coefficient (R) of bed load discharge for the selected equations
 |
| |
|
Better prediction of bed load by Hassanzadeh's equation (1995) is due to its similar morphological conditions with Babolroud river. Hasanzadeh's equation was presented for a river with particle diameter of 2.5 to 10 mm, and the annual flow discharge 13 m3/s in mountain regions. Recking’s equation (2013) is based on data obtained over sand-gravel bed rivers. There is a good agreement between Recking's equation and Babolroud river data. Also, Duboy’s equation (1879) was developed based on the difference between critical shear stress and shear stress. Since the present study determines carefully the bed shear stress using the velocity profile, the results present a reasonable estimation with Duboy's equation. Predictions by the equations of Bijker (1971), Meyer-Peter and Muller (1948), Schoklitsch (1943), van Rijn (1984), and Frijlink (1952) did not show a good agreement with measured data from Babolroud river. The differences in morphological conditions, grain size distribution and flow conditions can be attributed to unfavorable predictions.
2.7. Bed Load Prediction by Rating Curve
Sediment transport data were obtained from the Mazandaran regional water authority, which operates a network of hydrometric stations in Babolroud river. The hydrometric data set included: discrete data of suspended sediment concentration (C) and corresponding water discharge (Q), and average rate of suspended load (milligrams/liter and ton/day). Suspended sediment concentration samples were transported in one-litter plastic bottles for laboratory analysis. The sediment concentration of each sample was calculated by the filtration method, evaporating the sample, and then weighing the remaining sediment. On the other hand, water samples were taken for measurement of suspended sediment concentration several times a year, including a data set for a period of ten years (2001-2011). Once sufficient data were collected, a rating curve was obtained. In the absence of actual suspended sediment concentration (SSC) measurements, hydrologists apply sediment rating curves to predict suspended sediment concentrations for subsequent flux calculations and to determine long-term suspended sediment load. The bed load discharge can be predicted, using the suspended sediment rating curve. A regression analysis was performed to obtain a power function between suspended sediment discharge (Qs) and water discharge (Q) as follows: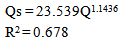 | (10) |
Where Qs = the suspended sediment discharge (ton/day), and Q = water flow discharge (m3/s).The sediment rating curves developed using Q-Qs for all available data from four Babolroud hydrometric stations are presented in Fig. 9. The best fit of Q-Qs reveals a coefficient of determination (R2) equal to 0.678. 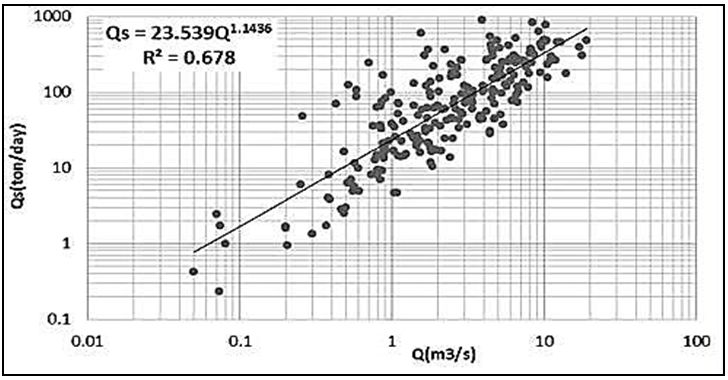 | Figure 9. Rating curve of Babolroud river |
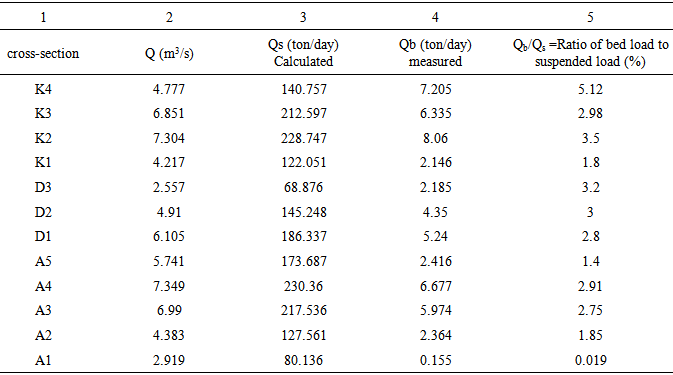
The ratio of bed load to suspended load was about 2.7 percent on average which is less than the values of 5 to 25 percent reported in the literature (Yang 1996). Data measured by the Regional Water Authority were based on only the suspended load where no wash load was involved. Accordingly, no wash load was considered in rating curve preparation. Having low percentage of bed load seems reasonable when the wash load is absent. Wash load is rarely measured in Iran, justifying the application of a certain percentage of the suspended load to estimate the bed load. Table (4), shows that the bed load transport involves a small part of total sediment transport in Babolroud river.Table 4. Ratio of bed load to suspended load and calculated suspended in each cross section
 |
| |
|
In order to reveal the dominant sediment transport in Babolroud river, the Rouse number was considered as follows: | (11) |
where K=0.4 is von Karman’s constant, u* is the cross sectional shear velocity and Ws is the settling velocity which is defined by Soulsby (1997) as: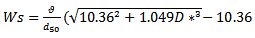 | (12) |
For equation (12),  Kinematic viscosity, and D* = is the dimensionless particle size. These parameters were obtained from the following equation:
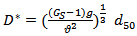 | (13) |
According to Rouse, when 2.5≤ P ≤ 7.5, sediment grains rolling and hopping along the bed, shows that bed load is the dominant sediment transport in river. The results of this study revealed that the average values of P for measured sections were higher than 2.5, showing the bed load transport was the dominant process for sediment transport in Babolroud river.
3. Conclusions
The following conclusions are drawn from this study:1. The boundary-layer characteristics method is applied to calculate bed shear stress and bed load transport. Application of this method gives more information about flow and leads to a more realistic estimation of bed load motion in coarse-bed rivers.2. Of the seven bed load equations tested using field measurements, only Hasanzadeh and Duboys equations are found to predict satisfactorily the bed load of Babolroud river. The agreement of the selected equations with the measured data may be justified by similar morphological conditions, grain size distribution and flow conditions in the watersheds.3. Using the Rouse number, it is found that bed load is the dominant sediment transport process in Babolroud river. The bed load is found to be about 2.7% of the suspended sediment load of Babolroud river. This small value confirms Schumm's finding (1977), who had reported that in mixed load channels between 3-11% of total load was conveyed as bed load, depending on the power of turbulence in rivers.4. The sediment rating curve seems satisfactory for this river with a coefficient of determination (R2 = 0.68) because it is almost impossible to get a perfect match when dealing with sediment transport rates, which typically vary several orders of magnitude from low flow to high flow.
References
| [1] | Afzalimehr H. Anctil F. (2000). “Accelerating shear velocity in gravel-bed channels”. J. Hydr. Sci. 1: 34-47. |
| [2] | Barry, J. J., Buffington, J. M., and King, J. G. (2004). “A general power equation for predicting bed load transport rates in gravel bed Rivers.” J. Water Resour. Res., 40, W104001. |
| [3] | Bijker, E. W. (1971). “Longshore transport computations.” J. Waterways, Harbors and Coastal Div. Eng., ASCE, 97(WW4): 687-701. |
| [4] | Bravo-Espinosa, M., Oster Kamp, W. R., and Lopes, V. L. (2003). “Bed load transport in alluvial channels.” J. Hydraul. Eng., 129, 783–795. |
| [5] | Duboys, M. P. (1879). “Le Rhone et les Rivieres a Lit affouillable,” Annales de ponts et chausses, 18(5): 141-195. |
| [6] | Edwards, T.K., and Glysson, G.D., (1998), “Field methods for measurement of fluvial sediment: U.S. Geological Survey.” Techniques of Water Resources Investigations, Book 3, Chapter C2, 80 p. |
| [7] | Emmett, W.W. (1980). “A Field Calibration of the Sediment Trapping Characteristics of the Helly-Smith Bed Load Sampler.” U.S. Geological Survey Prof. Paper No. 1139. |
| [8] | Ryan, S. E. and Troendle, C. A. (1999). “Measuring Bed Load with Handheld Samplers in Coarined Mountain Channels.” Stream Notes. www.stream.fs.fed.us. |
| [9] | Frijlink, H. C. (1952). “Discussion of bed load movement formulas.” Report No. X2344/LV, Delf, The Netherlands. |
| [10] | Gomez, B., Church, M. (1989). “An assessment of bed load sediment transport formulae for gravel bed river.” J. Water Resour. Res., 25(6), 1161 - 1186. |
| [11] | Garcia M. (2008). “Sedimentation Engineering, Processes, Measurements, Modeling, and Practice.” Manuals of Practice (MOP) MOP 110 / 1132 pp. |
| [12] | Graf, W. H. (1971). “Hydraulics of sediment transport.” McGraw-Hill, New York. |
| [13] | Hassanzadeh, U. (1995). “Investigation of erosion due to flood and its control.” Water Management Conference, Isfahan University of Technology. Iran, pages 203-212. |
| [14] | Helley, E.J. and Smith, W. (1971). “Development and Calibration of a Pressure-Difference Bed Load Sampler.” U.S. Geological Survey Water Resources Division Open-File Rep. pp.18. |
| [15] | Meyer-Peter, E., and Muller, R. (1948). “Formulas for bed load transport.” Rep. 2nd Meeting, Int. Association for Hydraulic Structures Res., Stockholm, 39-64. |
| [16] | Recking, A. (2013). “Simple Method for Calculating Reach-Averaged Bed-Load Transport.” J. Hydr. Eng., ASCE, 139: 70-75. |
| [17] | Song, T., Y. M. Cheiw and C. O. Chin, (1998). “Effect of bed load movement of flow friction factor.” J. Hydr. Eng., ASCE, 124(2): 165-175. |
| [18] | Schumm, S.A. (1977) "The fluvial systems." John Wiley & Sons, New York, 338 pp. van Rijn, L. C. (1984). “Sediment transport, Part 1: Bed Load Transport.” J. Hydr. Eng., ASCE, 110(10):1431-1456. |
| [19] | Yang, C. T., (1996). ” Sediment Transport: Theory and Practice,” McGraw Hill Series in Water Resources and Enviromment. The McGraw Hill Co. US. |
| [20] | Yang, C. T., and Huang, C. (2001). “Applicability of sediment transport formulas.” Int. J. Sediment Res., 16, 335–353. |
 Abstract
 Reference
 Full-Text PDF
 Full-text HTML