Omid Saberi 1, Gerald Zenz 2
1PhD Student, Institute of Hydraulic Engineering and Water Resources Management, Stremayrgasse 10/2, A-8010 Graz, AUSTRIA
2Prof, Institute of Hydraulic Engineering and Water Resources Management, Stremayrgasse 10/2, A-8010 Graz, AUSTRIA
Correspondence to: Omid Saberi , PhD Student, Institute of Hydraulic Engineering and Water Resources Management, Stremayrgasse 10/2, A-8010 Graz, AUSTRIA.
| Email: |  |
Copyright © 2015 Scientific & Academic Publishing. All Rights Reserved.
Abstract
This paper provides new relationships for predicting fill dam failure based on available history of dam failures around the world. These new relationships provide estimation about maximum discharge and breach formation time for embankment dam which failure by overtopping. The relationship for maximum discharge was derived by introducing a new method for handling the outflow hydrograph. The relationship for predicting breach formation time was obtained by using regression analyses. For the outflow hydrograph, the flow duration curve is split into three simple shapes and superimposed for calculating the peak discharge. The accuracy of the peak discharge is improved by considering the influence of dam reservoir volume. Additionally the prediction of breach formation time can be improved considerably by introducing a parameter related to the dam type. This parameter is defined as the ratio of dam storage over the height of the water behind the dam. The gained results show more reasonable results compared with existing formula.
Keywords:
Embankment dam, Overtopping, Empiric relationships, Peak outflow discharge, Failure time
Cite this paper: Omid Saberi , Gerald Zenz , Empirical Relationship for Calculate Outflow Hydrograph of Embankment Dam Failure due to Overtopping Flow, International Journal of Hydraulic Engineering, Vol. 4 No. 3, 2015, pp. 45-53. doi: 10.5923/j.ijhe.20150403.01.
1. Introduction
Dams are engineered to serve in a robust manner to store water for e.g. power production, irrigation purposes or flood protection. Spilling facilities are foreseen to prevent uncontrolled increase of the storage water level and therefore overtopping of the dam. In addition reservoir and dam monitoring systems provide together with a forecasting system the basis to intervene and start with safety measures. However, in very uncertain cases the uncontrolled overtopping of a fill dam could cause regressive erosion, uncontrolled loss of water and finally the failure of the retention structure. For rescue forces and protection measures to endangered areas downstream it is of highest interest to know the failure path, the time to failure and the flow duration curve to account for the flood risk. According to the National Inventory of Dams (US. Army [14]) a large amount of dams worldwide have been constructed as embankment dams. Therefor the importance considering embankment dam failures in hydraulic engineering, water resource management and risk management fields is given. Main reasons for embankment dam failure are overtopping and piping through the dam or foundation. Overtopping failure is also categorized as more dangerous compared to piping dam failure. The main reason is related to the mechanism of overtopping failure. During overtopping, the dam’s materials are washed away very quickly compared to piping failure mechanisms, in which water gradually erode the dam materials by seeping under the dam. Therefore, herein the dam failure due to overtopping is reassessed. For better understanding of such failure mechanisms, it is very important to identify dam failure parameters. Many parameters and factors influence the failure modes in embankment dams, and it is difficult to consider all of them to predict the outflow hydrograph. Therefore, in most of the existing relationships only major factors are considered. In this paper, we introduce and develop a relationships for predicting peak outflow discharge due to dam breach as well as dam failure time. Furthermore, the accuracy of these relationships is improved by taking major dam failure factors and parameters into account as these are the reservoir volume over the dam height, the shape of the outflow hydrograph and the general dam type considering the dam sealing concept. Our results confirm that considering mentioned factors has great influence on the evaluated results. Comparisons with available information about failed dams and numerically analyses of dam erosion processes show good correlation. This provides confidence by using the new relationship for risk assessment purposes. Herein, we will first explain about different mechanisms and models of embankment dam failures and second the worldwide dam failure data are discussed with the analysis method. Finally, a comparison is made between our relationship and some of the existing ones.
2. Mechanism of Overtopping Failure and Breach Parameters
A main failure mechanism in embankment dams occurs when a huge uncontrolled amount of erosion of the dam takes place. This will be happen if the structure of the dam is damaged or uncontrolled water is being released above the dam body. There are various mechanisms for different dam failure systems and many researches have already investigated such mechanisms (e.g. Ralston [10] and Singh [11]). The focus of this paper is on the overtopping failure mechanism, and this type of failure mechanism will be discussed and reviewed in more detail. First, different procedures and theories will be reviewed and evaluated quickly.Ralston [10] discussed and suggested a procedure to understand the cohesive and non-cohesive dam failure in embankment dams due to overtopping failure. In his procedure, first breach starts from the toe of the dam by head cut for cohesive dams. Contrary for non-cohesive dams, he pointed out that first erosion process starts at a point in the dam where tractive stress becomes higher than critical resistance. Singh [11] confirms Ralston´s theory for cohesive dams, and furthermore, he extends Ralston´s work about non-cohesive soil dams by introducing a new procedure. In this procedure erosion process for homogenous dams starts at seepage outcrop on the downstream slope of a dam. For a better understanding of unknown parameters, dam breach parameters are split into two parametrical categories named as geometric and hydrographic parameters. Geometrical parameters normally refer to the geometric characteristic of a dam breach shape as these are: height of breach  , top width of breach
  , average width of breach
  , bottom width of breach
  and side slope of breach
  . The hydrographic parameters describe factors like peak outflow discharge
  and time of failure
  which affect dam failures (Figure 1).
 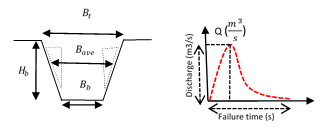 | Figure 1. Geometric parameters and Hydrographic parameters |
3. Methodology
In this part two new relationships are introduced to predict dam failure time and peak outflow discharge for all embankment dams which fail by overtopping flow. First the dam failure time is calculated by using the regression analysis on the previous dam failure data. The accuracy of this relationship, furthermore, is improved by considering the influence of different type of soils through a parameter named as δ. Then, the peak outflow discharge is calculated using a new method. In this new method, the area under a hydrograph is converted into three simple shapes and the peak discharge of breach calculated by sum of the all of these areas. In the following these two relationships are discussed in more details.
3.1. Calculate Dam Failure Time (tf)
3.1.1. Data Collection
In the first step reliable data about dam failure from literature are collected. To increase the accuracy of the prediction relationships the case scenarios are used, which provide reliable information about their influence on the main parameters.Therefore in this investigation, dam failures data are selected and gathered from different sources to have a certain variety in our parameterization and modelling procedure. Then, a close scanning on all datasets is performed to pick up the best quality data that fit to our purpose during this study. To set up a worldwide dataset three main sources are used. The first one is the work of Vijay P. Singh [12], in which information and data over 85 embankment dam failures are presented and discussed. The second source for our dataset is the work of Xu et al. [17]. They presented data about 75 dam failure data, and finally Froehlich [4] dataset containing is added is added into our data collection. All of these data were scanned thoroughly to remove incomplete or duplicated data. Furthermore, the selection criteria are narrowed down to contain only overtopping failure mode. These refined dataset is the basis of this investigation and is used in our calibration, validation and regression analysis.
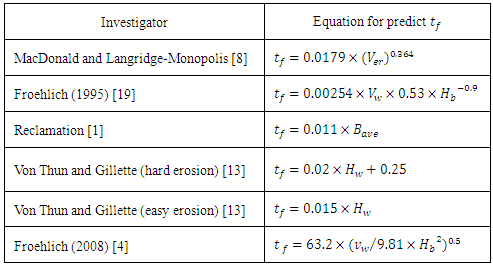
3.1.2. Literature Review for Empirical Formulas
The time span for a dam to fail is very important with respect to rescue measures. Any change in the  parameter has a high influence on the magnitude and shape of the outflow hydrograph. The correlation for this parameter is a determining factor for higher accuracy of outflow hydrograph prediction in embankment dams. Researchers have found various relationships for predicting dam failure time based on regression analysis. MacDonald and Langridge-Monopolis [8] relate dam failure time to the volume of soil eroded during dam failure
  . Froehlich [4] related dam failure time either to the volume of water behind the dam or to the multiplication between height of breach and volume of water behind the dam at the dam failure time. Reclamation [1] used average width of breach
  and Von Thun and Gillette [15] defined based on the different type of the soil of the dam two other relationships. Recently Froehlich’s study [4] considered height of water
  along with height of breach
  to find a regression relationship for calculating dam time to fail. These various works with a variety on relationships for defining the dam’s failure time emphasise the importance. The next section focus in more detail on this issue to define parameters based on the compiled dataset.
 Table 1. Literature review of dam failure time equations
 |
| |
|
3.1.3. New Relationship for Dam Failure Time
Dam failure time in embankment dams are depending on the type of the dam , kind of the failure, soil parameters, soil compaction, reservoir volume, height of dam, height of water behind the dam and many other conditions and parameters. Any change in either of these parameters can make sensible change in breach formation time, maximum discharge of breach and shape of the dam breach. In order to find accurate relationships for breach formation time based on the regression method, we need some specific parameters in our dam failures data. Most important ones are: height of the dam or height of the water behind dam  , volume of the reservoir
  and dam failure time
  . According to our prepared dataset on dam failures data, only 40 dams satisfy these requirements and as a result only these dams were considered for further calculation. Furthermore, these selected dams are divided into three different groups for a more accurate analysis.The dams in the first group are used to find the relationship for regression formula. The second group of dams were used to define the soil type coefficient. The last group was kept to be used later for validating the relationships. In group one regression analysis has been done between all dam failure parameters, as these are height of the dam, length of the crest, width of the crest and height of the water behind the dam. Based on this analysis, we find out that the ratio of the volume of water over the height of the water behind the dam (or height of the dam)
  has a good relation with dam failure time
  . The unit of
  should be in million cubic meters and unit of
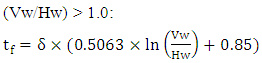
  should be in meter. Moreover, we find out that we can increase the accuracy of the new relationship by using additional two different regression equations based on the parameter
  . These two relationships are given in equations 1 and 2 when
  is equal and smaller or greater than one, respectively.
 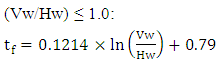 | (1) |
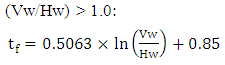 | (2) |
Here,  is the failure time of embankment dam,
  is the reservoir volume and
  is the height of the water behind the dam.
3.1.4. New Approach for Increase Accuracy of Dam Failure Time Equations
In the previous section, we found the main relationships for dam failure time (equations 1 and 2) like other previous dam failure relationships which were suggested by many other researches. But the most important factor which has big influence on these equations is the erosion rate of the dam. This factor directly depends on the type of the soil and type of the dam. Therefore, we consider this factor for different type of dam and different type of the soils to improve the accuracy of the aforementioned equations (equations 1 and 2). In the following this heuristic techniques is explained in more details.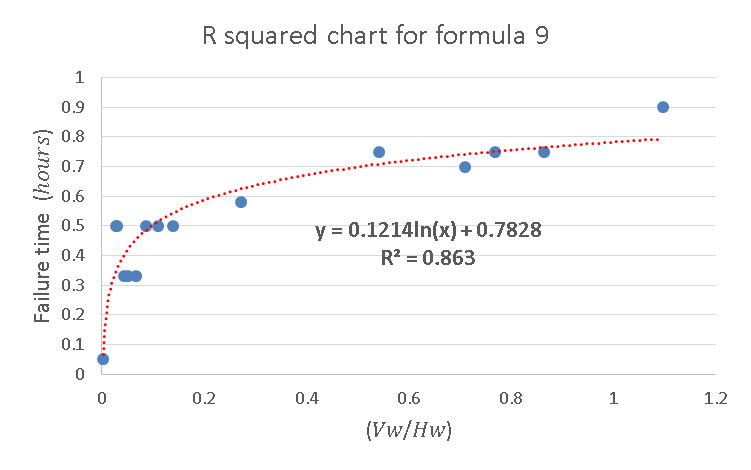 | Figure 2. R squared value for formula 1 |
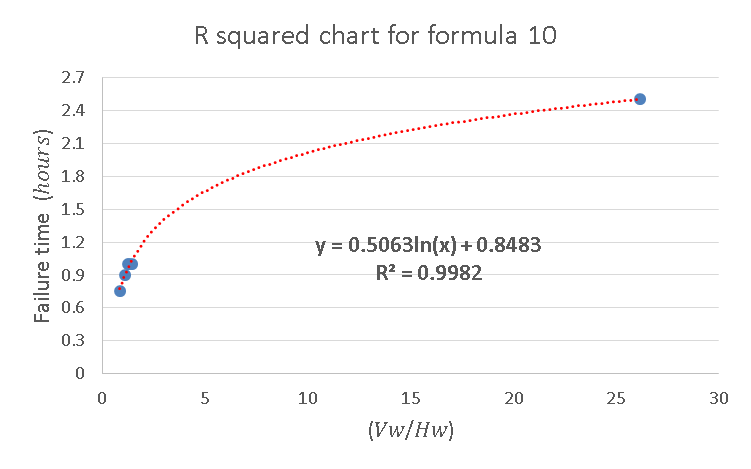 | Figure 3. R squared value for formula 2 |
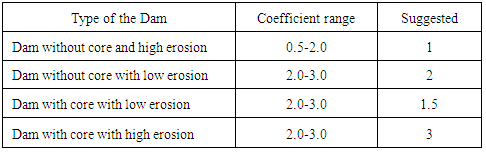
3.1.5. Different Type of the Soils and Dams Factor
In this study, different types of the soils and dams are defined based on the previous works on the embankment dam erosion fields. One of the essential one is the work of Y. Xu et al. [17]. They proposed different categories for soil erosion in all embankment dams. The first category related to the dam material composition while the second one concerns about the compaction effects. The compositions of the dam’s material have great influence on the erosion rate. For instance rock fill dams and clay dams have medium to low erosion rate while dams with sands with clay shows high to medium erosion. Y. Xu et al. proposed the second category for considering compaction effects on the soil erodibilty especially soil with the fine material in which compaction can have a higher influence on their erosion time. Furthermore, this issue discussed by Wan et al. [16]. They indicated that compaction degree has great influence to increase the erosion rate parameter especially in the soils with fine materials.In this paper, to improve the accuracy of the new relationships, we consider the soil type in those equations through a new parameter named as  (represents homogenous and non-homogenous dam). Equations 3 and 4 are the new relationships where
  is included and play the role of erodibility of the dam at failure time. It means that by increasing or decreasing
  , failure time
  will be increased or decrease respectively.Increasing
  shows that the dam erodes slowly (low erosion) and vice versa. Different categories of soil erodibility are introduced (high erosion, medium erosion, low erosion) according to Xu et al. [17]. Here, we present two different soil types as high erodibility and low erodibility. The low erosion category, furthermore, contains medium erosion and low erosion.
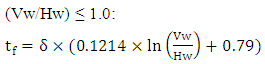 | (3) |
 | (4) |
Where  is the coefficient for the dam type (Table 2). We estimated the optimum value for
  parameter by calibration analysis for each type of the dam. Table 2 presents the results of this step.
 Table 2. Different type of the dam and soil with calibrate
 |
| |
|
3.2. Calculate Peak Outflow Discharge (Qp)
3.2.1. Literature Review for Empirical Formulas
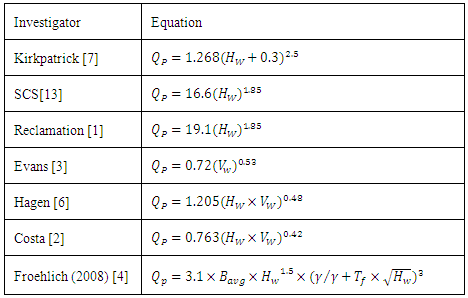
The peak outflow discharge calculation is very important to model embankment dam failure in this study. Peak outflow discharge has huge influence on downstream which causes the increase of indicators like loss of life (LOS) and population at risk (PAR). This means that finding the most appropriate relationship to predict peak discharge of breach and failure time is directly related to the risk assessment. Therefore, many methods use regression analysis to predict breach peak outflow. These relationships vary from each other by considering different dam breach parameters as the main reason for their failure relationships. Table 3 summarizes some of the most important relationships in this regard. In this table, different models to predict peak outflow discharge are compared by giving their actual relationship. Here, it can be seen that relationships like Kirkpatrick [7], SCS [13] attempt to relate height of water behind a dam at failure time  to the peak outflow discharge
  . On the other hand, some other relationships like the ones given by Evans [3] mainly relate volume of water behind a dam at failure time
  to the peak outflow discharge
  , while Hagen (1982) [6] models focuses on the multiplication between height of water behind a dam and volume of the water at failure time
  as the main reason for the peak outflow discharge
  . All of these relationships are examined against each other using our prepared dataset on dam failures (discussed earlier). Our results indicate that most of these relationships are not accounting for the overall behaviour. Moreover, we apply regression method approach to obtain a more appropriate relationship for the purpose to identify dam breach parameters and peak outflow discharge at failure time. However our simple regression attempts failed too in finding a better one. In the next section, the detail on the improved method for this calculation is discussed.
 Table 3. Literature review of breach peak outflow equations
 |
| |
|
3.2.2. New Method for Calculation Peak Outflow Discharge
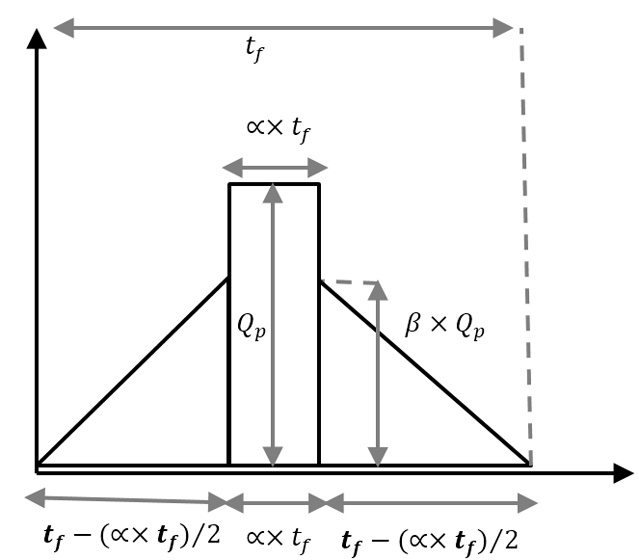
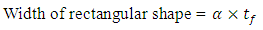
The outflow hydrograph of dam breach at the failure time depends on parameters like type of the dam, type of fill dam material, dam failure time, water level in the reservoir and several other parameters. As it is not possible to consider all parameters in one single relationship simplifications are made. Therefor one assumption is made by splitting the outflow hydrograph into the 3 primitive shapes as illustrated in Figure 5. The advantage of this new approach is that we have simpler shapes for the outflow hydrograph for embankment dam at failure time. Now it is to define the proportions of these shapes of primitives. Figure 4 depicts this concept regarding three simple hydrographs with unknown dimension proportions. These three simplified shapes are approximated by two similar triangular as well as a rectangular primitive as it is depicted in Figure 4 and 5. Here, the assumption is that the total areas of these shapes are equal to the total area of so called “real outflow hydrograph”. Therefore, by using aforementioned assumptions, any dam breach outflow hydrograph could be simplified into simple volume shapes which can be handled mathematically much easier. Figure 5 shows the concept of our second simplification procedure where each outflow hydrograph divided into simpler forms by using two similar triangular and one rectangular. Here, the height of the rectangular shape shows the maximum discharge of the outflow hydrograph  and the total width of the three shapes show the duration of the hydrograph
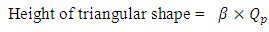
  . In this new hydrograph, different shapes in the outflow hydrograph can be represented by changing in the height and width of the previously defined geometrical objects. This means that it is now possible to define the height of the shape of the triangular as given in equation 7 and 8. Therein parameter
  is the rate of change in height of outflow hydrograph
 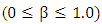 . The total width of the hydrograph is defined in equation 7 and 8. Here, parameter
  is considered as the rate of change in the width of outflow hydrograph
  . Therefore, by considering previously mentioned ranges for
  and
and  , we can write four dependencies between width and height of these three shapes as being presented in equations 5-8.
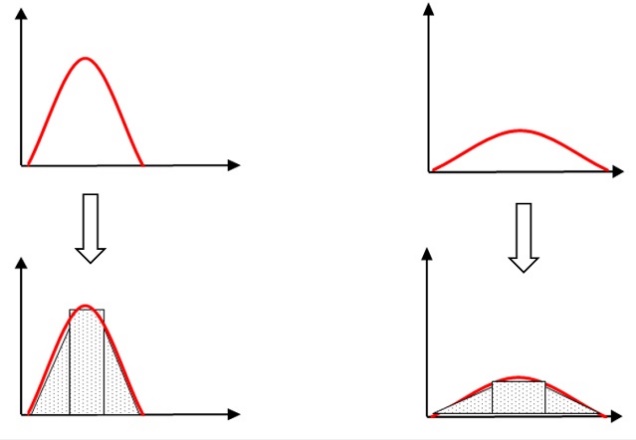 | Figure 4. Convert hydrograph to the simplified shapes |
 | Figure 5. Simplified hydrograph |
It is known that the area under the hydrograph is equal to the reservoir volume of the water behind the dam. This implies that the total sum area under the new hydrograph (rectangular and triangular shapes) should be equal to the spilled volume of water.Therefore, the volume of water behind the hydrograph can be calculated based on the equations 5-8 given as below: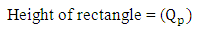 | (5) |
 | (6) |
 | (7) |
 | (8) |
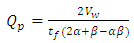 | (9) |
Here, known parameters are: 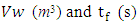 while unknown parameters are:
  .It is proposed to calculate
  using calibration and sensitive analyses based on the previous dam failures data. Here, this analysis is performed on the dam failure dataset from Xu et al. [17] for a wide range of
  parameters. Here, we suggest calculating the optimum value for these two parameters within this range by using the calibration result in Table 4.
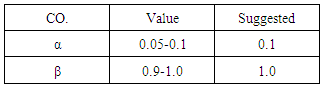
 Table 4. Calibrate α and β for peak outflow
 |
| |
|
4. Case Studies
The final step in our study is to validate failure time equation  and peak outflow discharge equation
  from previous parts. The validation dataset for this step is taken from three dam failure data. The first one is belong to IMPACT project and second one is about the Chaq-Chaq Dam Failure data and the last one is the 12th International ICOLD Benchmark Workshop dam failure data (Gerald et al. [5]).
4.1. Impact Project
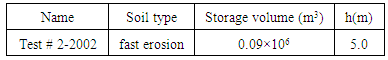
The IMPACT project (Morris [9]) is one of the well-known large scale dam break projects which have been done in the Norway in 2002. In this project some dam failure parameters like outflow discharge, water level, pure pressure of water are measured and recorded during failure time. In this paper, we choose Test # 2-2002-homogenuis non-cohesive dam, for validation purposes. The parameters regarding this test are given in Table 5, 6.Table 5. Dam failure data for Test # 2-2002 dam
 |
| |
|
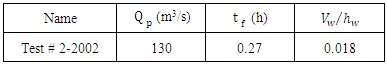
Table 6. Measurement failure parameter of Test # 2-2002 dam failure
 |
| |
|
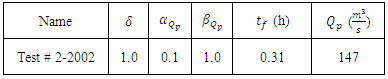
4.1.1. Calculate Outflow Hydrograph of IMPACT Dam Failure by Using New Relationship
Based on the information given in this table,  is equal 0.018 which means that this ratio is less than 1. parameter
  should be considered 1.0 (Table 2). In the Table 5, the volume of the water behind the dam (according to out flow hydrograph) is
 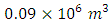 , which results in 0.1 and 1.0 for
  parameters, respectively (Table 4). Based on these parameters, the breach peak outflow
  and dam failure time
  are calculated and presented in Table 7.
Table 7. Calculated result of new formulas
 |
| |
|
It is additionally possible to draw out flow hydrograph for IMPACT test by using relationships of 5-8 as below: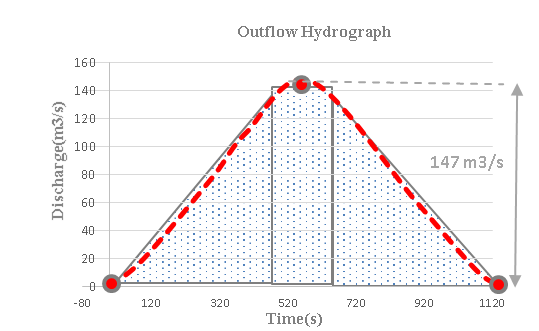 | Figure 6. New formula result for IMPACT test |
4.1.2. Compare Results of New Relationships with Other Studies
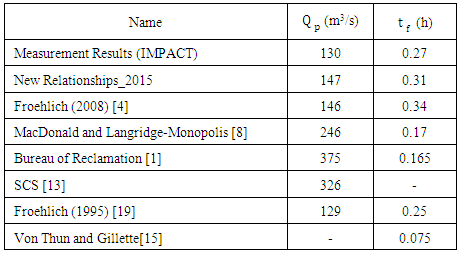
For evaluating the accuracy of the new relationships, our final results are compared with measurement results and result of six other relationships. This comparison and validation results are given in Table 8.Table 8. Compare results of new relationships with other studies
 |
| |
|
This table shows that the new relationships give a good approximation in comparison to other relationships like Froehlich [4] and Froehlich [19].
4.2. The Chaq-Chaq Dam failure
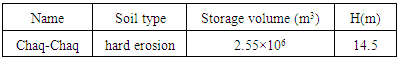
The Chaq-Chaq dam [18] is located in north east of Iraq. This dam is a zoned earth dam of central clay core with gravelly shell. This dam failed on 4th February 2006 due to overtopping flow, fortunately, this dam located far from the populated area. Therefore, no body injured during this dam failure. The main reason for the Chaq-Chaq dam comes back to the spillway construction and low compaction in some part of this dam. Table 9 shows general dam parameters and Table 10 shows measurement dam failure parameters.Table 9. Dam failure parameters for the Chaq-Chaq Dam
 |
| |
|
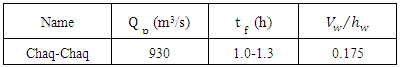
Table 10. Measurement failure parameter of the Chaq-Chaq Dam
 |
| |
|
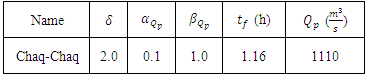
4.2.1. Calculate Outflow Hydrograph of the Chaq-Chaq Dam Failure by Using New Relationship
We calculate the breach outflow hydrograph by using new formula. According to the data given in the Table 9:  is equal to 0.175 and soil type is hard erosion which means that parameter
  should be considered equal to 2.0 (Table 2). The
  parameters equal to 0.1 and 1.0, respectively (Table 4). Based on these parameters, the breach peak outflow
  and dam failure time
  are calculated and presented in Table 11.
Table 11. Calculated result of new formula
 |
| |
|
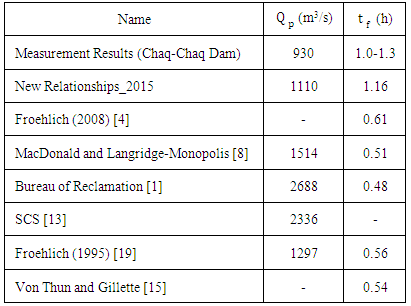
4.2.2. Compare Results of new Relationships with Other Studies
To evaluate the accuracy of our new relationships, the final results compared against measurement results and result of six other relationships. Table 12 shows the results of this comparison:This table shows that the new relationships give a higher accuracy and a better prediction in comparison to the other methods.
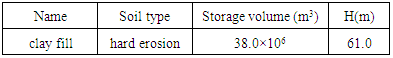
4.3. ICOLD Benchmark Workshop
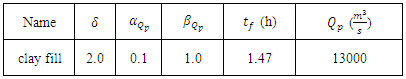
12th International ICOLD Benchmark Workshop (Gerald et al. [5]) was held in Austria in 2013. In this workshop, a hypothetical clay fill dam which was constructed in the mountain was investigated (Table 13). This dam directly located above a highly populated area and they assumed overtopping failure taking placed on this dam because of a heavy snowmelt. In this workshop each participant should calculate breach outflow hydrograph for this hypothetical embankment dam failure. Table 13 and 14 shows dam failure data and measurement failure parameters of this dam.Table 12. Compare results of new relationships with other studies
 |
| |
|
Table 13. Dam failure data for ICOLD Benchmark Workshop
 |
| |
|
Table 14. Measurement failure parameter of ICOLD Benchmark Workshop
 |
| |
|
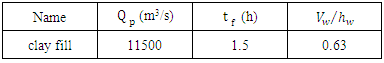
4.3.1. Calculate Outflow Hydrograph of ICOLD Benchmark Workshop Dam Failure by Using New Relationship
We calculate the breach outflow hydrograph of this dam using our new formula. According to the data given in the Table 13,  can be considered equal to 0.63. Soil type is hard erosion which means that parameter
  should be considered equal to 2.0 (Table 2). The
  parameters are equal to 0.1 and 1.0, respectively (Table 4). Based on these parameters, the breach peak outflow
  and dam failure time
  are calculated and presented in Table 15.
Table 15. Calculated result of new formula
 |
| |
|
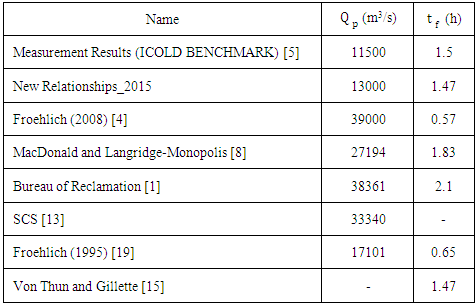
4.3.2. Compare Results of New Relationships with other Studies
For evaluating the accuracy of new relationships, our final results are compared with measurement results and result of six other relationships. Table 16 all of these results against each other.This table obviously shows that our predicted values are very close to the real ones in most of the dams. The only big difference we could observe is difference between the predicted values of pick outflow discharge with measurement results (even in this case our predicted value is much closer to the measurements). The main reason for this difference can be related to our assumption in calculating peak outflow discharge where it is assumed that the whole water behind dam flow away during failure time. Table 16. Compare results of new relationships with other studies
 |
| |
|
In general, the most important reasons for increasing the accuracy of the new relationships in comparison to the previous relationships can be summarized as:1- In the new relationships different type of the soils and different type of the dam are considered in the dam failure time equation through a parameter named as  .2- In the new relationships, we assumed that whole reservoir volume become empty during dam failure time. This assumption control results in pick outflow discharge equation given as below:
 | (10) |
3- In the new relationships, time failure parameter is considered at peak out flow equation (equation 9). Therefore, outflow hydrograph has balance between peak outflow discharge and dam failure time. It means that by increasing failure time peak outflow discharge decrease and by decreasing failure time peak outflow discharge increase.
5. Conclusions
In this paper, new relationships for breach behavior of embankment dams which fail due to overtopping are investigated, introduced, calibrated and validated. These new relationships are based on a collected database of 52 documented dam failures. In all of these case studies failure time  and reservoir volume
  are known. Among them, 23 dams have known soil types while 29 dams have known breach peak outflow
  . These new relationships are derived and validated using this dataset. Furthermore, their accuracy is validated against previous relationships as well as understudies dams measured data. The following conclusion can be made based on this work results: 1- The accuracy of breach peak outflow
  prediction can be improved by simplifying the hydrograph shape into simpler shapes (two equal triangles and one rectangular). 2- Nonlinear regression analysis procedure is used to find the empirical formula for predicting dam failure time
  . Based on this new analysis, we found that dam erosion has a huge influence on dam failure time. This means, that the accuracy of the prediction can be improved by considering soil type of the dam in the regression formula. To include this parameter, a new parameter
  is introduced and the equations modified accordingly. 3- Both new equations (peak outflow,
  and dam failure time,
  ) show some errors for small dams (
 million cubic meters). This error is mainly related to the lack of information for calibrating
  .
.
ACKNOWLEDGEMENTS
I would like to express my deepest appreciation to all those who provided me the possibility and help me to complete this paper.
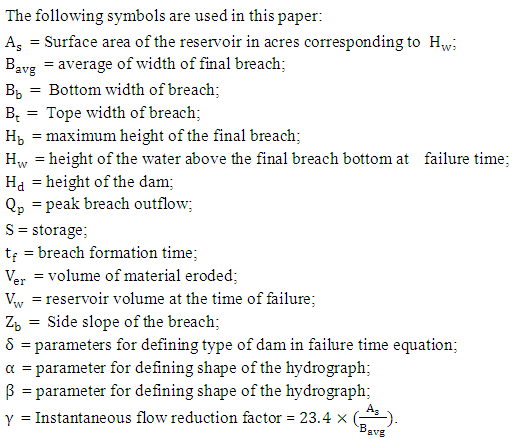
Notation
References
| [1] | Bureau of Reclamation. (1988). Downstream hazard classification guidelines. ACER Tech. Memorandum Rep. No. 11, U.S. Dept. of the Interior, Bureau of Reclamation. Denver. |
| [2] | Costa, J. E. (1985). Floods from dam failures. U. S. Geological Survey Open-File Report 85 560, Denver, CO, 54 p. |
| [3] | Evans, S. G. (1986). The maximum discharge of outburst floods caused by the breaching of man-made and natural dams. Canadian Geotechnical Journal, 23, August. |
| [4] | Froehlich, D. C. (2008). Embankment dam breach parameters and their uncertainties. Journal of Hydraulic Engineering, 134(8),1708-1721. |
| [5] | Gerald, Z., and Goldgruber, M. (October 2013). NUMERICAL ANALYSIS OF DAMS. 12th INTERNATIONAL ICOLD BENCHMARK WORKSHOP (S. 195-322). Austrian National Committee on Large Dams. |
| [6] | Hagen, V. K. (1982). Re-evaluation of design floods and dam safety. Proc., 14th Congress of Int. Commission on Large Dams, Int. Commission on large dam. Paris, 475–491. |
| [7] | Kirkpatrick, G. W. (1977). Evaluation guidelines for spillway adequacy. American Society of Civil Engineers, Engineering Foundation Conference. Pacific Grove, CA, pp. 395-414. |
| [8] | MacDonald, T. C., and Langridge-Monopolis, J. (1984). Breaching characteristics of damfailures. J. Hydraul. Eng., 110(5), 567–586. |
| [9] | Morris, M. (2006). IMPACT Project Field Tests Data Analysis. HR Wallingford, UK. |
| [10] | Ralston, D. C. (1987). Mechanics of embankment erosion during overflow. Proc., 1987 ASCE National Conf. on Hydraulic Engineering,ASCE. NY, 733–738. |
| [11] | Singh, K. P. (1982). Sensitivity of outflow peaks and flood stages to the selection of dam breach parameters and simulation models. State Water Survey (SWS) Contract Report 288,Illinois Department of Energy and Natural Resources, SWS Division, Surface Water at the University of Illinois, 179 p. |
| [12] | Singh, V. P. (1998). DAM BREACH MODELING TECHNOLOGY. Louisiana State University, Boston Rouge, U.S.A. |
| [13] | Soil Conservation Service (SCS). (1981). Simplified dam-breach routing procedure. Technical Release No. 66 (Rev. 1), December, 39 p. |
| [14] | U.S. Army, C. (April 2015). National Inventory of Dams. Von National Inventory of Dams: http://nid.usace.army.mil/ abgerufen |
| [15] | Von Thun, J. L. (1990). Guidance on breach parameters. Internal Memorandum Rep. Prepared for U.S. Dept. of the interior: Bureau of Reclamation, Denver. |
| [16] | Wan, C. F., and Fell, R. (2004). Investigation of rate of erosion of soils in embankment dams. J. Geotech. Geoenviron. Eng., 130(4), 373–380. |
| [17] | Xu, Y., and Zhang, L. M. (2009). Breaching Parameters for Earth and Rockfill Dams. ASCE, 135(9), 1957-1970 |
| [18] | K. Abdulrahman. (2014). Case Study of the Chaq-Chaq Dam Failure: Parameter Estimation and Evaluation of Dam Breach Prediction Models. Int. Journal of Engineering Research and Applications, 109-116. |
| [19] | Froehlich, D. C. (1995). “Peak outflow from breached embankment dam.” J. Water Resour. Plann. Manage, 121(1), 90-97. |
 Abstract
 Reference
 Full-Text PDF
 Full-text HTML