-
Paper Information
- Previous Paper
- Paper Submission
-
Journal Information
- About This Journal
- Editorial Board
- Current Issue
- Archive
- Author Guidelines
- Contact Us
International Journal of Hydraulic Engineering
p-ISSN: 2169-9771 e-ISSN: 2169-9801
2015; 4(2): 31-36
doi:10.5923/j.ijhe.20150402.02
Hydraulic Transients in Service Lines
 Abstract
 Reference
 Full-Text PDF
 Full-text HTML
Juneseok Lee
Department of Civil and Environmental Engineering, San José State University, San Jose, California, USA
Correspondence to: Juneseok Lee , Department of Civil and Environmental Engineering, San José State University, San Jose, California, USA.
| Email: |  |
Copyright © 2015 Scientific & Academic Publishing. All Rights Reserved.
The major objectives of this research were to: (i) observe pressure variations at the T-junctions in service lines, (ii) compare the hydraulic transients’ characteristics with and without a leak. To accomplish objectives (i) and (ii), an instrumented PVC piping network was built to represent real service lines and used to demonstrate that leaks attenuate the transient pressure peak values compared to no leak situations. At the T-junction there was no marked difference in steady state pressure values for different locations, but for unsteady states some differences were observed that appeared to depend on the geometry. In addition, numerical methods were applied and compared with experimental outcomes. The results of this study shed new light on the precise relationships between hydraulic transients and water leaks.
Keywords: Service lines, WAter hammer and water leaks
Cite this paper: Juneseok Lee , Hydraulic Transients in Service Lines, International Journal of Hydraulic Engineering, Vol. 4 No. 2, 2015, pp. 31-36. doi: 10.5923/j.ijhe.20150402.02.
Article Outline
1. Introduction
- Executive Order 13010, signed by President Bill Clinton on 15 July 1996, designated water distribution systems as one of 8 critical national infrastructures, signifying that their incapacity or destruction would have a major adverse impact on the security of the nation and its citizens. This highlights the importance of our drinking water distribution systems, which bear serious operational and managerial responsibilities for public health [1]. Recently, however, American Society of Civil Engineers (ASCE) assigned a grade of D to the United States’ water infrastructure [2] and the American Water Works Association (AWWA) has estimated that approximately $325 billion needs to be spent on upgrading water systems in the United States over the next 20 years [3]. Leakage rates, where water is lost while being transported from treatment plants to premise plumbing, in drinking water systems can be as high as 32% in some utilities [4]. AWWA estimated that 6 billion gallons of treated water are disappearing while being transported [3]. Pumping stations devote up to 90% of the total energy expended in water supply and treatment systems to providing appropriate pressure for delivering treated drinking water through pipelines. Consequently, water leakages also waste significant amounts of energy and associated carbon footprints. Service lines connect municipal water pipes to the plumbing systems within residential units. Generally, the water service line, which is the property owner’s responsibility, begins at the curb stop and only the systems running from the main to the curb stop are maintained by the utility company. Lee [1] compiled detailed information on the characteristics of these service lines. Research into major leak sources has revealed that large water losses can occur on the customer service lines branching from the water main, and these can originate in the service lines, fittings, and connections to households [3, 5]. Leaky service lines are expensive in terms of both lost water and the associated energy consumption. Colombo and Karney [6] presented an analysis of leakage vs. energy consumption and concluded that the energy consumption increases the further downstream the leak is located, which emphasizes the importance of service line managements. A water system with its myriad of appurtenances (including pumps, valves, and tanks) is known to be susceptible to hydraulic transients, resulting in a succession of high and low pressure waves passing through the network [7]. The most common causes of this phenomenon are i) rapid closing of valves and ii) pump on/off events. Lee et al. [7] concluded that poor physical condition of the service lines and lowered hydraulic integrity at the water mains can both result in serious public health risks due to possible contamination intrusion through leaking sections. More importantly, homeowners are seldom aware of issues such as health effects and the taste and odor of water that are related to defects in the piping systems within their property lines [8]. It is clear that developing a better understanding of the need for good management of service lines will improve the quality of operational and managerial processes and thus, ultimately, benefit public welfare. The major questions that drove this research are: Why are service lines showing an increase in the number of leaks reported? Can hydraulic transients be responsible for the frequent failures in service lines? To help answer these questions, an experimental piping system was designed, built and tested in the lab to simulate real-world systems. The specific objectives of this paper are to: (i) observe pressure variations at T-junctions in the service line (in particular where the water main and service line meet) for both steady and transient flow as a function of valve positions and sudden valve closing/ opening; and (ii) compare the hydraulic transient characteristics with and without a leak in the service lines. In addition, the experimental hydraulic transients results reported by Lee et al. [7] were compared using various numerical schemes. The results of this study will help to identify the physical parameters that may be responsible for service line failures and characterize the relationship between transients and water leaks. The information gained regarding the impact of transients on water line integrity will provide major support for those seeking to develop best practice and maintenance strategies for the future.
2. Methods
2.1. Experiments
- To accomplish objectives (i) and (ii), an instrumented PVC piping network was built to represent real service lines. The layout is shown in Figure 1. The equipment was selected based on its similarity to actual drinking water systems in terms of layout, generated pressures, and velocities. Highly sensitive sensors were installed to observe the spatial and temporal variation of the flow patterns. The basic design of the system reproduces the 7.62 cm (3”) water main, service lines, and plumbing systems typically found in a house in the U.S. (Figure 1). To accomplish this, a 3.81 cm (1½”) line is tied into the water main, which then branches off into 1.91 cm (¾”) and finally 1.27 cm (½”) pipes for distribution to various fixtures within the house. The water in the system is then re-circulated through a storage tank in the basement.
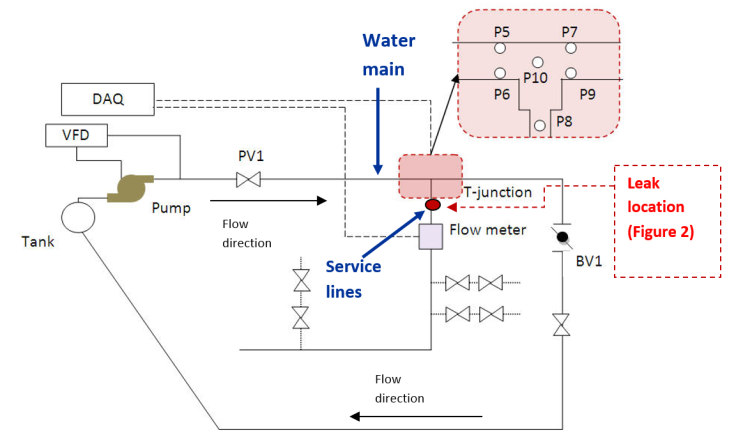 | Figure 1. Layout of the experimental test system |
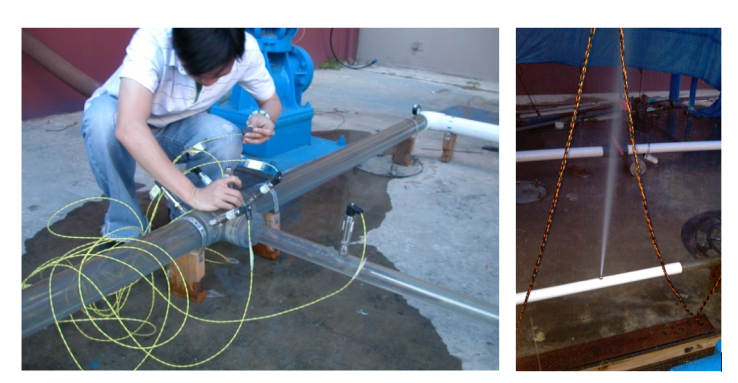 | Figure 2. Pressure Transducers at the T-junction and the Experimental Water Leak |
2.2. Numerical Models
- The gas in a liquid can take two forms: dissolved and free. The dissolved gas is effectively invisible in the liquid and does not noticeably increase either its volume or its compressibility, but free gas (or entrained gas) is dispersed throughout the liquid as bubbles, which can make the liquid appear turbid. Liquid that has not been completely degassed will usually contain some entrained air in the form of microscopic or sub-microscopic bubbles, either in the bulk of the liquid, around a solid contaminant (or nucleation site), or close to the container wall. According to Wallis [9], free gas in liquids is most commonly modelled using homogeneous, separated, or drift flux models. For a two phase or two component mixture/one dimensional flow model, six equations are required to represent the conservation of mass, momentum, and energy of each phase. To describe the interactions between each phase, additional formulations are required. One or more conservation equations must also be formulated for the mixture as a whole in addition to those for the individual phases, so simplified governing equations must be established. Drift flux considers only the velocity difference between the two phases, while separated models include all of the equations mentioned above. If there is no significant difference in the velocities of the two phases, homogeneous models can safely be applied to bubbly mixture models; in homogeneous models, the two components are treated as a single pseudo-fluid with averaged fluid properties. In the preliminary phase of this study, continuity and momentum equations were proposed for a two phase mixture having a low void fraction and insignificant slip. Several assumptions were made when using Equations (1) and (2) below: 1) the fluid mixture is homogenous, bubbly, and two-component in nature; 2) the difference in pressure across a bubble surface can be neglected; and 3) there is no momentum exchange between each phase and hence no slip between phases.
 | (1) |
 | (2) |
 | (3) |
 | (4) |
 | (5) |
3. Results and Discussion
3.1. Experimental Results
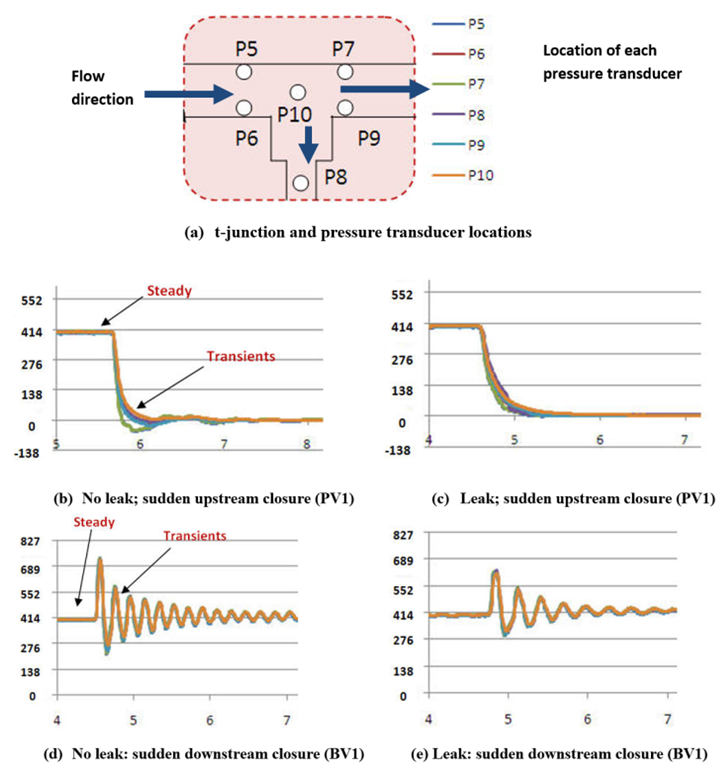
- As mentioned in the Methods, 6 pressure transducers were installed at the T-junction to study the pressure variations across different locations in and around the junction (Figures 3 (a)). Under steady state conditions, minimal differences in the pressures measured by the transducers were observed (Figures 3(b)-3(e)). However, during a transient event there was some variation depending on the location of the pressure transducers (Figures 3(b)-3(e)). When there was no leak present (corresponding to a flow of 303 LPM and 414 kPa in the main), a sudden valve closure of PV1 (Figure 3: upstream of the T-junction; time of closure tc = near to zero) caused the pressure to drop below 0 kPa (Figure 3(b)). Note that the effect of the hydraulic transients tends to diminish with lengthening valve closure time (tc) and subsequent cycles will have steadily smaller amplitudes. When there is a leak (a 20.6 LPM discharge through the leak), the sudden closure of valve PV1 and the corresponding pressure variations at the T-junction are shown in Figure 3(c). It is noticeable that there is no negative pressure experienced here and the pressure variations are relatively smoother. A sudden valve closure downstream of the T-junction (BV1 in Figure 1) caused a pressure increase followed by lower pressure right across the T-junction until all the energy had been dissipated (Figure 3(d)). The amplitudes of the peak pressures decreased with increasing closing time (tc). The corresponding pressure variations at the T-junction for a leak of 20.6 LPM are shown in Figure 3(e). Here, there is around a 138 kPa pressure difference due to the leak and once again, the pressure at the T-junction peaked at a lower level.
 | Figure 3. Results (leak vs. no leak) - (y-axis: pressure in kPa; x-axis: time in seconds) |
3.2. Numerical Results
- When the valve was suddenly closed to simulate closing an upstream water mains valve, the lowest observed pressure in the service line is -69 kPa [7]. Only the first peak is guaranteed to be truly dynamic in nature; the second and all subsequent peaks are residual wave actions that the sensor tracks as the system settles back into a steady state [13]. Time step is 0.001 sec and wave speed is measured to be 61 m/sec. Major section of the pipes are made of clear plastic pipe (for visualization purposes) [7], which has significant impacts on the wave speed values. Darcy-Weisbach friction factor is calibrated to be 0.1. The numerical results of the simulation are presented in Figure 4. All three methods predicted similar behaviour, including the lowest pressure values, and were in good agreement with the observed values reported by Lee et al. [7].
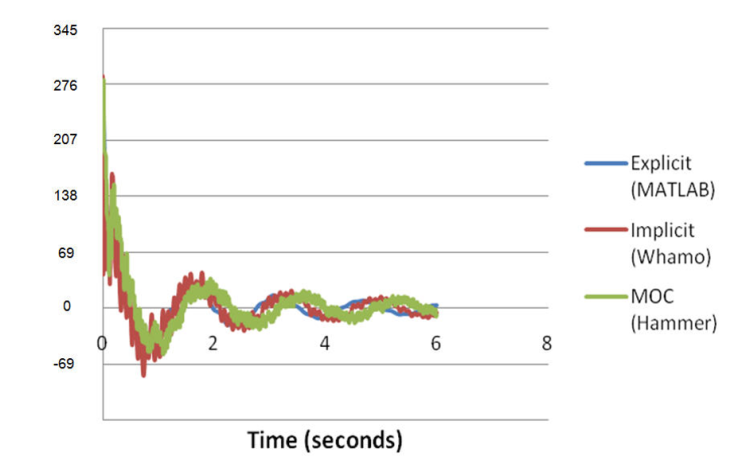 | Figure 4. Numerical Results (y-axis: Pressure in kPa) |
4. Conclusions
- The pressure variations experienced in service lines corresponding to typical street level pressures encountered in a real-world water supply system are addressed in this paper. Major findings of this research are as follows: 1. Steady and unsteady conditions in service lines were investigated with and without a leak. Water leaks demonstrably attenuated peak transient pressure values compared to those measured with no leak present. 2. Across the T-junction, there was no marked difference in steady state pressure values for different locations, but in the unsteady state there was some degree of variation observed due to geometries, which will bear further in-depth examination. In addition, single liquid water hammer equations were solved using MOC, implicit and explicit finite difference approaches. The results obtained showed a reasonably good agreement with previous experimental measurements [7]. This study provides a foundation for future work to derive the specific relationships between water leaks and transient peaks, precisely how energy losses depend on the leak shape and location, and the effect of different pipe materials. A better fundamental knowledge of the various physical parameters (including the pressures, velocities, and hydraulic transients associated with leaks) will improve the efficiency and best practice management of drinking water distribution applications.
ACKNOWLEDGEMENTS
- This study was conducted with the help of generous funding from the Charles Davidson College of Engineering within San José State University. The author also appreciates the assistance rendered by Mr. Phong Doan, Mr. Abdullah Fayyaz and Mr. Carl Crizer in setting up and running the hydraulic transients experiment.