-
Paper Information
- Next Paper
- Paper Submission
-
Journal Information
- About This Journal
- Editorial Board
- Current Issue
- Archive
- Author Guidelines
- Contact Us
International Journal of Hydraulic Engineering
p-ISSN: 2169-9771 e-ISSN: 2169-9801
2015; 4(2): 23-30
doi:10.5923/j.ijhe.20150402.01
Sediment Exclusion from Water Systems Using a Coanda Effect Device
 Abstract
 Reference
 Full-Text PDF
 Full-text HTML
Don May
Department of Physics and Engineering, Fort Lewis College, Durango, Colorado, USA
Correspondence to: Don May , Department of Physics and Engineering, Fort Lewis College, Durango, Colorado, USA.
| Email: |  |
Copyright © 2015 Scientific & Academic Publishing. All Rights Reserved.
The efficacy of a Coanda effect screen at removing sediment from the intake of small water systems was investigated using laboratory studies. The impact of system hydraulics on both clean water and sediment laden flows was explored. In clean water flow, wire spacing is not a critical parameter but in sediment laden flows, wire spacing has a significant effect on clogging and must be considered along with the wire tilt angle. The quantity of flow through a screen and the ability to exclude sediment are inversely related. Sediment removal rates varied from 43% to 81% and through-flow reduction due to clogging was as high as 55%, depending on screen geometry. A field prototype was implemented with particular focus on using realistic constraints found in developing world communities.
Keywords: Coanda effect screens, Wedge wire, Sediment exclusion, Water system intake, Hydraulic performance, Developing world
Cite this paper: Don May , Sediment Exclusion from Water Systems Using a Coanda Effect Device, International Journal of Hydraulic Engineering, Vol. 4 No. 2, 2015, pp. 23-30. doi: 10.5923/j.ijhe.20150402.01.
Article Outline
1. Introduction
- According to the United Nations (UN, 2014) 46% of the world’s population live in rural areas. While there is a consistent trend toward urban migration, the rural poor is still the demographic most likely to not have access to potable water. Small gravity fed water systems relying on surface water sources are common in the developing world and high sediment loads can compromise their effectiveness. In monsoonal regions, especially in areas where deforestation has exacerbated the problem of watershed erosion, it is not uncommon for the peak flow, and thus the sediment load, during the rainy season to exceed the average annual flow by several times or even an order of magnitude. For example, the Mekong, a large river in Southeast Asia, has a typical peak annual flow at Luang Prabang, Laos, of around 12,000 cumecs (cubic meters per second) and a long term mean annual flow of approximately 3500 cumecs resulting in a peak to average flow ratio of 3.4 (Mekong River Commission, 2009). In 1978, the peak was about 77,000 cumecs giving a ratio of 22. This ratio is even more pronounced in smaller basins. In their study on the ratio of peak to average daily discharges, Ellis and Gray (1966) found that the instantaneous peak to average daily flow ratio decreased exponentially as the basin area increased. Sediment in water systems reduces water quality and degrades the physical system. Water treatment plants and distribution systems are particularly susceptible (UNESCO 2011). These factors are especially challenging in developing world communities where basic infrastructure and financial resources are limited. The reality of sediment related problems in water systems is broadly acknowledged by water management professionals and efforts have been made to develop intake designs that reduce the sediment load. Raudkivi, (1993) proposes several alternative designs for small intake structures. He points out that countless structures have been constructed to provide water to communities all around the world and although these systems are small, the cumulative cost is significant. This paper reports on the development and testing of a novel device to exclude sediment from small water systems using a Coanda effect screen. Consideration of realistic constraints commonly found in the developing world is a key objective.The Coanda effect is named after Henri Coanda (1886-1972), a Romanian inventor and early aerodynamicist who observed that a fluid jet will tend to follow the contour of a solid surface (Circiu, not dated). Coanda effect screens (also called wedge wire screens) are used in the food processing industry and as fish and trash screens for hydropower intakes. Hosseini (2011) describes a project where Coanda effect screens were used to remove debris from a large flood control structure. A simple numerical model and a physical model were successfully employed to determine design parameters and flow detailing for design and setup of the screens. No research has been found that attempts to study the utility of these screens for sediment exclusion from water supply intake systems.
2. Coanda Screen Structure
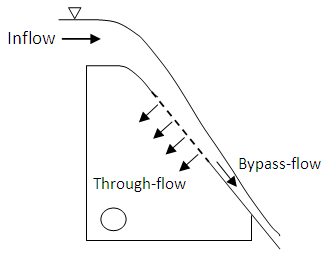
- Screens (Fig.1) are typically installed in an overflow weir. The accelerator plate, space below the crest and above the screen, is used to assure an appropriate velocity over the screen (Fig. 2). Through-flow passes through the screen and is captured in a collection box where it is routed into a discharge pipe. Excluded sediment passes over the screen and is carried downstream by the bypass-flow. As a result the screen is self-cleaning.
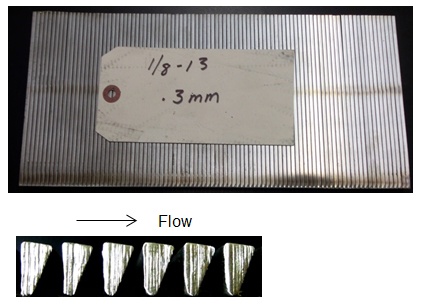 | Figure 1. Photographs of a typical Coanda effect screen in plan and longitudinal section views. This particular screen has a wire width of 3.2mm (1/8 inch), a wire tilt angle of 13° and a wire spacing of 0.3mm. The screen has dimensions of approximately 30cm x 20cm |
 | Figure 2. A typical installation has the Coanda effect screen installed on the face of an overflow weir. Through-flow passes into a collection box and a discharge pipe routs the water downstream |
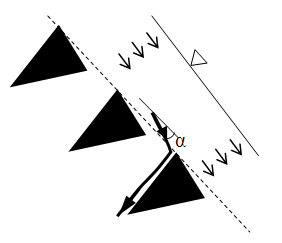
 | Figure 3. A thin layer of water is sheared off by the leading edge of each wire. The angle of attack α is the critical parameter for determining through-flow |
3. Laboratory Models
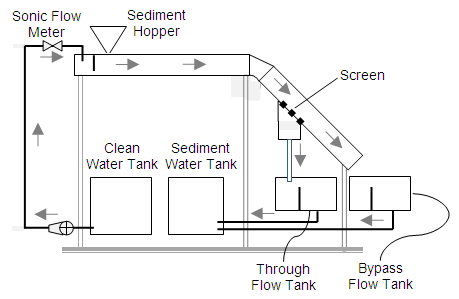
- A series of laboratory tests were completed to assess the efficacy of the Coanda effect screen in removing sediment. Initially, the clean water hydraulics were validated with the apparatus shown in Fig. 4. The flume has a nearly horizontal approach section and a test section set at a slope of 45°. Screens were inserted into an opening in the flume bed. Water was circulated from a tank through the flume and into either the through-flow or bypass-flow tanks before returning to the recirculation tank. For all tests the flow rate was measured with a sonic flow meter just before the flow entered the flume. Calibrated v-notched weirs were used to measure the through-flow and bypass-flow in their respective tanks. The system was operated with continuous flow.
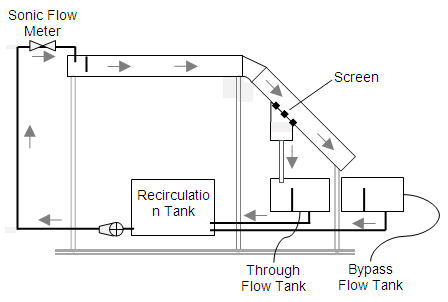 | Figure 4. Schematic diagram of the laboratory apparatus in continuous flow mode |
3.1. Geometry of Coanda Effect Screens
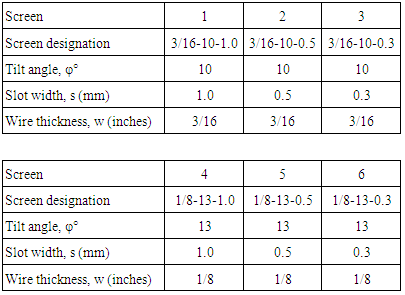
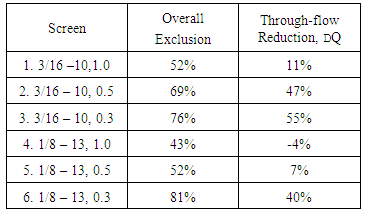
- The wire tilt angle φ, face angle λ, slot width s and wire width w characterize the screen geometry and are defined in Fig. 5 and summarized for six screens in Table 1. The mixed units used by the manufacture to designate the screen are maintained here. For example the 1/8–13-0.3 screen shown in Figure 1 refers to a 1/8” wire width, 13° tilt angle and 0.3mm slot width.
|
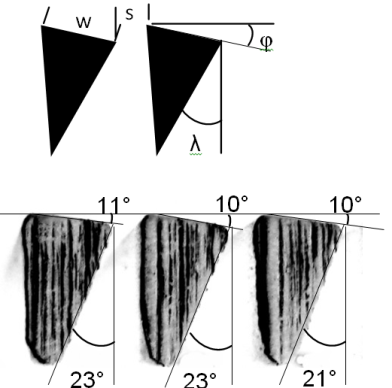 | Figure 5. Geometric parameters are defined in the idealized top view and confirmation of angles from photographic measurements are shown in the bottom view |
3.2. Clean Water Tests
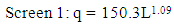
- Clean water tests were run to verify the hydraulic performance. Using the laboratory apparatus (Fig 4), screens were inserted into the device and runs were made varying the inflow from 0 to about 1.26 L/s (20gpm). This is the typical range of design flows for small rural water systems in the developing world. As expected, flow through a screen is a function of the wetted length of screen that is producing flow. Other factors, including angle of attack, wire spacing and tilt angle were studied by Wahl (2003, 2013). He found that the unit discharge was proportional to the wetted length raised to the 1.24 power (L1.24). For screens 1, 2 and 3 the comparable relationships from this study are,
 | (1) |
 | (2) |
 | (3) |
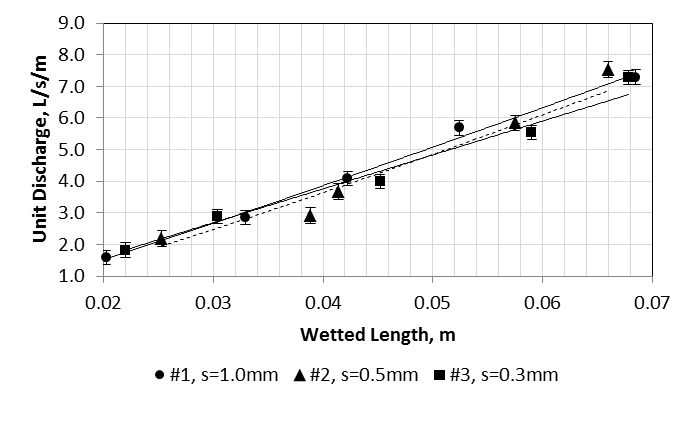 | Figure 6. Screen 1 produces a typical relationship between through-flow and wetted screen length |
3.3. Water and Sediment Tests
- In small upland watersheds, the sediment particle size distribution and concentration varies with the local geology, hydrology, topography and land use. A sediment sample collected from a small stream in northern Nicaragua was used as a model for the particle size distribution (Fig. 7) in this study. The particles in this sample fall within the sand size range (0.0625mm to 2mm) and although smaller particles, responsible for increased turbidity, are most likely present during storm flows, they generally do not degrade the physical system and cannot be removed with Coanda effect screens. Because the Nicaragua sample included bed load, the distribution is skewed toward the larger sizes. The design mix was adjusted by increasing the fraction of smaller particles resulting in a more realistic distribution. Sediment concentration in rivers and streams vary widely. Specific data on small streams in monsoonal regions is not available, but to get a sense of the possible range of concentrations consider that the flow weighted suspended sediment/sand concentration for 16 USGS gaging stations on the Mississippi River and its tributaries ranged from 137 mg/L to 29,900 mg/L (pre-1953) and 61.6 mg/L to 11,100 mg/L (post-1967). By 1967, most of the larger channelization projects and land-conservation practices implemented on the Mississippi River were in place resulting in the reduced sediment load (Heimann 2011). The Yellow River in China at the Sanmenxia station has one of the world’s highest recorded sediment concentrations; the long term annual average concentration is 35,000 mg/L (Wu 2004).
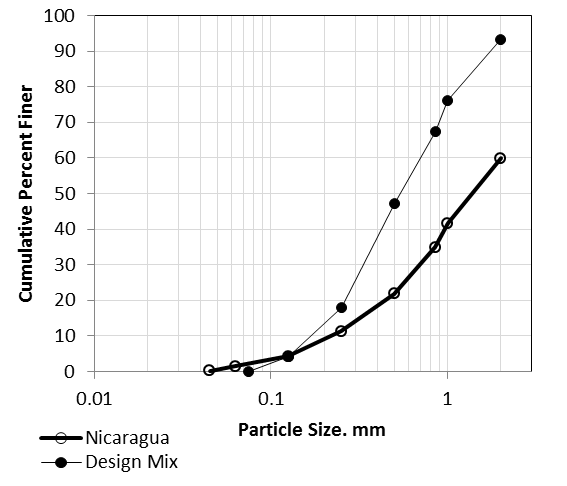 | Figure 7. Sediment particle size distributions for a typical sample from Nicaragua and the design sediment mix used for testing |
 | Figure 8. Schematic diagram of the laboratory apparatus in batch flow mode |
4. Results
- With time the space between individual wires tends to clog with sediment reducing the total flow through the screen. This is a function of the screen geometry. The 3/16-10 and 1/8-13 screens with 1.0 mm wire spacing and the 1/8-13 with a 0.5 mm spacing did a good job of self-cleaning, reaching a flow equilibrium by the end of the 10 minute batch run and maintaining a relatively high flow rate with reductions of up to 11% (Fig.9). The other screens had poorer performance exhibiting a greater reduced flow (40% - 55%) or not reaching flow equilibrium.
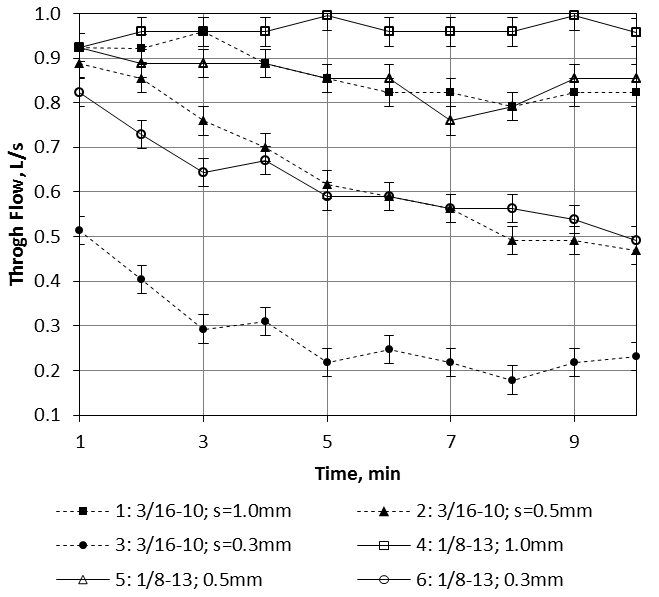 | Figure 9. Flow through Coanda effect screens as a function of time with sediment laden water |
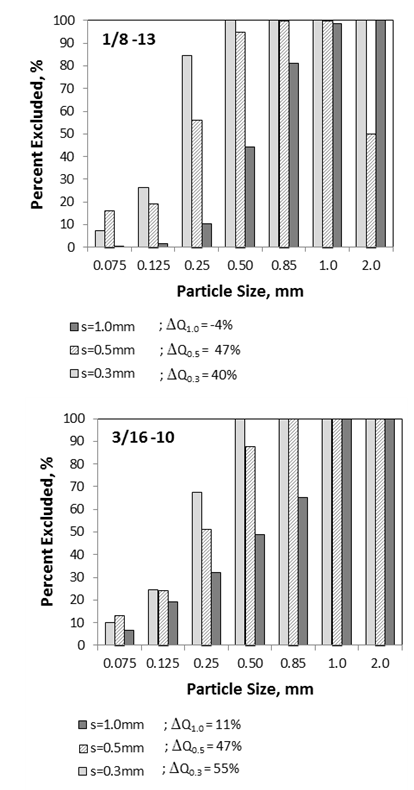 | Figure 10. Percent of sediment removed for each particle size interval |
|
4.1. Field Prototype
- A field prototype (Fig 11.) was designed and constructed using realistic constraints commonly found in rural, developing world communities. While the laboratory model confirmed performance, the purpose of the field prototype was to assess the feasibility of implementing a Coanda effect screen structure in the field. The prototype was constructed on an irrigation ditch fed from a small river with a sediment concentration much less than that used in the laboratory tests. The structure has the same fundamental shape, size and flow capacity as the laboratory model and thus it is reasonable to assume that the hydraulic performance of the field prototype would be similar to the laboratory model.
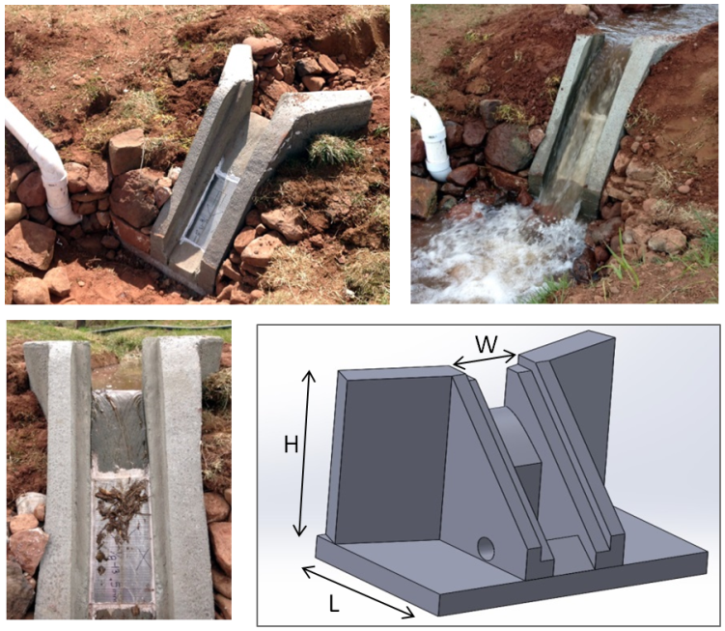 | Figure 11. Field prototype of a Coanda screen, sediment exclusion structure where H=66cm, L=66cm and W=15cm. The bottom-left photo shows debris on the screen. This debris will eventually be removed by the by-pass flow |
5. Conclusions
- The hydraulic performance of the screens during clean water runs closely matched that found by Wahl. During sediment laden tests, screens 1, 4 and 5 met the target flow rate of 0.882 L/s (14gpm) (Table 1). The 1.0mm (1/8-13) screen 4 significantly out-performed the 1.0 mm (3/16-10) screen 1 exceeding the through-flow capacity by nearly 12% with an uncertainty that represents 4% of the flow. While it was not possible to isolate whether the difference in performance was due to the variation in the wire width, w, or the tilt angle, φ, the results were consistent across all three wire spacings. Uniformly, the combination of larger tilt angle and smaller wire width resulted in a larger through-flow with sediment laden water. Based on geometry, the author believes that the tilt angle is the more important of the two parameters. For illustrative purposes the schematic diagram (Fig. 12) shows an exaggerated progression of increasing φ from zero in frame-a to a large value in frame-c. As φ increases the thickness of the sheared flow layer increases (shaded area below the horizontal line) improving flow performance but also adversely resulting in a narrower constriction between wires where sediment can become trapped. Finding the optimum wire tilt angle is a balance between increasing flow and reducing sediment clogging. This behavior was confirmed in the sediment runs (Fig. 9) where the screens with the 13° tilt angle out performed (higher through-flow) those with φ=10°.
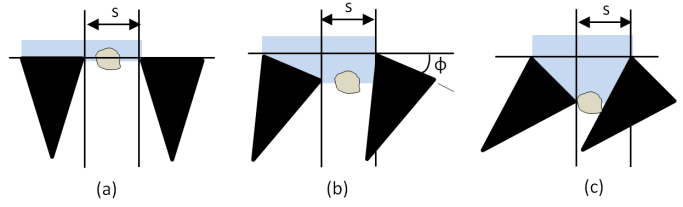 | Figure 12. As the wire tilt angle, φ, increases the through-flow increases but the tendency to trap sediment on the screen also increases |
6. Recommendations
- While the results are encouraging, more testing is needed to develop usable design guidelines. The relative importance of the screen geometric properties and more elaborate quantification of system performance over a wider range of operating parameters is needed. Though the relationship between unit discharge and wetted length of the screen (Fig. 6) can be used to make an initial estimate of the length of screen needed for a specific application, this relationship should be further developed using sediment laden flow and possibly varying width screens. Ultimately, relationships that could be used to provide systematic design of Coanda effects screens for sediment exclusion are needed.
ACKNOWLEDGEMENTS
- This work was completed as a senior design project in the engineering program at Fort Lewis College by Justin Boren, Aaron Somogyi, Megan Chambellan and Benson Taziwa. My sincere thanks to this group of students for their work on the project. Thanks to Tony Wahl for providing valuable input. Screens for this study were graciously provided by Norris Screens and Manufacturing Inc., a part of the Elgin Equipment Group, Tazewell, Virginia and Hydroscreens CO. LLC, Denver, Colorado. Lastly, partial funding was provided by a grant from the Dean’s undergraduate research program at Fort Lewis College.
References
| [1] | Circiu, I., and Dinea, S. (undated), “Review of applications on Coanda effect, history, theories, new trends, Henri Coanda 100 - celebrating 100 years from the first jet flight”, Article. |
| [2] | Ellis, W.H., and Gray, D.M., (1966), “Interrelationships between the peak instantaneous and average daily discharges of small prairie streams”, Canadian Agricultural Engineering. |
| [3] | Heimann, D.C., Sprague, L.A., and Blevins, D.W. (2011), “Trends in suspended-sediment loads and concentrations in the Mississippi River basin 1950-2009”, National Water-Quality Assessment Program, Scientific Investigations Report 2001-5200, U.S. Geological Survey. |
| [4] | Hosseini, M. and Coonrod, J. (2011), “Coupling numerical and physical modeling for analysis of flow in a diversion structure with Coanda-effect screens”, Water,3, 746-786, doi: 10.3390/3030764. |
| [5] | Kamanbedast, A. A., Masjedi, A. and Assareh, A., “Investigation of hydraulics of flow in bottom intake structures by software modeling”, J. of Food, Agriculture and Environment, Vol. 10(2), April 2012. |
| [6] | Mekong River Commission (2009), “The flow of the Mekong, MRC management information booklet”, series, No. 2. November 2009. |
| [7] | Nasser, M. S., Venkataraman, P., and Ramamurthy, A. S. (1980). ‘‘Flow in a channel with a slot in the bed.’’ J. Hydr. Res., Delft, The Netherlands, 18(4), 359–367. |
| [8] | Ramamurthy, A. S., Zhu, W., and Carballada, B. L. (1994). ‘‘Flow past a two-dimensional lateral slot.’’ J. Envir. Engrg., ASCE, 120(6), 1632–1638. |
| [9] | Raudkivi, A., (1993), “Sedimentation – exclusion and removal of sediment from diverted water”, IAHR-AIRH Hydraulic Structures Design Manual, published by A.A. Balkema, Rotterdam Netherlands. |
| [10] | UNESCO, (2011), Sediment Issues & Sediment Management in Large River Basins, Interim Case Study Synthesis Report, International Sediment Initiative, Beijing & IRTCES. |
| [11] | United Nations (2014), United Nations World’s population increasingly urban with more than half living in urban areas, 10 July 2014, New York, prospects-2014.html. |
| [12] | USBR, (2015), Coanda-Effect Screen Software,http://www.usbr.gov/tsc/hydlab/twahl/coanda/coandadownload.html. |
| [13] | Venkataraman, P. (1977), ‘‘Divided flow in channels with bottom openings.’’ J. Hydr. Div., ASCE, 103(2), 1900–1904. |
| [14] | Wahl, T.L. (2001), “Hydraulic performance of Coanda-effect screens”, J. of Hydraulic Engineering, ASCE, 480-488. |
| [15] | Wahl, T.L. (2003), “Design guidance for Coanda-effect screens”, R-03003, U.S. Department of Interior, Bureau of Reclamation. |
| [16] | Wahl, T.L., Weir, R.K., Cerise, J.K., Sauer, B., and Wergin, J. (2004), “Labor Saving Debris and Fish Screens”, Water O&M Bulletin, Vol 208, June 2004, USBR. |
| [17] | Wahl, T.L. (2013), “New testing of Coanda-effect screen capacity”, HydroVision International. |
| [18] | Wu, B.S., and Wang, Z.Y. (2004), “Impacts of Sanmenxia Dam and management strategies”, Hydraulics and Dams River Structures – Yazdandoost and Attari(eds) Taylor and Francis Group, London. |