Kaveh Ostad-Ali-Askari 1, Mohammad Shayannejad 2
1PhD Student, Department of Water Engineering, Faculty of Civil Engineering, Najafabad Branch, Islamic Azad University, Najafabad, Iran
2Associate Professor, Water Engineering Department, Isfahan University of Technology, Isfahan Province, Iran
Correspondence to: Kaveh Ostad-Ali-Askari , PhD Student, Department of Water Engineering, Faculty of Civil Engineering, Najafabad Branch, Islamic Azad University, Najafabad, Iran.
| Email: |  |
Copyright © 2015 Scientific & Academic Publishing. All Rights Reserved.
This work is licensed under the Creative Commons Attribution International License (CC BY).
http://creativecommons.org/licenses/by/4.0/

Abstract
Infiltration is one of the most important factors of hydrology cycle. Deep percolation is the flowing of soil water by gravity below the effective depth of the root zone, that is an important factor in filling of groundwater and design of subsurface drainage. Deep percolation can be determined by taking field data to estimate soil water depletion using water balance equation. This method is very expensive and time consuming. The goal of this research was to quantify deep percolation due to irrigation with using a mathematical model. The input variables of this model are the effective parameters on deep percolation such as, bed slope, inflow rate and coefficients of soil infiltration. These variables were measured at 16 farms in Zayandehrood basin. Comparison between estimated and measured deep percolation showed that the model’s error percentage is 1.73%.
Keywords:
Deep percolation, Infiltration, Model, Soil properties
Cite this paper: Kaveh Ostad-Ali-Askari , Mohammad Shayannejad , Presenting a Mathematical Model for Estimating the Deep Percolation Due to Irrigation, International Journal of Hydraulic Engineering, Vol. 4 No. 1, 2015, pp. 17-21. doi: 10.5923/j.ijhe.20150401.03.
1. Introduction
Generally, percolation is one of the components of the hydrology cycle. Water which due to irrigation or rain percolates in pastures or farmlands, divides into two parts. Part of it is preserved in the root region of pasture plants or crops which is used by plants. Another part leaves the root region which is called deep percolation. In other words, deep percolation is the soil water movement by the gravity force below the region of roots. Deep percolation plays a crucial role in studies of artificial nutrition of pastures and catchment basins and designing of drains. Studies indicate that there are two methods available for estimating or measuring the deep percolation:1. The water balance method:In this method percolation is measured through employing the relation p1, and measurement of soil humidity at the root region, evaporation and transpiration and also measurement of rain and irrigation depth.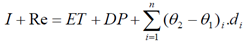 | (1) |
In this equation, I indicates depth of irrigation water percolated into the soil, Re is depth of the percolated rain, ET stands for the evaporation and transpiration depth, DP is depth of the deep percolation water, n is the number of soil layers in which humidity is measured,  and
and  stand for volumetric soil moisture at the beginning and at the end of the period and di is the depth of the soil its layer. Philips et al (1) estimated the deep percolation in an irrigated alfalfa crop in south central Colorado using the water balance and based on publication ASCE NO. 70 (2)2. Method of concurrent measurement of moisture and soil suction at various depths. In this method, first soil moisture and suction at different soil depth is measured and the soil moisture slope is drawn. Then employing the Couric and Millington method, presented by Bouwer and Jackson (3) capillary conduction is estimated. Intensity of deep percolation based on Darcy law, is computed from the product of capillary conduction and suction curve slope between the two specified depths. Stentizer and Gassner (4) employed this method for estimating the deep percolation. Although the above said methods have provided good results however, they are very time consuming and expensive. In this paper, a mathematical model is presented for estimating the deep percolation based in some characteristics of the soil and total water percolated to the soil, and its precision in comparison with the measured rates has been studied.
2. Materials and Methods
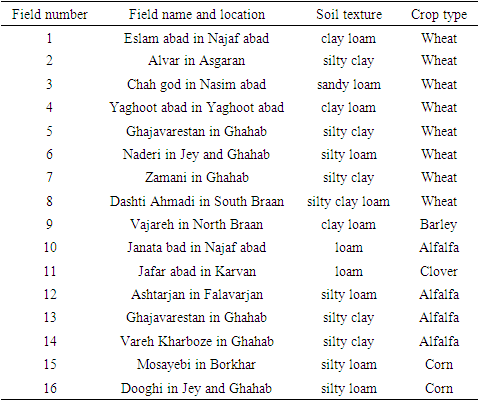
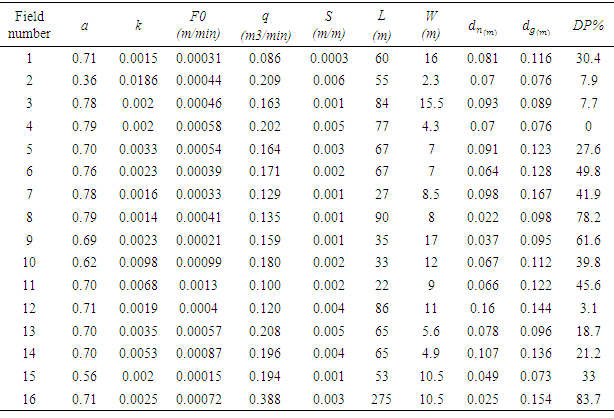
1. Introducing the studied region Field studies relevant to this research have been done in the Morghab sub-basin in the center of Zayandehrood basin. This sub-basin is adjacent to the Zarcheshme sub-basin in the south, Shurdehagham sub-basin in the south west, Gavekhuni sub-basin in the east, Plasjan sub – basin in the west and Khoshkrood and Ardestan sub – basin in the north. Surface area of this basin has been reported to be 1194.8ha, equal to 29% of the Zayandehrood basin. Climate of the Morghab sub-basin according to the Gucene classification includes four areas based on which the Asgaran area is situated in the steppe climate, Tiran and other foothills are located in the slight semi- desert climate and the end of the sub-basin including Roodshetin, Jarquyeh and Mahyar are situated in the desert climate. Water sources of Morghab sub-basin include subsurface sources like source, Qanat and Wells estimated to be about 2.2 billion m3 and surface sources like Morghab River and Zayandehrood of about 1.4m3.Total farmlands have been reported to be 151.529 ha from which 131.602 ha are irrigated, 3139 ha are dry farming and 16788 ha are orchards and nurseries. Common irrigation methods of farmlands include sprinkler irrigation, furrow and flooding irrigation for water cultivation and basin irrigation for orchards. The rate of water consumption in the agriculture sector is reported to be 2.6 billion m3 24% of which is provided from sources of surface waters and the rest is obtained of wells, Qanats and sources.According to the performed agrology studies about 45% of lards are located in 5.2 unit, 10% in the 5.3 unit, 20% in the 4.1 unit, 10% in the 4.2 unit and remainder of the lands with agricultural application are located in 4.3, 4.4, 3.1, 3.2, 8.1, 8.2, and 7 units. Field data collection has been done from the farm which is at present water irrigated and has a medium to heavy soil texture. Study of farming situation in the Morghab area indicate that wheat is considered as dominant autumn culture, rice and corn for summer culture and alfalfa for perennial culture. Thus, regarding the under cultivation surfaces, 9 measurements in the wheat farms, 5 measurements for alfalfa and 2 measurements in the corn farms was performed. Specifications of the farms are presented in table 1.Table 1. Investigated field properties
 |
| |
|
2. Measurement of parameters effective on deep percolation from the 16 above said farms, parameters effective on deep percolation were collected as follows. A. Slope of the farm (s)B. Percolation Coefficients of the lewis-kostiakov equation explained in relation 2: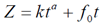 | (2) |
In this equation Z stands for depth of the percolated water,  is velocity of final percolation of soil, according to m/min, t is percolation time in minutes, and k and a are coefficients the percolation equation. Final percolation velocity and percolation coefficients were determined by field tests.C. Depth of the available moisture (depth of the water present in the soil which is easily available for the plant) which is computed from the equation (3);
 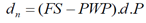 | (3) |
In this equation  stands for available moisture in meter, FC is volumetric percentage of soil moisture in field capacity, PWP is the volumetric percentage of moisture at the permanent willing point, d is root depth in meter, and P is percentage of permissible moisture discharge. FC and PWP values were determined via field tests.D. Irrigation period computed from the relation 4:
 | (4) |
In this relation  indicates irrigation period in minutes,
  stands for depth of water entered to the farm in meter,
  is surface area of the farm in square meter, and
  is the inflow discharge to the farm in m3/min. therefore through inclusion of the irrigation period in the considered mathematical model, its three relevant parameters are included as well which are determined through field measurements. 3. Measurement of deep percolation:In order to measure deep percolation the following stages are performed:- The progress-regress cure is drawn and then, the percolation time respite is computed from the difference of progress and regress time. - Through insertion of percolation time of each point in the relation (2) depth of the percolated water for each point is calculated. - The deep percolation rate at each point is computed from the difference of available moisture and depth of the percolated water at each point. In case the difference result is negative, deep percolation is zero. Therefore, these volumes of the deep percolation water at the distance between two consecutive
  and
and  point is computed according to figure (1) and via the relation (5):
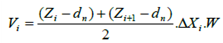 | (5) |
In which,  stands for width of the farm,
  distance between two consecutive points
  and
and  ,
,  depth of the available moisture, and
  and
and  indicate depth of the percolated water in
  and
and  points respectively.Figure 1. percolation situation at two consecutive points. And, finally, percentage of deep percolation is determined employing relation (6).
 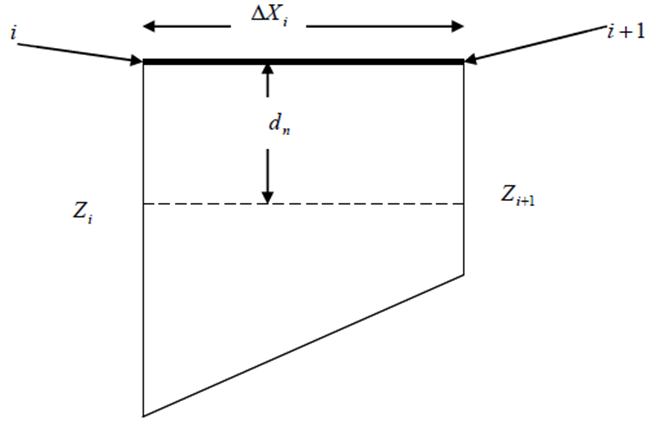 | Figure 1. The penetration situation in two consequent point |
 | (6) |
3. Results
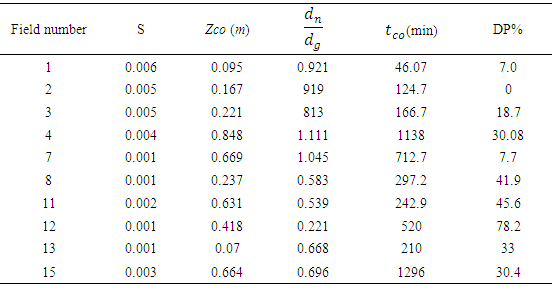
Values of measured parameters for 16 farms are presented in table 2. In this table L stands for length of the farm.Table 2. Measurement summery in investigated field’s properties
 |
| |
|
In order to prepare a mathematical model amongst the parameters effective on percolation, dependent variables were such randomly selected that maximum correlation coefficient and minimum error would be obtained. To do so/even some o the variables were combined. Finally, following final study, the most appropriate dependent variables in the model were selected as follows:1. The farm slope (s)2.  ratio which in cases of full irrigation, this ratio will be the irrigation efficiency. 3. Irrigation period
  through inclusion of which parameter based on relation (4), surface area of the farm and the flow discharge would be considered. 4. Depth of the percolated water during the irrigation period, that by placing
  in relation (2) is obtained as follows:
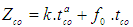 | (7) |
Table 3. Field properties for model preparation
 |
| |
|
Through inclusion of this parameter, percolation coefficients will be taken into account as well.\table (2) summary of measurements in different farms. Amongst information gathered on 16 farms, information on 10 farms were randomly used for preparing the model (according to table 2) and information of 6 farms was used for it confirmation.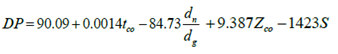 | (8) |
To confirm the model and studding its precision, the root of multiple square error (RMSE) was used as in relation (9):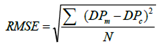 | (9) |
In which  is the measured deep penetration which has been computed using the above said field measurements and relation (6);
  is the deep penetration compute via relation (8) and N is the number of farms. Comparison of measured deep penetration values and computed ones indicated that the model has had a suitable precision in estimating the deep penetration rate. The RMSE in this research is equal to 1.73 and also the computed correlation coefficient is equal to 0.9933 showing appropriate precision of the model in estimating the deep penetration rate. Figure 2 depicts the model's precision in estimating the rate of water penetration depth.
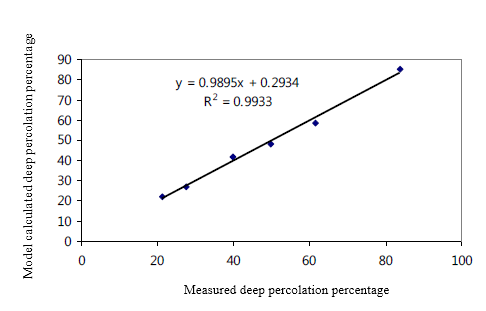 | Figure 2. The comparison between measured and calculated deep percolation |
4. Discussion
Regarding complexity of the penetration process, it is necessary to not that statistical methods are powerful tools for expressing the relationship between the factors influencing the penetration phenomenon which have been considered in investigations of many of the researchers. Included are Mishra et al. (5) who employing the statistical relations, studied the precision of 14 models in estimating penetration in the soils with different textures. Their results, due to different field conditions and employment of different penetration relations cannot be compared with our results. Meanwhile results obtained of the above model has shown that in soils with medium and heavy textures, instead of other time consuming and expensive methods using statistical models achieve results with appropriate precision for estimating the deep percolation rate.
References
| [1] | Philips, R.W. 2007. Measuring deep percolation for an irrigated alfalfa crop in south central Colorado. A proposal project for the degree of master of water resources. University of Newmexico. 62-63. |
| [2] | Evapotranspiration and irrigation water requirement. 2005. ASCE manual and Reports on Engineering Practice, 70. New York. |
| [3] | Bouwer, H & R.D Jackson. 1974. Determinig soil properties. Agronomy series 17, American Society of Agronomy. Madison. Wisconsin. 611-672. |
| [4] | Stentizer, E. & L. Gassner. 2005. In situ estimation of deep percolation in a dry area by concurrent measurements of soil water content and soil water potential. Geophysical Research Abstracts. 7: 16-18. |
| [5] | Mishra, S.K., J.V. Tyagi & V.P. Singh. 2003. Comparison of infiltration models. Hydrol. Process. 17: 2629–2652. |

 Abstract
 Reference
 Full-Text PDF
 Full-text HTML