-
Paper Information
- Next Paper
- Paper Submission
-
Journal Information
- About This Journal
- Editorial Board
- Current Issue
- Archive
- Author Guidelines
- Contact Us
International Journal of Hydraulic Engineering
p-ISSN: 2169-9771 e-ISSN: 2169-9801
2014; 3(3): 77-84
doi:10.5923/j.ijhe.20140303.01
Contribution of Form Friction to Total Friction Factor
 Abstract
 Reference
 Full-Text PDF
 Full-text HTML
Sahar Azareh1, Hossein Afzalimehr1, Mehrdad Poorhosein2, Vijay P. Singh1
1Department of water engineering, Isfahan University of Technology, Isfahan, Iran
2Department of Civil and Environmental Engineering, Texas A&M Univ., College Station, TX
Correspondence to: Hossein Afzalimehr, Department of water engineering, Isfahan University of Technology, Isfahan, Iran.
| Email: |  |
Copyright © 2014 Scientific & Academic Publishing. All Rights Reserved.
This study investigates the contribution of form friction to the total friction factor, using observed data from Babolroud River located in north of Iran and south of the Caspian Sea. Results show that form friction (f) contributes up to 65% of the total friction factor (f) of a gravel-bed river. Most of the equations in the hydraulics literature do not take into account the effect of bed form in the estimation of flow resistance. The results of the study are compared with those of the Keulegan, Charlton, Bray and Griffiths equations. It is found that Bray and Griffith's equations display a reasonable relationship between the form friction and the total friction factor, however, none of the selected equations works well to predict the grain friction. As a result, they cannot be used to estimate the total friction factor or determining the flow capacity of the river.
Keywords: Friction factor, Grain friction, Form friction, Coarse-bed rivers, Bed forms
Cite this paper: Sahar Azareh, Hossein Afzalimehr, Mehrdad Poorhosein, Vijay P. Singh, Contribution of Form Friction to Total Friction Factor, International Journal of Hydraulic Engineering, Vol. 3 No. 3, 2014, pp. 77-84. doi: 10.5923/j.ijhe.20140303.01.
Article Outline
1. Introduction
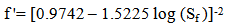
- The estimation of friction factor or resistance coefficient and hence discharge capacity of a river is one of the fundamental problems in river engineering. At present, the accuracy of resistance coefficients for predicting flow characteristics of rivers with vegetated banks remains questionable. A variety of bed forms, especially dunes, exercise a significant influence on the flow resistance. The complexity of bed form sand their interaction with vegetated banks complicates the prediction of flow resistance, especially in coarse-bed rivers. The flow resistance consists of two parts: 1) grain resistance or skin friction which depends on the bed grain size, and 2) form resistance which depends on the bed form geometry and flow depth. Past studies reveal that up to ninety percent of the total channel resistance is due to the form resistance [3, 12], showing the dominant effect of bed forms on flow resistance estimation in coarse-bed rivers. On the other hand, processes, such as incipient motion and sediment transport require determination of resistance to flow [8]. Fedele and Garcia (2001) showed that the resistance to flow in alluvial channels in the presence of bed forms was a nonlinear and non-unique function of shear stress, grain size, and relative flow depth [7]. Yen (2002) surveyed investigations on grain and form friction factors [22]. Review of literature on the division of resistance to flow shows that grain friction, f’, is computed using the Reynolds number and relative roughness (d50/R), where d50 is the median grain size and R is the hydraulic radius as independent variables [16, 4, 1, 17. 18]. van Rijn (1984) expressed the grain friction (f’) as:
 | (1) |
2. Material and Methods
2.1. Study Area
- Babolroud River watershed is located in north of Iran that flows northward from foot or mount Alborz through Babolsar city finally to the Caspian Sea (see Figure 1), The length of river is 111 km and the average slope of the river is 0.74 percent. The basin area is of 1746.42 km², River regimen rain – snow. The bulk of the annual discharge is associated with autumn rainfall. In Babolroud river the maximum and minimum height are 3180 m and -10m. The vegetation cover of the Babolroud watershed shows low density with gravel and cobble along the river bed.
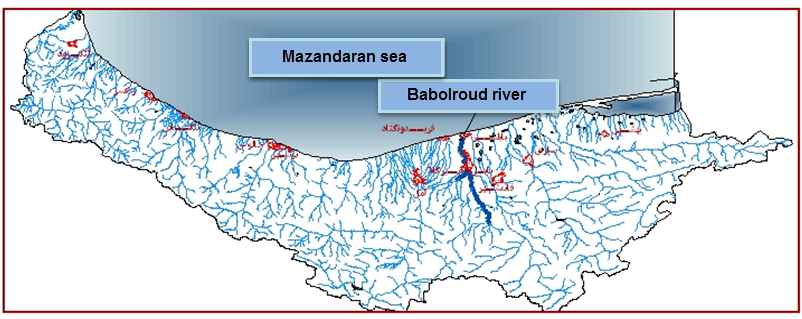 | Figure 1. Caspian Sea basin and Babolroud River |
 North and
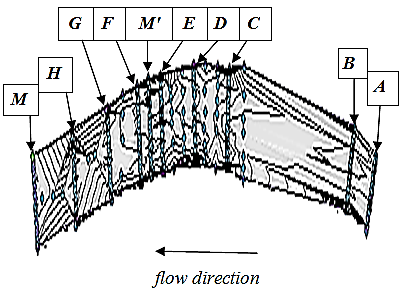
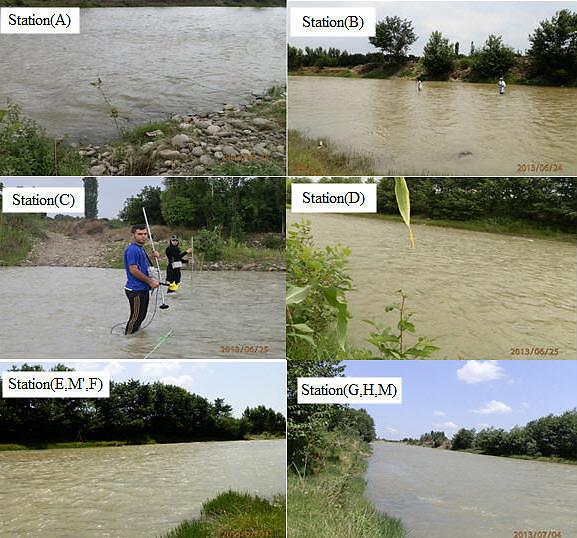
  East and at an altitude of 123 feet from the Sea level (Figure 2). For the selected reach, 10 sections were carefully taken into account with appropriate intervals.The distance between cross sections was about 20 m, however, the cross sections A and B were located at greater distances from other cross sections. Cross sections C to M were selected in a relatively direct path, having an average depth 0.30 m. All of cross sections in the reach except C were covered with vegetated banks of the height 0.35 m. Data collection was conducted in the summer of 2013 during July.(see Figure 3, 4), Intervals or distances between cross sections were analyzed using Arc GIS software (see Figure 3).
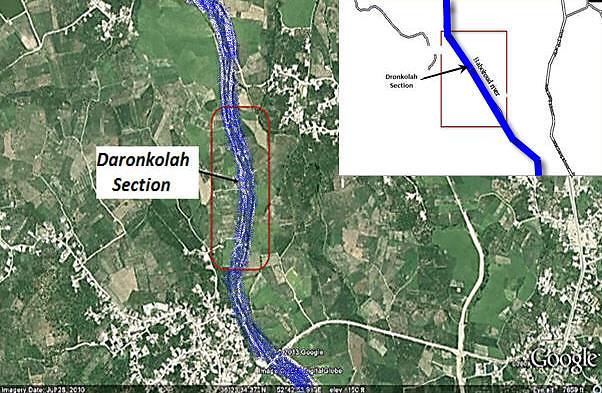 | Figure 2. Presentation of the selected reach (Daronkolah) using Google Earth software |
 | Figure 3. Velocity distributions at a cross section of Babolroud river |
 | Figure 4. Presentation of the selected sections |
2.2. Data Collection and Data Analysis
2.2.1. Velocity Profiles
- At each cross section, five velocity profiles were measured by current-meter made in Vale Port Company in England. The measuring time at each point velocity was 50 seconds. One velocity profile at the central axis of the river, and others were measured near the river banks. Each velocity profile consisted of 14 point velocities from the river bottom to the water surface. Velocities were measured at each point with three repeats and the average of them was taken as the mean velocity for that point in each profile. Figure 5, presents velocity profiles in one of the cross sections at the selected reach of Babolroud River.
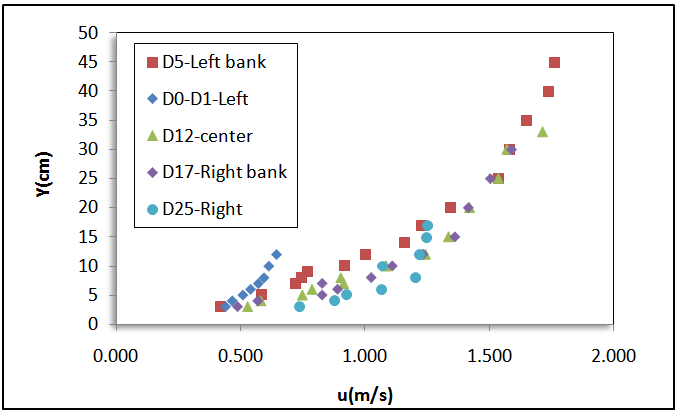 | Figure 5. Velocity distributions in one of sections of Babolroud |
2.2.2. Grain Size
- The median grain size of bed material was determined by the Wolman method [20]. The range of median grain size was from 22.6 mm to 34.6 mm in the selected reach. Figure 6 presents the grain size distribution in the selected section in Babolroud River.
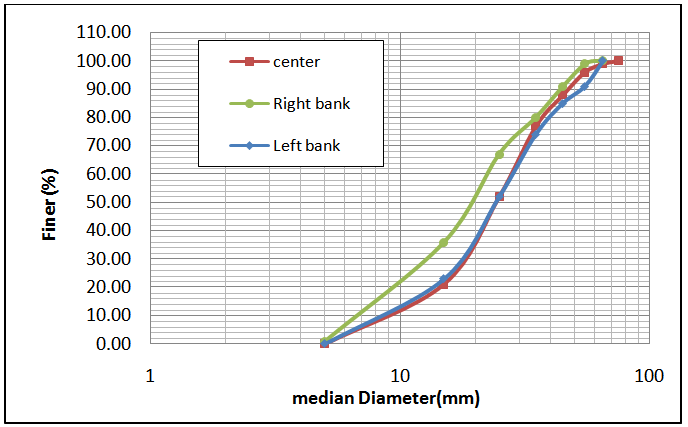 | Figure 6. Grain size distribution of bed material in one of the cross sections |
2.2.3. Survey Data
- To survey the selected reach and to measure the water slope and wetted perimeter, a total station camera was used. The bed form and topographic contours were plotted using surfer software (see Figure 7).
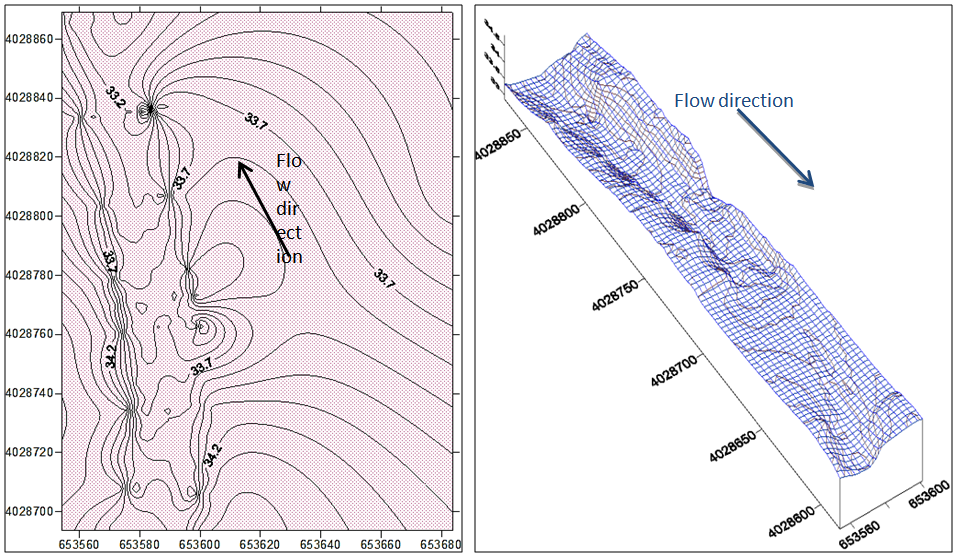 | Figure 7. Presentation of the topographic contours and bed form of the reach |
2.2.4. Shear Velocity
- The shear velocity was estimated by the velocity distribution and the boundary-layer characteristics (BLCM) [2]. as follows:
 | (2) |
 the displacement thickness;
  the momentum thickness; and
  the maximum velocity in each velocity profile; these thicknesses were defined as: [15]
 | (3) |
 | (4) |
 and
and  for predicting friction factor, and their methodology has found considerable support over smooth and rough beds in different engineering projects [23]. After measuring the required data in this study, different parameters such as hydraulic depth, area of cross section, the bed slope, energy slope, Froude number, discharge, the mean flow velocity, and the mean shear velocity were calculated. Table 1, presents a summary of experimental data for this study.
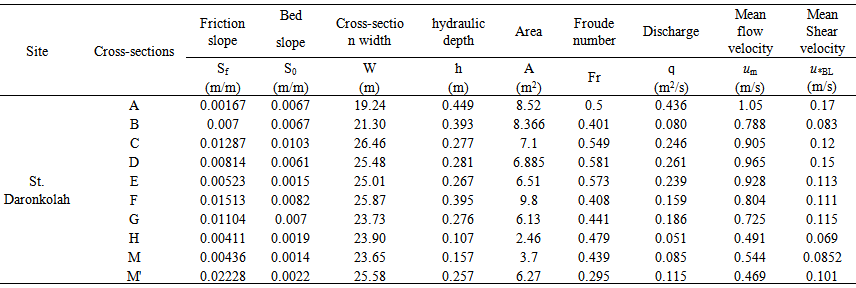 | Table 1. A summary of hydraulic data in Babolroud river |
3. Result and Discussion
3.1. Application of Darcy-Weisbach Friction Factor
- The total Darcy-Weisbach friction factor is defined as
 | (8) |
 the mean shear velocity in the same section. The total friction factor can be divided into two parts: the grain part (f ') and the form part (f "). The value of grain friction factor cannot be measured in the field and can only be estimated by assuming that part of friction is due to the surface shear stress applied directly to the grains located over the bed [11]. In applying the traditional methods to calculate the resistance to flow (Manning or Darcy-Weisbach equation), the main difficulty lies in determining the form friction part because no robust method exist for this task. The friction factor can be divided into two parts [3, 19, 21]:
 | (9) |
 | (10) |
 | (11) |
 | (12) |
 h=the weighted value of depth in a cross section; and g=the gravitational acceleration.Table (2), presents the values of total friction factor (f) along with the grain (f') and bed form friction (f ") factors.
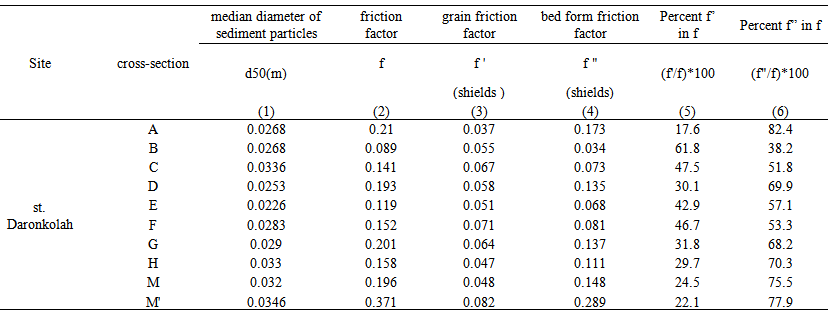 | Table 2. Determination of Friction Factor by Darcy-Weisbach |
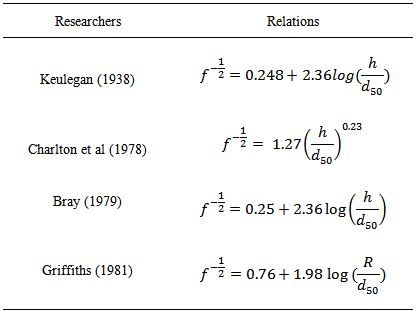
3.2. Comparison with Empirical Equations
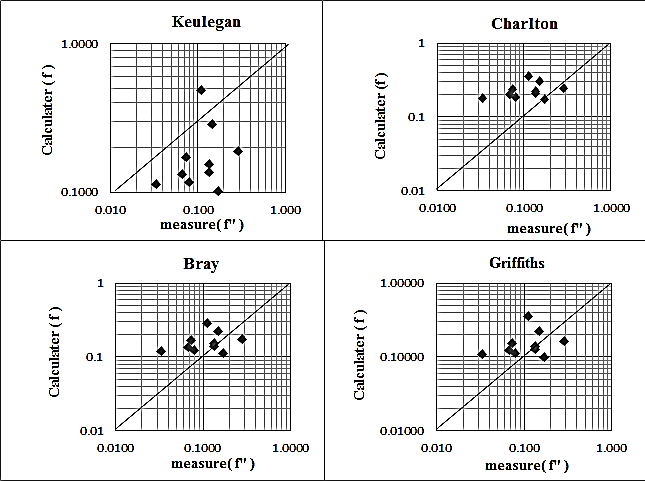
- Our investigation shows that most of the equations in the literature do not take into account the effect of bed form in the estimation of flow resistance. In this section, four equations which have been considered by hydraulic engineers [10], saying, Keulegan, Charlton, Griffiths, Bray Table (3), are used to evaluate their power of prediction for the Babolroud River data. [13, 6, 9, 5].
|
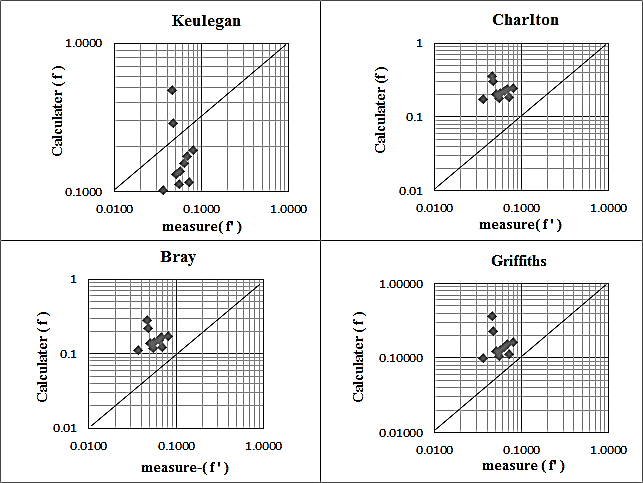 | Figure 8. Comparison of the calculated friction factor (f - f ') with the selected equations |
 | Figure 9. Comparison of the calculated friction factor (f - f ") with the selected equations |
4. Conclusions
- The following conclusions are drawn from this study:1. Form friction is a significant part of the total friction factor. It constitutes up to 65% of the total friction in the case of Babolroud River, Iran. 2. The grain friction factor considerably overestimates the total friction factor using the equations of Charlton, Bray and Griffiths and underestimates it using the Keulegan's equation using Babolroud river data.3. Bray and Griffith's equations display a reasonable relationship between the form friction and the total friction factor, but Keulegan and Charlton's equations present considerably underestimate and overestimate the total friction factor respectively.4. Accurate determination of friction is fundamental to determining the river flow capacity. None of the selected equations in this study work well to estimate the total friction factor in Babolroud River.