Md. Lutfor Rahman1, A K M Ashrafuzzaman2, Kazi Rejaul Karim2, Md. Matiar Rahman Mondal3, Md. Johurul Islam4
1Chief Scientific Officer, RRI
2Principal Scientific Officer, RRI
3Senior Scientific Officer, RRI
4Scientific Officer, RRI
Correspondence to: A K M Ashrafuzzaman, Principal Scientific Officer, RRI.
| Email: |  |
Copyright © 2014 Scientific & Academic Publishing. All Rights Reserved.
Abstract
A physical model study was carried out at River Research Institute (RRI) to determine the optimum alignment of the proposed canal in the Old Madhumati River, effectiveness and performance of the canal, optimization of the length of revetment, flow field and erosion-deposition patterns inside the canal. To achieve the objectives, different options are tested in the physical model to find out its effectiveness and to optimize the revetment in terms of length, location and orientation. The study reveals that the option when the offtake of the canal is shifted by 50 m upstream along the left bank of the Madaripur Beel Route (MBR) and having revetment at selected locations of the canal and MBR, provides best choice for alignment and excavation of the Old Madhumati canal. The study also shows that the maximum velocity and scour is found as 1.66 m/s and -2.70 m respectively in the vicinity of proposed revetment.
Keywords:
Optimum alignment, Canal, Effectiveness, Revetment, Velocity, Scour and deposition
Cite this paper: Md. Lutfor Rahman, A K M Ashrafuzzaman, Kazi Rejaul Karim, Md. Matiar Rahman Mondal, Md. Johurul Islam, Optimization of Alignment of Proposed Canal and Revetment in the old Madhumati River Using Physical Modelling: A Case Study, International Journal of Hydraulic Engineering, Vol. 3 No. 2, 2014, pp. 68-75. doi: 10.5923/j.ijhe.20140302.03.
1. Introduction
Once the Old Madhumati River was dynamic but at present, the river is silted upon its bed due to huge sedimentation. Therefore, canal formation through excavation of the existing river bed is necessary to make the river more active and dynamic.Madaripur Beel Route (MBR), a manmade river, originates from the Arial Khan River and it is excavated by the British Government when East India Company was in this country. The Old Madhumati River originates from the Madaripur Beel Route (MBR) downstream of Haridashpur Bridge having length 8.32 km and meet at the downstream of the confluence of MBR and Gorai Madhumati River. The Old Madhumati River has been subjected to serious environmental degradation over the years through dumping of wastes, instances of illegal occupation, lack of development endeavors etc and became silted up. The situation has now assumed a serious turn with adverse ramifications for public health, congestion, water logging and ‘life-friendly’ urban environment of the Gopalgonj town. In view of these, it is imperative to undertake a project for rehabilitation of the Old Madhumati River through excavating a canal and to build necessary urban physical infrastructure and recreational facilities in the Gopalgonj town and the present project has been proposed to cater for such needs. There are some illegal occupations on the river banks; garbage and wastes are dumped into the river at some places. These are the causal effect of environmental degradation and public health nuisance in the Gopalgonj town area. Every year during monsoon, both banks of the river get inundated due to siltation on the river bed. In view of this, rehabilitation of Old Madhumati River through excavation has become a necessity to meet the public demands.For convenience, model study is divided into two phases: Phase-I and Phase-II. Under Phase-I, about 1.8 km river reach of MBR and 3.6 km Old Madhumati River out of 8.32 km from its offtake have been reproduced in the model. The model under Phase-I is undistorted having horizontal and vertical scale of 1:30. The remaining part of the Old Madhumati River i.e. 4.72 km is reproduced in Phase-II study. The model under Phase-II is distorted with horizontal scale of 1:50 and vertical scale of 1:20. The study area reproduced in the model under Phase-I and II can be seen in Figure 1. 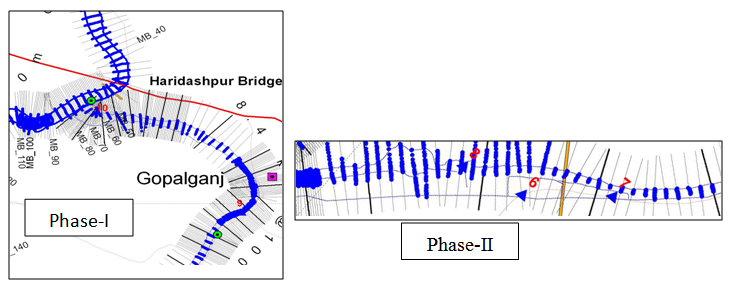 | Figure 1. The study area reproduced in the model in Phase-I & II |
2. Methodology
An open air model bed of RRI having dimension of 125 m X 120 m is used for setting up the model. The length of the study area is about 1.8 km river reach of MBR and 3.6 km of Old Madhumati River from its off-take with full width. The model is constructed based on the bank line and bathymetric survey of December 2009. The model bed is constructed on the basis of centreline of the canal supplied by IWM (Institute of Water Modelling) and the design-drawings of the canal proposed by LGED (Local Government Engineering Department). The layout of the model in Phase-I is shown in Figure 2.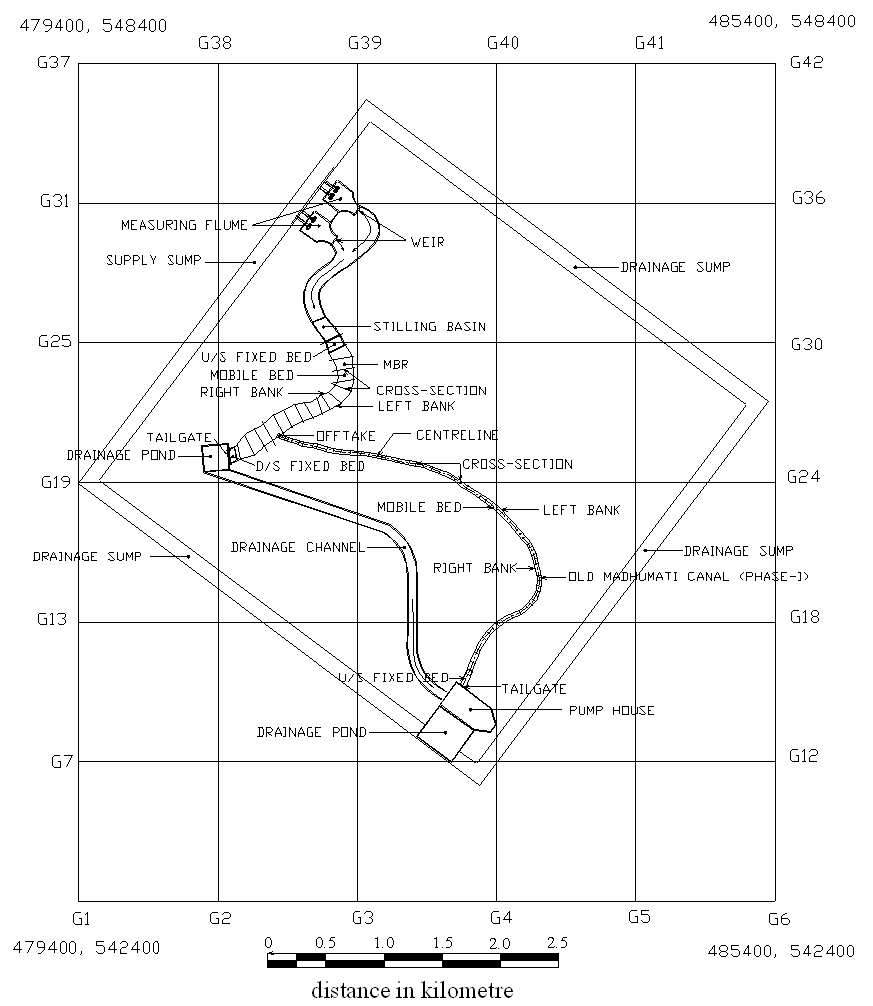 | Figure 2. The layout of the physical model under Phase-I |
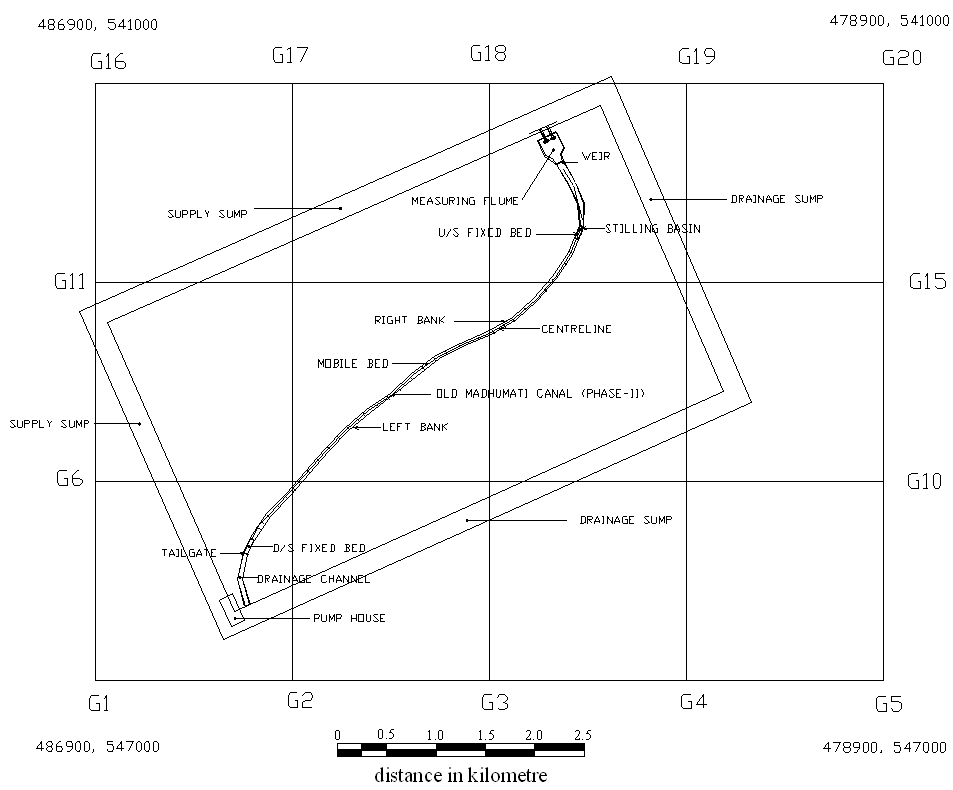 | Figure 3. The layout of the physical model in Phase-II |
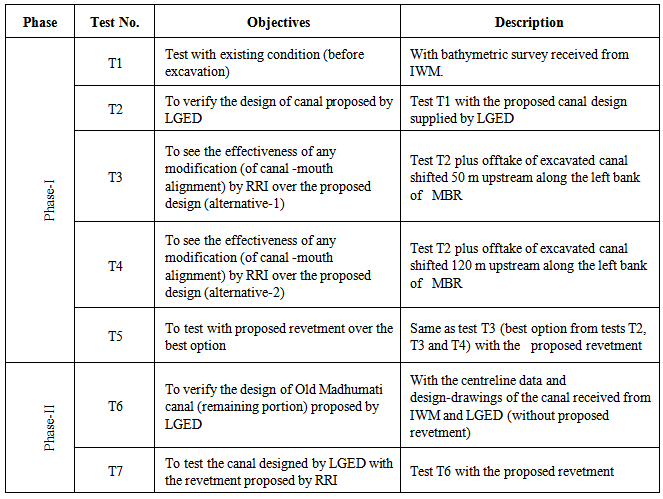
According to the survey, the water level at cross-section MBR-41 (calibration section) is +1.4 mPWD. The corresponding discharge is around 947 m3/s. The discharge corresponding to the water level +3.1 mPWD at the calibration section is around 1420 m3/s. The water surface slope in the MBR and canal is around 4.5 and 10 cm/km respectively. The model is calibrated with the discharges corresponding to the water levels mentioned above. The application tests (tests with proposed condition) are conducted with two water levels +1.3 and +3.1 mPWD at cross-section MBR-41. The water level at the offtake of the canal is calculated as +1.26 and +3.06 mPWD corresponding to the water levels of +1.3 and + 3.1 mPWD at cross-section MBR-41 for the application tests. The discharges are measured at the offtake of the canal corresponding to those water levels during application tests.Under Phase-I, two types of tests are conducted in the model: (i) Test with existing condition (T1) and (ii) Test with proposed conditions called application tests (T2-T5). Test T1 contributed to simulate the model with existing condition. Test T2 through T5 are carried out to determine the optimum alignment of the offtake of the canal, effectiveness and performance of the canal, optimization of length of revetment, flow field and erosion-deposition patterns inside the canal. Flow lines are also recorded in each test by float tracking using wax balls dropped along the river starting from cross-section MBR-41 considering two water levels of +1.3 and +3.1 mPWD. In all tests, the depth-averaged flow velocities are measured in the model along cross-sections at the rate of 7.5 m interval from left bank to right bank of MBR and canal with two water levels +1.3 and +3.1 mPWD at cross-section MBR-41. Under Phase-II, two application tests (T6 and T7) are conducted in the model. The canal reproduced in Phase-II is an extension of canal reproduced in test T5 conducted under Phase-I. The objective of test T6 is to verify the design of the remaining portion of canal by reproducing it in the physical model and to assess the length of revetment required in the canal. Test T7 is same as test T6 with the introduction of bank protective work (revetment) required to combat bank erosion inside the canal. This objective of this test is to optimize the length of revetment and to observe the effectiveness and performance of the canal with proposed revetment. The bed level of MBR and Old Madhumati canal is also measured at the rate of 7.5 m interval along cross-sections using leveling staff before and after test run in the model and the corresponding net scour/deposition is determined at each cross-section from left bank to right bank. The velocity as well as erosion-deposition pattern of MBR and canal have also been determined.
3. Model Calibration
The calibration of the model is aimed at adjusting the incoming prototype flow distribution at the approach section and water level at the downstream section and also verifying the morphological development in the model. Initially the model is fed with the sediment at the rate which is calculated from the Engelund-Hansen total load formula. The sediment feeding rate has been finalized after observing the changes in bed level during model calibration. Sediment is fed in the model for the test with existing condition as well as for the application tests.In Phase-I, the velocity distribution at the upstream section of the model is simulated at the upstream boundary of the model. The velocity at the calibration section (cross-section MBR-41) is measured and compared with the prototype value corresponding to water levels +1.4 and +3.1 mPWD at cross-section MBR-41 as shown in Figure 4. In Phase-II, the velocity at the calibration section (cross-section Canal-58) is measured and compared with the prototype value corresponding to water levels of +1.3 and +3.1 mPWD at cross-section MBR-41 as shown in Figure 5. From these figure it is evident that the simulated values found in the model are very close to the prototype values both in Phase-I & II.  | Figure 4. Comparison of velocity with water level +1.4 and 3.1 mPWD at the calibration section (MBR-41) under Phase-I |
 | Figure 5. Comparison of velocity with water level +1.4 and 3.1 mPWD at the calibration section (Canal-58) under Phase-II |
4. Test Scenarios
The description of all test runs with various alternative options used in different tests is mentioned in the test scenarios. The test scenarios in each test are described in the Table 1. Table 1. Test scenarios of the model
 |
| |
|
5. Analysis and Interpretation of the Test Results
Test T1 is completed with existing condition with two water levels: one is +1.4 mPWD and another +3.1 mPWD at cross-section MBR-41. The corresponding discharges are 947 and 1420 m3/s at cross-section MBR-41. With these water levels, no water is entering into the river as it is silted with the sediment coming from MBR during monsoons and as a result, the bed of the existing river is higher which allows no flow through the canal. Moreover, the thalweg near offtake is on the other bank. During test it is observed that the main flow follows the thalweg and from downstream of Haridashpur bridge, it shifts from left bank towards downstream. The flowlines are opposite to the offtake on the right bank. The application tests are carried out with two water levels +1.3 and +3.1 mPWD. In test T2, the river is excavated as per design supplied by LGED and its alignment of centreline is supplied by IWM. Here flow from MBR is entering in to the canal with these water levels. The velocity exists at the offtake of the canal with both water levels. The percentage of flow goes through the canal is 2.92% and 6.64% of MBR corresponding to the water levels mentioned above. The floats are entering through the offtake and passing towards the canal. Siltation occurs at the offtake due to decreased velocity of flow. In test T3, the offtake of the canal is shifted around 50 m upstream with respect to test T1 along the left bank of MBR and the alignment of the remaining (excluding near offtake portion in test T3) canal is same as in test T2. Flow from MBR is coming into the canal. There is an existence of velocity at the offtake of the canal which causes discharge passing through the canal. The percentage of flow entrance to the canal is 3.43% and 7.31% of MBR corresponding to the water levels +1.3 and +3.1 mPWD. In this test, an increased amount of discharge flows through the canal. The flows are concentrated on the right bank of canal and passing through the canal. Scouring at the offtake of the canal occurs due to increased velocity. In test T4, the offtake of the canal is shifted further upstream by 120 m along the left bankline of MBR relative to test T2 and the orientation of the remaining (excluding near offtake portion in test T4) canal is identical as in test T2. Some percentage of flow from MBR is passing through the canal. The amount of flow entrance to the canal is 5.46% and 7.97% of MBR corresponding to the water levels +1.3 and +3.1 mPWD. Here also an increased quantity of flow entering into the canal due to the alignment of the canal in this test. In this case, a component of flow from MBR directly enters the canal which causes increased discharge through the canal. The increased discharge might lead to increased sediment entry with the flow passing into the canal. The existence of velocity is observed at the offtake of the canal. The flows are parallel and close to the right bank of canal downstream of offtake. Scouring also occurs at the offtake of the canal due to increased velocity of flow. Among three application tests (T2, T3 and T4), test T3 provides satisfactory results from hydraulic point of view and it is cost-effective. Although it provides little decreased discharge through the canal but it allows less sediment entry into the canal relative to test T4. Therefore, it requires less cost for sediment management at the offtake of the canal and less protective works than test T4.Test T5 is same as test T3 with four revetments (one revetment along right bankline and the others are along left bankline) in the canal and two revetments (along left bankline) in the MBR upstream and downstream of offtake. These are subjected to two water levels of +1.3 and +3.1 mPWD at cross-section MBR-41. Here some part of discharge of MBR is passing through the canal. The percentage of discharge entry in to the canal is 3.70% and 7.80% corresponding to the water levels of +1.3 and +3.1 mPWD at cross-section MBR-41. Here some increased amount of flow coming into the canal relative to test T3 due to the introduction of revetment at the offtake. Here the average velocity at the entrance of the canal is more than that in test T3 with both water levels due to revetment proposed in this test. The flows are parallel to the proposed revetment placed in this test. Scouring occurs at the right bank of offtake of the canal. This is due to high velocity of flow occurs along the RB revetment-2 (canal) near the offtake.Table 2 shows a comparison of discharges under different tests with water levels +1.3 and +3.1 mPWD at cross-section MBR-41. From this table it is seen that due to introduction of revetment in test T3, test T5 yields slightly increased discharge compared to test T3. Table 3 shows the velocity and scour in the vicinity of proposed revetment in the MBR and canal. Table 4 shows the length and alignment of revetment proposed in the canal and MBR. | Table 2. Comparison of discharge passing through the canal under Phase-I |
| | Test N0. | Offtake position | Qaccess to the canal (% of MBR) | | WL+1.3 mPWD at MBR-41 | WL+3.1 mPWD at MBR-41 | | T2 | As proposed | 2.92% | 6.64% | | T3 | 50 m upstream | 3.43% | 7.31% | | T4 | 120 m upstream | 5.46% | 7.97% | | T5 | Same as test T3 with proposed revetment | 3.70% | 7.80% |
|
|
| Table 3. Velocity and scour around proposed revetment under Phase-I |
| | Sl. No. | Revetment | Maximum velocity (m/s) and scour (m) | | 1 | LB (left bank) Revetment-1(Canal) | 1.05-1.23 | | 2 | RB (right bank) Revetment-2 (Canal) | 1.66-2.70 | | 3 | LB Revetment-3 (Canal) | 1.32-0.54 | | 4 | LB Revetment-4 (Canal) | 1.32-0.36 | | 5 | MBR Revetment-1 (LB) | 1.381.56 | | 6 | MBR Revetment-2 (LB) | 1.21-2.64 |
|
|
| Table 4. Length and alignment of proposed revetment under Phase-I |
| | Sl. No. | Revetment | Length and alignment | | 1 | Canal LB Revetment-1 | 107 m [Cross-section Canal 0' (offtake) - between Cross-section Canal 3 & 4] along bankline | | 2 | Canal RB Revetment-2 | 332 m [Cross-section Canal 0' - 7] along bankline | | 3 | Canal LB Revetment-3 | 278 m [Cross-section Canal 21 - 25] along bankline | | 4 | Canal LB Revetment-4 | 405 m [Cross-section Canal 42 - 50] along bankline | | 5 | MBR LB Revetment-1 | 86 m [between MBR-65 & MBR-70] along bankline | | 6 | MBR LB Revetment-2 | 92 m [between Cross-section MBR-70 & Cross-section MBR-75] along bankline |
|
|
In test T6, the remaining portion of canal is excavated as per design and drawings proposed by LGED and its alignment is as per centreline of the canal supplied by IWM. The flows have attacking tendency to the left bank of the upstream bend of the canal under Phase-II. From the velocities measured at Canal 59 through 92, velocity varies from 0 to 0.98 m/s and 0 to 1.40 m for water level +0.91 and +2.71 mPWD respectively at Canal-58. From the scour-deposition data measured at Canal-59 through 90, maximum bed scour is found around -0.38 m at Canal-83.Test T7 is same as test T6 with the introduction of LB revetment-5 placed at the upstream bend of the remaining portion of canal under Phase-II. The flowlines are parallel and close to proposed revetment from Canal 60-70 at the left bank of the upstream bend of the canal under Phase-II. From the velocities measured at Canal 59 through 92, velocity varies from 0 to 0.85 m/s and 0 to 1.40 m with water levels +0.91 and +2.71 mPWD respectively at Canal-58. The measured velocity around the proposed revetment in this test varies from 0.49 to 0.81 m/s and 0.99 to 1.26 m/s respectively for water level +0.91 and +2.71 mPWD at Canal-58. Scour occurs around the revetment as flows are close to the revetment. The measured scour around the proposed revetment in this test varies from -0.28 m to -0.48 m. From the scour-deposition data measured at Canal 59 through 90, maximum bed scour is found around -0.32 m at Canal-59. Bed scour occurs around the proposed revetment placed at the bend of upstream part of canal under Phase-II due to increased velocity of flow. Table 5 shows the velocity and scour in the vicinity of proposed revetment in the canal under Phase-II. The length and alignment of revetment proposed in test T7 can be seen in Table 6. | Table 5. Velocity and scour around proposed revetment under Phase-II |
| | Revetment | Maximum velocity (m/s) and scour (m) | | LB Revetment-5 (canal) under Phase-II | 1.26-0.48 |
|
|
| Table 6. Length and alignment of proposed revetment under Phase-II |
| | Revetment | Length and alignment | | LB Revetment-5 (canal) under Phase-II | 1528 m [Cross-section Canal 60 - Cross-section Canal 70] along bankline |
|
|
6. Conclusions and Recommendations
After a comprehensive physical model investigation, the following conclusions and recommendations are made based on the findings of the test results of the model study.Conclusions:It appears from the bathymetry that the average bed level of MBR is much lower than the average bed level of the existing river. So the bottom of the proposed canal should be deeper for sustenance of flow in the canal. From the survey data, it appears that the thalweg of MBR at present is located near the right bank which is opposite to the offtake of the silted river. It would be better if measures could be taken to shift the thalweg towards the left bank. It is found from the model study that the main flow in the MBR shifts from left bank (downstream of Haridashpur Bridge) to right bank. It is wise to take measures to shift the main flow towards the left bank. The maximum velocity and scour is found as 1.66 m/s and -2.70 m respectively in the vicinity of proposed revetment.Recommendations:When the offtake of the canal is shifted by 50 m upstream along the left bank of MBR and having some revetment at selected locations of the canal and MBR, it provides best option for alignment and excavation of the Old Madhumati River. A total length of 2.828 km revetment (0.178 km in the MBR and 2.650 km in the excavated canal) is recommended based on the model study. The optimum alignment of canal with recommended revetment is shown in Fig. 6. 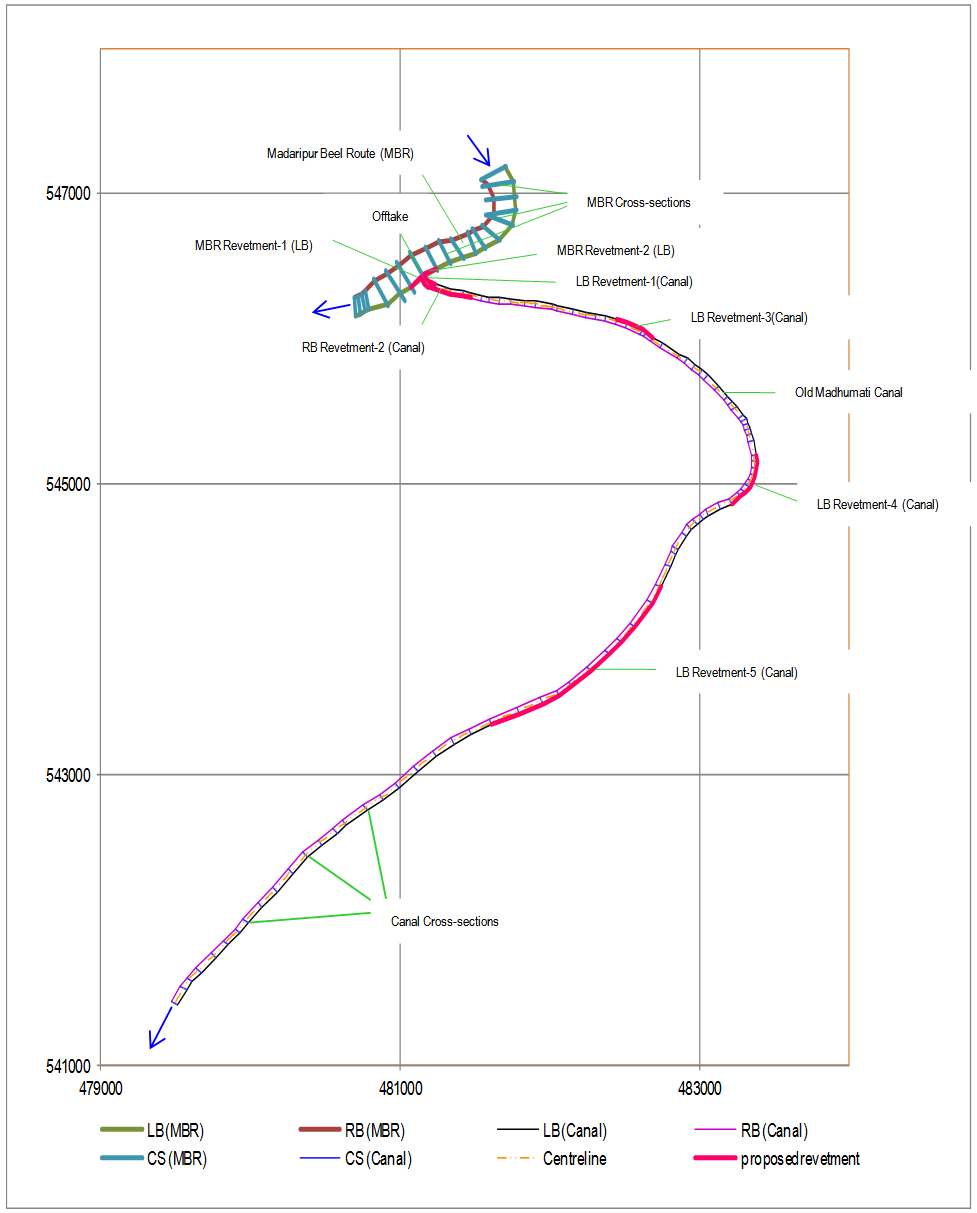 | Figure 6. Optimum alignment of canal with recommended revetment |
At the offtake, yearly dredging will be necessary to remove the deposits. The length of yearly dredging is roughly 0.5 km in the MBR around the offtake and 1.0 km in the canal from its offtake. Close monitoring and regular maintenance is necessary in the canal to ensure required flow depth. The ground level and side slopes of the canal, where there is no proposed revetment, should be protected with grass sod turfing with a clay layer of 0.5 m underneath. If possible, the average bed level of the Old Madhumati canal may be lowered by 1.0 m to ensure flow in the canal throughout the year. The canal should be excavated as per specification of design & drawings e.g. properly maintaining side slope, depth, berm width, crest width, longitudinal slope etc. Proper compaction must be ensured after excavation and refilling otherwise loose soil will be eroded. Revetment should also be placed at the junction of outfall of the canal with the Gorai Madhumati River.
ACKNOWLEDGEMENTS
The authors are grateful to Local Government Engineering Department (LGED) for providing financial support to conduct physical model study at RRI.
References
| [1] | Delft/DHI (1994): River Survey Project (FAP24), Study Report 3, Morphological studies Phase 1: Available data and characteristics, Dhaka, Bangladesh. |
| [2] | Jogleker D. V. (1970): Manual on River Behaviour, Control and Training, Publication No.60, Central Board of Irrigation and Power, page 215-242. |
| [3] | Montensen P. (1964): Physical Modelling of Open Channel Flow, Lecture Notes, Danish Hydraulic Institute. |
| [4] | River Survey Project (1996a): FAP24, Final Report, Main Vol, No.1 |
| [5] | River Survey Project (1996c): FAP24, Special Report No.7, Geomorphology and Channel Dimensions. |
| [6] | Sharpe J.J. (1981): Hydraulic Modelling, The Buttersworth group, Billing and Sons, England. |
| [7] | Tesaker E. (1986): Some aspect of Hydraulic Modelling, Lecture Notes for RRI, UNDP/DTCD Project. |
| [8] | Van Rijn C. (1984): Sediment Transport, Part-III Bed Forms and Alluvial Roughness, ASCE Journal of Hydraulic Engineering, Vol. 110, No. 12, December. |


 Abstract
 Reference
 Full-Text PDF
 Full-text HTML