-
Paper Information
- Previous Paper
- Paper Submission
-
Journal Information
- About This Journal
- Editorial Board
- Current Issue
- Archive
- Author Guidelines
- Contact Us
International Journal of Hydraulic Engineering
p-ISSN: 2169-9771 e-ISSN: 2169-9801
2013; 2(5): 101-114
doi:10.5923/j.ijhe.20130205.04
Turbulence Measurements above Sharp-crested Gravel Bedforms
 Abstract
 Reference
 Full-Text PDF
 Full-text HTML
Elham Nasiri Dehsorkhi1, Hossein Afzalimehr1, Jacques Gallichand2, Alain N Rousseau3
1Department of Water Engineering, Isfahan University of Technology, Isfahan, Iran
2Department des sols et de génie agroalimentaire, Pavillon Paul-Comtois, Université Laval, St-Foy, QC, Canada
3Institut National de la Recherche Scientifique, Centre Eau Terre Environnement, Québec City, QC, Canada, G1K 9A9
Correspondence to: Elham Nasiri Dehsorkhi, Department of Water Engineering, Isfahan University of Technology, Isfahan, Iran.
| Email: |  |
Copyright © 2012 Scientific & Academic Publishing. All Rights Reserved.
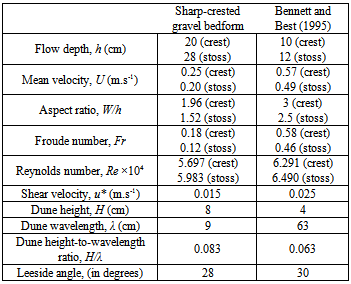
This paper primarily presents velocities, Reynolds stresses and turbulence intensities of flow over a series of two-dimensional asymmetric sharp-crested, gravel bedforms. The bedforms have a mean wavelength of 0.96 m, a mean height of 0.08 m, and a width of 0.4 m (equal to the flume width) and a lee slope of 28. The results show that extrapolating spatially-averaged log-law velocity profiles provided the best estimate of bed shear stress for bedforms. Maximum values of the root-mean-squared velocity over the sharp-crested gravel bedforms were located farther away from the bed when compared to those for sand dunes. The Reynolds stresses were zero or negative near the water surface over sand dunes, whilst they were positive over sharp-crested gravel bedforms. The length of the separation zone of gravel dunes was less than that for sand dunes, showing a faster reattachment over a gravel bed in comparison to that of a sand bed. Quadrant analysis showed that near the bed the contributions of sweep and ejection events changed with an oscillatory pattern along the sharp-crested gravel bedforms, however, such a pattern was not observed close to the water surface.
Keywords: Gravel Bedforms, Turbulence, Flow Separation, Reynolds Stress, Quadrant Analysis
Cite this paper: Elham Nasiri Dehsorkhi, Hossein Afzalimehr, Jacques Gallichand, Alain N Rousseau, Turbulence Measurements above Sharp-crested Gravel Bedforms, International Journal of Hydraulic Engineering, Vol. 2 No. 5, 2013, pp. 101-114. doi: 10.5923/j.ijhe.20130205.04.
Article Outline
1. Introduction
- Gravel and sand bedforms occur locally in rivers and can be found in regions characterized by small, to moderate, sediment transport rate and relatively high-energy conditions. The effect of gravel and sand bedforms on a turbulent flow is important in determining friction factor and sediment transport in coarse-bed rivers. These bedforms arise from the interactions of the coarse bed with the flow, revealing considerable changes in the mean flow and turbulence characteristics. The spatial evolution of the turbulence field over gravel and sand bedforms is dominated by flow separation and reattachment processes along with wake formation. Several investigations have provided insights on the influence of gravel and sand bedforms on their associated turbulent flow features ([1],[2],[3]). Most of the data on gravel bedforms come from studies conducted by Dinehart ([4],[5],[6]).However, Carling[2] investigated bedforms with D/L ratios (D, dune height; L, dune length) in both gravel and sand dunes. He stated that the height of gravel bedforms should reach an equilibrium value equivalent to that for sand dunes. However, owing to the particular constraints of experimental and field conditions, data for gravel bedforms have often pertained to non-equilibrium and/or depth-limited conditions. For example, most of D/L ratios for gravel bedforms reported in the literature have had a tendency to be low, and rarely commensurate with equilibrium values recorded for deep-water, sand-dune trains ([5],[6]).The flow over a two-dimensional bedform is highly non-uniform, accelerating over the bedform, upstream slope due to convergence, and decelerating over the bedform trough due to expansion. In general, bedform formation causes flow separation at the crest, creating a large recirculation zone on the leeside of the bedform. The flow reattaches approximately four to six bedform heights downstream of the crest[7]. Downstream of the point of reattachment, a new boundary layer develops and grows as the flow accelerates towards the next bedform crest. This flow structure induces a high pressure region downstream of the reattachment point, upstream of the next bedform, and a low pressure region on the steep lee side, so on and so forth. Bennett and Best[1] investigated using a laboratory flume velocity and turbulence structures over fixed, two-dimensional sand dunes (grain diameter 0.3 mm), having a length of 0.63m, a height of 0.04m and a lee angle of 30° in a laboratory flume. They used ratios of wavelength/flow depth of 4-5, wavelength/bedform height of 15-17 and flow depth/bedform height of 2-9; and found considerable symmetry in streamwise and vertical velocities from crest to crest. They also observed that: (i) the maximum streamwise turbulence intensity (root-mean-squared velocity fluctuations) occurred within the flow separation zone and downstream of the reattachment point, (ii) the maximum vertical turbulence intensity occurred along the shear layer within and above the flow separation zone; and (iii) the maximum Reynolds stresses occurred within the separation zone along the shear layer. Their quadrant analysis showed that ejection events, dominated the shear stress contribution along the local shear layer, and sweep events played a significant role near the reattachment point and close to the dune crest. Williamson et al.[8] found that two types of dunes developed in the Fraser River estuary, Canada: (i) symmetric dunes with stoss and lee sides of similar lengths, gentle lee side slope angles and rounded crests; and (ii) asymmetric dunes with superimposed small dunes on their stoss sides, and sharp crests with steeper lee sides.Sharp-crested bedforms were investigated using airflow by Frank and Kocurek[9], Walker and Nickling[10]. However, typical bedform shapes found in rivers are rounded crest, i.e. where the brink is clearly distinguishable from the crest. Tsoar[11] showed that the rounded dunes were more stable than those that are triangular, since the sharp-crested shape experienced strong flux at the brink. Sharp-crested bedforms usually develop from the strongly increased gravel drift close to the crest, operating in horizontal and vertical directions, and may change with flow direction. To present a realistic model, showing flow structure over bedforms before forming a round crest which are typically observed in rivers, it is required to understand the flow structure over a triangular-crested bedform. To corroborate results of CFD simulations (computational fluid dynamics of Reynolds-averaged Navier-Stokes equations) or perhaps provide modeling insights to large eddy simulation (LES) models of flows over sharp-crested gravel bedforms, there is a need to investigate these shapes in details in the laboratory. This represents the primary of objective of this paper.More specifically, this study: (i) investigated the characteristics of the velocity fields, Reynolds stresses, and turbulent intensity distributions, using accurate and detailed measurements over sharp-crested, gravel bedforms set in a laboratory flume, and (ii) compared the ensuing results with those reported by Bennett and Best (1995) in their study on flows over sand-bed dunes. Furthermore, the following questions were addressed: (i) What is the effect of sharp-crested gravel dunes on velocity and Reynolds stress distributions?; (ii) How does the separation length change over gravel bedforms with respect to that observed for sand-bed dunes?; (iii) What are the dominant events of the bursting process over sharp-crested bedforms?; and (iv) How do the dominant events over gravel bedforms change when compared to those characterizing sand bedforms?
2. Experimental Setup
- The experiments were conducted using a re-circulating flume of the Hydraulics Laboratory at the Isfahan University of Technology, Iran. The channel was 8-m long, 0.4-m wide and 0.6-m deep with a horizontal longitudinal bottom slope. The walls and base of the flume were made of glass. A gate located at the downstream end controls the water depth in the flume. For all the dunes, the mean flow depth (h) was kept constant at 20 cm, which is defined as the vertical distance between the water surface and the sediment bed at the crest section. The experiments were performed with a discharge, Q, of 0.024 m3/sec. An electromagnetic current-meter with a digital system was fitted in the inlet pipe to facilitate continuous monitoring of the discharge.Seven, two-dimensional, fixed bedforms were attached to the bottom of the flume (Figure 1). The bedforms were prepared with well-sorted gravel particles with a median diameter, d50, of 10-mm. The geometric standard deviation, σg, of the particle size distribution of the bed sediments, given by (d84/d16)0.5, was 1.23. The particle sizes were collected from gravel-bed rivers in the central part of Iran where many coarse-bed rivers can be found.
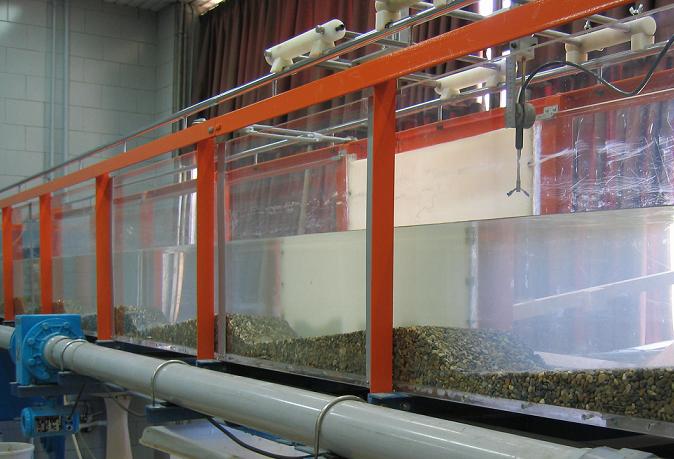 | Figure 1. Experimental Set up |
 ) were less than unity (0.18 at the crest and 0.12 at the stoss), indicating subcritical flow.The time-averaged stream-wise velocity,
  , spanwise mean velocity,
  , vertical mean velocity,
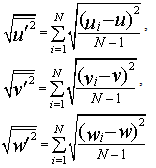
  , stream-wise turbulence intensity,
  , spanwise turbulence intensity,
  , and vertical turbulence intensity,
  , were defined as:
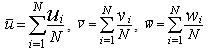 | (1) |
 | (2) |
 | (3) |
 | (4) |
|
3. Quadrant Analysis
- The bursting events were quantified by the conditional statistics of the velocity fluctuations (u' and w'). It is customary to plot u' and w' according to quadrant in the u'w'-plane[16]. To differentiate the larger contributions to
 from each quadrant leaving the smaller u' and w' corresponding to more quiescent periods, a hole size parameter H is introduced[17]. The hyperbolic hole region is determined by the curve
  . Hence, a clear distinction was possible between strong events and weak events for a small-size hole and by taking into account only strong events for a large-size hole. The turbulent events were defined by the four quadrants as outward interactions (i = 1; u' > 0; w' > 0), ejections (i =2; u' < 0; w' > 0), inward interactions (i = 3; u' < 0; w' < 0), and sweeps (i =4; u' > 0; w' < 0). The hole size H = 0 implicated that all u' and w' were included. The quadrant analysis revealed the fractional contributions to
  from bursting events. At any point in a stationary flow, the contribution to the total Reynolds stress from quadrant i, excluding a hyperbolic hole region of size H, is
 | (5) |
 obeys:
 | (6) |
 value. The stress fraction of the ith quadrant was defined as:
 | (7) |
 when i=2 and 4 (Q2 and Q4), and
  when i=1 and 3 (Q1 and Q3). Hence, at a point, the sum of contributions from different bursting events was unity, showing that
  .To show a measure of relative dominance of sweeping and ejection events, the following relation was introduced:
 | (8) |
4. Results
4.1. Mean Flow Field
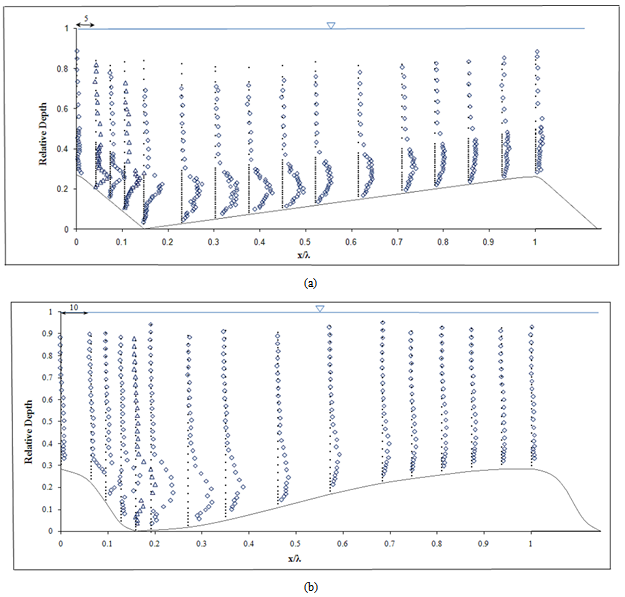
- Figure 2a shows the measured velocity distribution over a two-dimensional sharp-crested bedform. The data clearly show how the flow separated at the crest and reattached at some point downstream on the next bedform which similar to the flow separation over sand dunes in the study of Bennett and Best (1995) (Figure 2b). This separation created a positive pressure gradient that induced a smaller velocity gradient with the smaller velocity occurring near the bed. The reduction in velocity in the presence of the positive pressure gradients is observed in Figures 2a, 2b. The vertical profiles of the mean values of the stream-wise velocity in Figures 2a, b and the contour maps of the full flow field in Figures 3a, b illustrate the flow characteristics over one bed form. The stream-wise mean velocity profile at the trough position has an inflexion point near the bed resulting from local flow instability. The largest downstream velocity (0.28 m.s-1) occurred just upstream of the bedform crest at z/h=0.58, which is in good agreement with published data from sand dune studies ([1],[14]).Figures 3a and 3b clearly indicate the occurrence of separation and flow reversal as water flows over a bedform. Some studies have revealed that in flow over bedforms, a definitive region of momentum defect could be observed ([1],[14]) which is related to flow separation and the wake formation downstream of the bedform lee face. As the wake is advected downstream, the influence of the momentum defect is diffused outward, forcing the region to grow in depth[18]. Moreover, the length of flow separation, Xr, was measured from the crest, where the flow separates, to the flow reattachment point. The reattachment point was determined by observing the horizontal velocity component in the lee of the bedform. The reattachment point is located where the horizontal velocity changes sign from upstream to downstream. The difference in the size of the separation region reveals considerable deviations in the mean and turbulent flow structures and, hence, governs different conditions for sediment entrainment and transport between the separation and reattachment points, Xr, which is ≈3.7D (where D = bedform height).
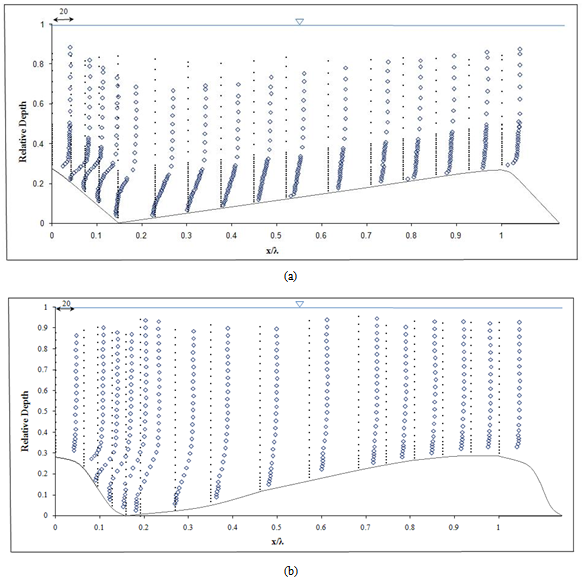 | Figure 2. Non-dimensional velocity profiles (u/u*) (a) in sharp-crested gravel bedforms and (b) using Bennett and Best’s data over one bed form wavelength, λ |
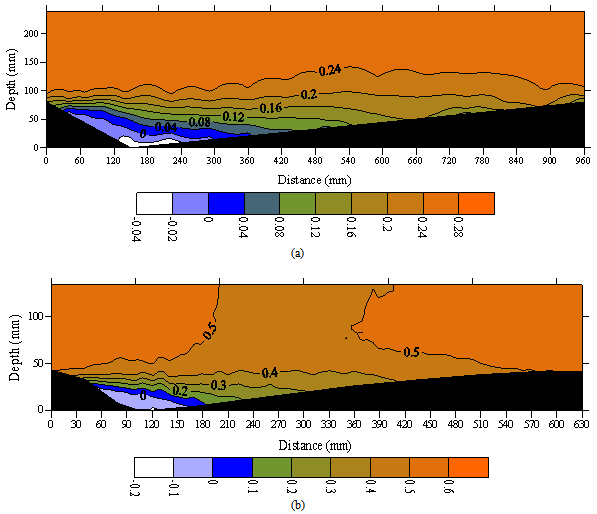 | Figure 3. Contour maps of time-averaged downstream velocity  over one bed form wavelength in (a) sharp-crested gravel bedforms and (b) using Bennett and Best’s data (1995). Flow is from left to right, color legend is given over one bed form wavelength in (a) sharp-crested gravel bedforms and (b) using Bennett and Best’s data (1995). Flow is from left to right, color legend is given |
 | Figure 4. Contour maps of time-averaged vertical velocity ( (m.s-1)) over one bed form wavelength in (a) sharp-crested gravel bedforms and (b) using Bennett and Best’s data (1995). Flow is from left to right, color legend is given (m.s-1)) over one bed form wavelength in (a) sharp-crested gravel bedforms and (b) using Bennett and Best’s data (1995). Flow is from left to right, color legend is given |
4.2. Turbulence Intensity and Shear Stress Distributions
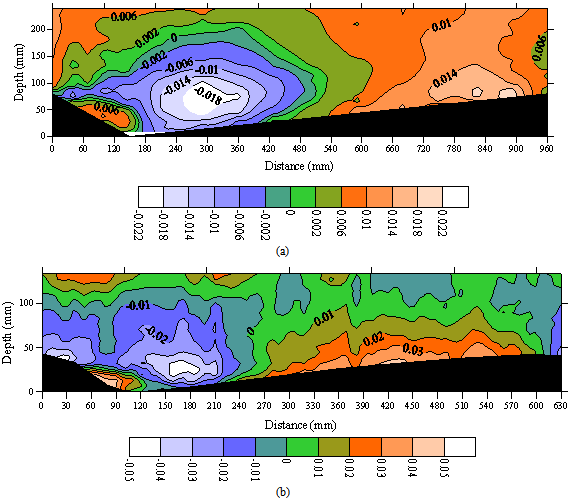
- Contour maps of the root-mean-squared (RMS) of the downstream velocity (u') in gravel and sand bedforms are shown in Figures 5a and b, respectively. High u' values, up to 0.067 m.s-1, occurred at and just downstream of the reattachment point and they diffused towards the water surface and the bed farther downstream (Figure 5a). The intensity was observed to be prominent downstream of the crest and persisted for a longer distance. Maximum u' values in gravel bedforms were located at a further distance from the bed when compared with those observed over sand dunes by Bennett and Best (1995) (Figure 5b).High w' values, up to 0.039 m.s-1, occurred inside and above the flow separation zone along the shear layer (Figure 6a) similar to those observed over sand dunes by Bennett and Best (1995) (Figure 6b). Note that w' had behavior similar to that of u', however with smaller values. The region of high w' values (from 0.026 to 0.038 m.s-1) extended from the bedform crest level towards the next crest, completely encapsulating the shear layer produced at the separation zone. Since this region was detached from the bed, the relatively high w' values were not the result of topographic forcing of the flow over the next bedform back but were associated with eddy shedding along the shear layer. Low w' values (from 0.005 to 0.02 m.s-1) were present within the flow separation zone along the bedform slip-face and near the water surface. The turbulence intensity within the boundary layer developed a strong peak at the onset of the adverse pressure gradient along the shear layer originating at the crest.As expected, the maximum exchange of fluid momentum occurred along the shear layer, where both high u' and w' values were observed. In general, most of the turbulence production occurred in the separated shear layer, where the peak of the stress-intensity profiles was observed. High turbulence intensity indicated a potential for erosion and further along downstream, the turbulence intensity decreased leading to sediment deposition.The locus of the maximum turbulence intensity was advected along the mean flow streamlines around the separated flow region, bringing turbulent fluid from the free shear layer immediately downstream of the bedform crest towards the bed.Figure 7 shows the non-dimensional Reynolds shear stress profiles (
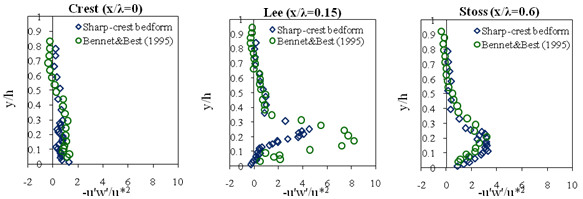
 /u*2) at different stream-wise distances along the downstream direction. Figure 7a indicates that the Reynolds shear stress distribution had features similar to those reported by Bennett and Best[1] (Figure 7b), and Nelson et al.[14], regardless of the magnitude of the bedform lee slope. Ihis shows that the shear stresses at the near-bed surface were smaller than those in the shear layer region. In addition, this figure reveals that the Reynolds stress distribution over much of the bedform is governed by turbulence generated in the free shear layer (outer region) downstream of the separation point at the bedform crest. Nelson et al.[14] found that the maximum values of the Reynolds stress (
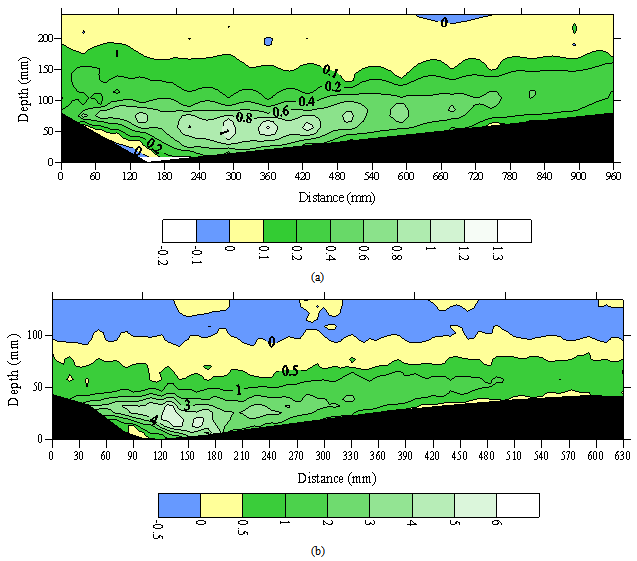
 ) over two-dimensional bedforms typically occurred at and just downstream of the reattachment zone, along the shear layer. Reynolds stresses near the bed were somewhat larger than those in the decaying wake above but they were significantly smaller (by nearly an order of magnitude) than those observed in the wake zone over the separation zone.The present study failed to observe this pattern, in all likelihood because the ADV could not accurately collect data in the internal boundary layer (IBL) region. Figure 8a, which contains a contour map of the spatial variation in Reynolds stress, shows that the maximum τ values (up to 1.37 Pa) occurred both at and just downstream of the reattachment point (y=30mm) as well as along the shear layer extending from the crest level to approximately 0.5L (similar to the results of Bennett and Best (1995), Figure 8b). Additionally, over the lee slope Reynolds stress profiles exhibited a change in slope near the bed (see Figure 7). However, such a change disappeared when the flow moved over the stoss side of the bedform. Furthermore, it was observed that the maximum stresses were located along the shear layer below the crest level (similar to those reported by Bennett and Best,[1]). Zero and slightly negative τ values near the water surface reflected very low shear in this region and the influence of the free-water surface. Nelson et al.[14] observed similar zero and negative τ values and suggested that exact equilibrium flow over the fixed bed forms was not achieved. The shear stress in the layer near the free surface was the lowest and apparently the bedform geometry did not considerably affect this layer.The high Reynolds stresses confirm that turbulence had greatest values in the separation zone, at the reattachment point and along the shear layer. Although previous studies observed these high turbulence intensities[14], none quantified the magnitude of this turbulence nor did they delineate the morphology and downstream extent of this highly turbulent region.The weak peak in the shear stress profiles at the bedform crest was due to the development of a local internal boundary layer (IBL) that formed at the point of reattachment and extended up to the bedform crest. Nelson et al.[21] stated that the bed boundary condition induces a thin internal boundary layer that forces the flow by relatively large-scale structures which are ineffective for transporting momentum in the vertical direction. This means that in real flows, one should have the no-slip condition at the bed as a boundary condition. However, for the very rough flows that the authors are investigating there were large velocity fluctuations right down to the point where the mean velocity extrapolated to zero because of the eddies shed by the roughness elements (see Figures 5 and 6). Figure 8 indicates that the correlation coefficient between u' and w' became smaller (not necessarily zero) near the bed.Figures 3, 5, 6 and 8 show that the high turbulence intensity (Figures 5, 6) and high Reynolds stress (Figure 8) within the inner layer (near the bed) were characterized by low velocity in the recirculation region (Figure 3); whereas the region of outer flow was dominated by a high velocity, low Reynolds stress and turbulence intensity. Accordingly, sediment transport took place in the coherent flow structures characterized by high turbulence intensity and low velocity near the bed.
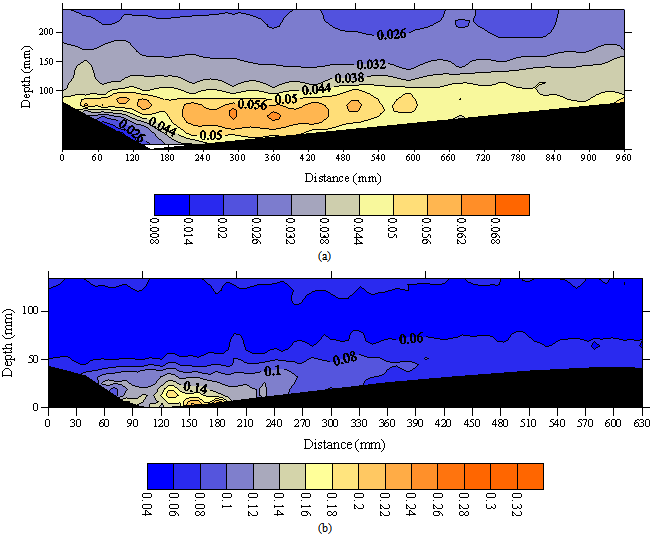 | Figure 5. Contour maps of streamwise RMS velocity (u´) over one bed form wavelength in (a) sharp-crested gravel bedforms and (b) using Bennett and Best’s data (1995). Flow is from left to right, color legend is given |
 | Figure 6. Contour maps of vertical RMS velocity (w´) over one bed form wavelength in (a) sharp-crested gravel bedforms and (b) using Bennett and Best’s data (1995). Flow is from left to right, color legend is given |
 | Figure 7. Non-dimensional Reynolds shear stress profiles ( /u*2) (a) in sharp-crested gravel bedforms and (b) using Bennett and Best’s data (1995) over one bed form wavelength, λ /u*2) (a) in sharp-crested gravel bedforms and (b) using Bennett and Best’s data (1995) over one bed form wavelength, λ |
 | Figure 8. Contour maps of turbulent Reynolds stress ( (N.m-2)) over one bed form wavelength in (a) sharp-crested gravel bedforms and (b) using Bennett and Best’s data (1995). Flow is from left to right, color legend is given (N.m-2)) over one bed form wavelength in (a) sharp-crested gravel bedforms and (b) using Bennett and Best’s data (1995). Flow is from left to right, color legend is given |
5. Discussion
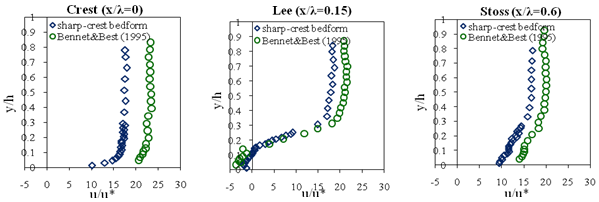
- The roughness size in Bennett and Best’s study (1995) (d50 =0.3 mm) was different from that in our study (d50=10 mm), also the geometry of bedforms was different between the two studies. However, Figure 9 shows that in both studies little difference was observed in lee and stoss zones for two studies. The higher values of velocity for sand bed form (Bennett and Best’ data) in Fig. 9 were due to higher mean velocity (see Table 1).The shape of sharp bedform was such that separation did not occur at the crest (highest point) but rather at a brink that was located somewhat downstream. Thus the effective height of the bedform was less and the extent of the separation zone appeared thinner than might have been expected. In addition, the separation zone was smaller because separation was delayed beyond the crest for sharp-crested bedform. The roughness created more mixing of the flow near the bed, therefore, the rougher bed (gravel) yielded lower velocity near the bed. Hence, the separation occurred more readily than that observed in the sand-bed channel. The sharp slope change at the crest of the gravel bedforms forced the separation to occur there.The results of this study show that the log law can be applied over bedforms, however, it did not work well locally. The log law worked well for spatially-averaged velocity profiles. The difference between calculated shear velocity by a single profile and spatially averaged velocity profiles along a bedform including, stoss, crest and lee zones was considerable. Accordingly, extrapolating spatially-averaged log-law profiles provided the best estimate of bed shear stress for different roughness sizes and bed form geometries. One may argue for extrapolating the lowest portion of the Reynolds stress profiles but this will give values near zero everywhere since both the streamwise and normal velocities are approaching zero as the bed is approached and viscous stresses increase. Within the separation zone (downstream of crest), in the lee zone, turbulence levels were very high but correlation coefficients were not high as the bed was approached showing the turbulent stress was not useful for determining the local bed shear stress. Therefore, application of the log law could provide a better estimate than the application of Reynolds stress method.
 | Figure 9. Non-dimensional velocity profiles (u/u*) in three sections over one bed form wavelength,λ (or dune length L) |
 | Figure 10. Non-dimensional Reynolds shear stress profiles ( /u*2) in three sections over one bed form wavelength,λ (or dune length L) /u*2) in three sections over one bed form wavelength,λ (or dune length L) |
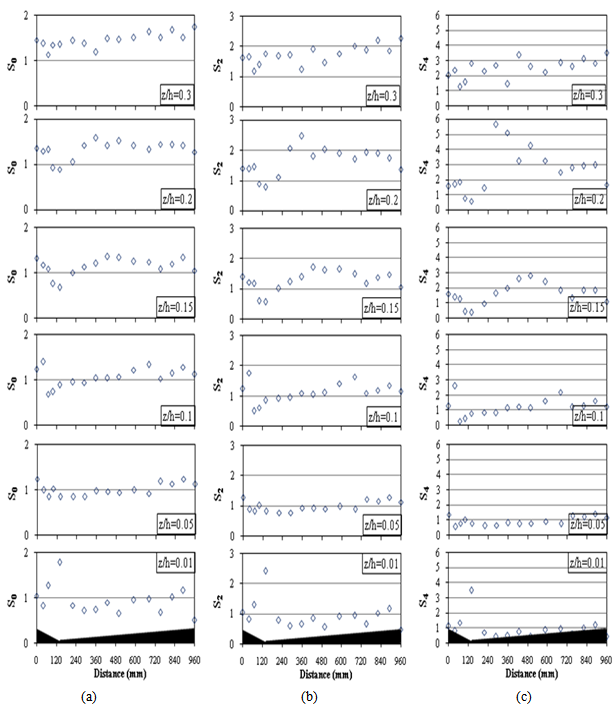 | Figure 11. Variation of SH (H = 0, 2, 4) over one dune wavelength (5th and 6th) at six vertical heights |
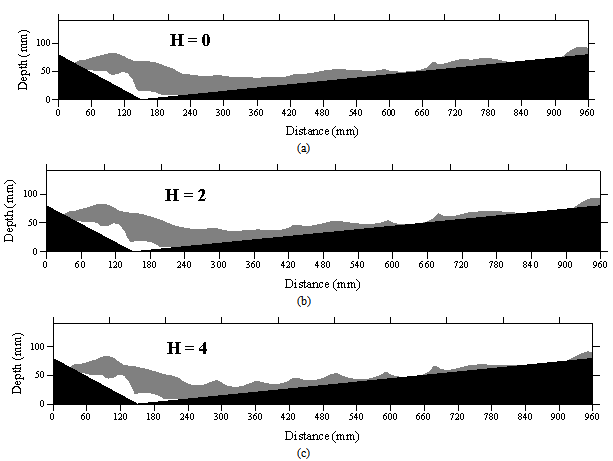 | Figure 12. Spatial distribution of the dominant ejection and sweep events for threshold parameter: (a) H = 0, (b) H = 2, (c) H = 4. The White color represents the region of ejection dominance and the grey color represents the region of sweeping dominance |
6. Conclusions
- This paper presented and compared results of the mean velocity, Reynolds stress and turbulence intensities distributions over sharp-crested gravel bedforms with those reported by Bennett and Best (1995) over sand dunes. The comparison of sand and gravel bedforms highlighted that the most important effects occurred in the crest zone; however, stoss and lee zones did not reveal any considerable changes for different Froude numbers and bedform height – to - wavelength ratio, D/λ (or D/L). This finding along the bedforms provided insights to understand the overestimation or underestimation of existing friction factor equations in which the largest relative roughness (d50/h) occurs at crest and the least relative roughness occures at lee. The spatially-averaged method can improve the prediction of the friction factor over bedforms in rivers. Extrapolating spatially-averaged log-law profiles revealed to be the best estimate of the bed shear stress.The time-averaged vertical velocity upstream of the sand dune crest was zero or negative near the water surface, whereas it was positive for sharp-crested gravel bedforms. Maximum values of RMS u over sharp-crested gravel bedforms were located far from the bed when they were compared to those over sand dunes.The Reynolds stresses were zero or negative near the water surface over sand dunes, while they were positive over sharp-crested gravel bedforms. The variation of hole size (H) from 0 to 4 did not affect considerably the occurrence of sweep and ejection events along lee and stoss.
ACKNOWLEDGEMENTS
- The authors wish to acknowledge Professor Best for giving his valuable data set and Professor Carling to read the manuscript.
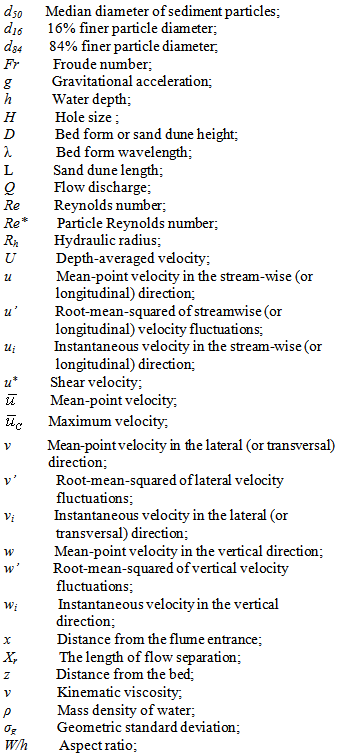
Notation
- The following symbols are used in this paper: