-
Paper Information
- Paper Submission
-
Journal Information
- About This Journal
- Editorial Board
- Current Issue
- Archive
- Author Guidelines
- Contact Us
International Journal of Hydraulic Engineering
p-ISSN: 2169-9771 e-ISSN: 2169-9801
2013; 2(5): 85-92
doi:10.5923/j.ijhe.20130205.02
The Hydraulic Behavior of Vertical Jet Sediment Bed Fluidization from the Vortex Growth Point of View
 Abstract
 Reference
 Full-Text PDF
 Full-text HTML
M. Arsyad Thaha1, Radianta Triatmadja2, A. Ildha Dwipuspita1
1Civil Engineering, Hasanuddin University, Makassar, 90245, Indonesia
2Civil Engineering, Gadjah Mada University, Yogyakarta, 90245, Indonesia
Correspondence to: M. Arsyad Thaha, Civil Engineering, Hasanuddin University, Makassar, 90245, Indonesia.
| Email: |  |
Copyright © 2012 Scientific & Academic Publishing. All Rights Reserved.
Pressurized water flow through small holes in an embedded pipe in the sediment deposite will lead to increased sediment porosity and subsequently producing drag force that causes sediments to be lifted, agitated and expanded until it reaches the phase of incipient fluidization. This mechanism is an important part for the development of fluidization method as a new technique to overcome the water channel sedimentation. Two dimensional experimental works for vertical jet fluidization in unbounded domain of sediment deposite were performed in the laboratory of Gadjah Mada University, Indonesia. The results show that the hydraulic behaviors in all steps of prefluidization toward incipient fluidization can be explained in detail. Criteria to achieve initial fluidization given by a certain value of flow rate and hydraulic head in the fluidizer pipe that produces critical internal vortex. The critical height of vortex (zc) about 0.5dbwhere dbis the thickness of the sediment deposite. Pressure distributions in the sediment bed indicate that approximately 90% of the head loss occurs within 10 cm in front of the jet hole. The hydraulic gradient (dh/z) for incipient fluidization was found about 1 to 1.2, where the Darcy's law is still valid. The shape of fluidized zone can be clearly identified through measurement of equipotential contour line.
Keywords: Hydraulics Behavior, Jet Flow, Sediment Bed, Fluidization
Cite this paper: M. Arsyad Thaha, Radianta Triatmadja, A. Ildha Dwipuspita, The Hydraulic Behavior of Vertical Jet Sediment Bed Fluidization from the Vortex Growth Point of View, International Journal of Hydraulic Engineering, Vol. 2 No. 5, 2013, pp. 85-92. doi: 10.5923/j.ijhe.20130205.02.
Article Outline
1. Introduction
- In the fluidization process of granuler sediment, fluid flow through the pores producing drag force acting on the grains of material that works in the direction of flow. Besides,the gravity force of material and buoyancy force also acting together on the materials. When the direction of flow is bottom up, both the drag force and buoyancy will lift the grains upward, while the gravity force will cause the grains move downward. In the conditions of an upward force is less than the downward force, the material will still stay on the bottom. In this case, Darcy's law and Cozeny-Carman equation is applied, where the amount of energy loss is proportional to the flow rate as in[6]. The increase of the supervisial velocity produces a drag force increase to a certain value until achieving a balanced condition in which upward force is equal to the downward force. This condition become the achievement marks of incipient fluidization.On the basis of unbounded domain deposite, the fluidization becomes more complicated because a part of flow rate passes from reviewed domain. The objectives of this paper are to present the mechanism of fluidization in each stages of the process from prefluidization to fully fluidization, the internal vortex shape, dimensions and its size development up to critical condition of fluidization, the assesment of prefluidization, initial condition and fully fluidization through equipotensial contour map and to present the changes in the pattern of hydraulic gradient from pre to post-fluidization, the understanding of the changes of flow type and limitation of Darcy Law. The illustratif stages of prefluidization to incipient fluidization by a single vertical jet in unbounded domains is shown in Figure 1.
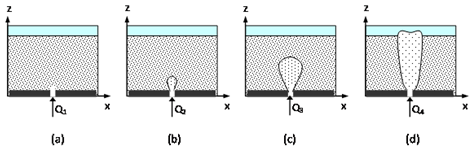 | Figure 1. The stages of fluidization process from pre (a) to incipient condition (d) |
2. References Review
- Vertical jet fluidization has been investigated by several researcher such as Bear in[1]; Lennon et al. in[1], and Widiyanto in[4]. All researchers used requirement of hydraulic head parameter as the achievement criteria of fluidization. The head requirement to achieve initial condition of fluidization in the common coastal sand characterictics were obtained about unity to the thickness of deposite or written as hydraulic gradient (dh/dL) ≈ 1. In the theoretical view, dh/dL can be larger than 2 depending on the porosity and mass density of sediment
 Thaha in[4] recommends the criteria for incipient fluidization in unlimited domains using Richardson-Zaki correlation (1971) as in[7]. Weisman et al. in[10] conducted two-dimensional experiments with serial horizontal jet in a bath size of 365.7 cm x 121.9 cm x 30.4 cm using fine sand with d50 = 0.15 mm,
  in order to determine the boundary line between fluidized-unfluidized zone. By using pressure sensors, the distribution of hydraulic head in the sand bed can be measured and mapped. Other findings are about 40% of flow rate exits through the boundary wall from fluidization zone just prior incipient conditionand drops to about 5% at the beginning of fluidization. Hydraulic gradient values ranged in initial fluidization condition
  for db = 25.4 cm and
  fordb = 45 cm. This result is slightly larger than the 1D fluidization results that give dh/dy around 1. Lennon and Weisman in[2] conducted a three-dimensional study using finite difference method to determine the need for initial fluidization hydraulic head. By using diameter and holes space 3.175 mm and 50.8 mm respectively, the simulation results showed that 80% of pressure dissipation occured within 3 cm in front of the hole. Field application design of fluidization system for channel maintenance of Panoang river estuary in Bantaeng coastline Indonesia as in[3] has been performed based on the formulation of the required hydraulic head and flow rate for fluidization obtained by Thaha as in[4],
3. Research Method
- Experimental research was conducted at the Laboratory of Hydraulics and Hydrology in Center Study of Science& Engineering, Gadjah Mada University, Indonesia. Two dimensional experimental study had been carried out in 120 cm x 50 cm x 80 cm sand bath size which were made from transparent acrylic and completed with flow circulation system. Flow rate was measured by flow meter and hydraulic pressure was measured by a manometer bank connected to pressure gauge. The sediment sample using medium sand with d50 = 0.344 mm,
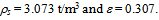 Figure 2 shows the experimental conditions.
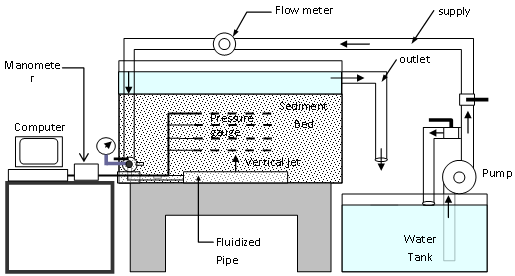 | Figure 2. Experimental conditions |
4. Results and Discussion
4.1. Initial Fluidization
- The detailed process in prefluidization stages is not fully known ahead of this study. Although the mechanism of this prefluidization stage can be explained theoretically byDarcy's law, but there is a vortex and an internal scouringoccured accompanying the process. This phenomenon seemsto be an important part of the process and needs to be explained in detail. As the discharge is still relatively low, the scouring process that occurs in the walls of the vortex has not significantly increased the volume of scour. But if the jet flow further increased up to a certain value, then the process of scouring especially on edge vortex (see Figure 3a) began to significantly reduces the thickness of the visible unity of sediment in it.
 | Figure 3. Shapes and sizes of initial to full fluidization condition |
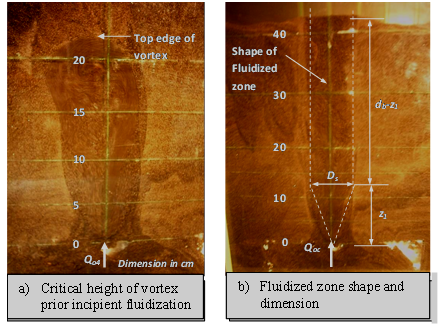
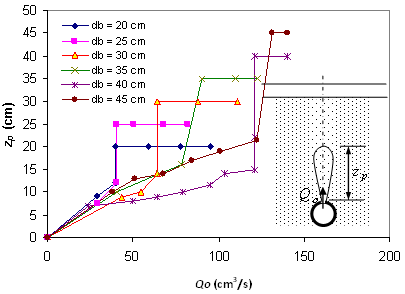
4.2. Critical Vortex Dimension
- The vortex size in prefluidization stage will be enlarged along with the increasing flow through the jet hole. Figure 4 shows the development graph of vortex height (zp) until it reaches a critical height (zc) and finally followed by bursts at the sediment surface as the mark for fully fluidization stage. Six test results at different sediment thickness were described in the relationship ofQo - zp. The thicker the sediment the greater the flow rate required to produce critical height of vortex.The critical height of vortex will grow itself at a constant flow rate up to bursts occured at the sediment surface. By calculating the ratio of zc to db on 16 test results, it is obtained that the incipient fluidization will be achieved in the average ratio of zc/db= 0.5.When zpis approximate to 0.5db, than the scouring at the top edge of vortex will develop dynamically to increase the vortex height at a constant discharge. The duration of this critical condition until bursts occured in experimental conditions ranging from 0.5 - 3 minutes.Description of detailed processes in all stages under pre to initial fluidization have given well understanding in the mechanism of single vertical jet fluidization as the basic references for futher development research of fluidization system. Graph model for the mechanism of vertical jet fluidization using internal vortex characteristics observed from 2 dimensional experiments can be explained in the Figure 5.At the low discharge (Qo1),the maximum heightof vortex is formed in front of jet hole within time t1 is zp-1. If the discharge increasing to Qo2 than the height of vortex increases logarithmically until it reaches a maximum value of zp-2 and will be constant after reaching the time t2. If the critical height of vortex (zc) is a little bit above the zp-2 then a slight increase of discharge may make the flow rate will become a critical flow ratefor fluidization (Qoc). Processes observed at Qoc can be seen in Figure 5 where from point A to B in time (t3-t2) scouring speed becomes very high at the top edge of the vortex then become slow in the time of (t4-t3) until reaching point C. When the vortex has reached the point C then a surface layer of sediment is slowly lifted causing the sediment surface becomes higher than surrounding area. Within a very short time (t5-t4) bursts occured on the surface of the bed as indication that the full fluidization is reached and the flow system changed from Darcy to non-Darcy flow having characteristics like flow in tube. As known that the fluidization is achieved when the weight of the sediment in the water has been compensated by the pressure of working from the bottom. This can be explained that scouring mechanism serves to reduce the volume of sediment layers on it until the bottom pressure can finally balanced even greater than the weight of these sediments.
4.3. Fluidization Gradient Hydraulics
- When the vortex reaches a critical height ratio zc/db = 0.5 the flow and pressure at the time of discharge and the critical pressure is causing fluidization. Phenomenon at this moment is interesting to be investigated in more detail therefore the experiment was continued to measure the hydraulic head at a point surrounding 0.5dbabove jet hole using a piezometer. This test is intended to get an idea of the development of the hydraulic gradient (dh/z) ranging from prefluidization to full fluidization. Figure 6 presents the experimental results the relationship of Qowith dh/z for sediment thickness of 30 cm and 40 cm of each with 2 tests in the position of the observation point A.
 | Figure 4. The development of vortex height in the pre to fully fluidization stage |
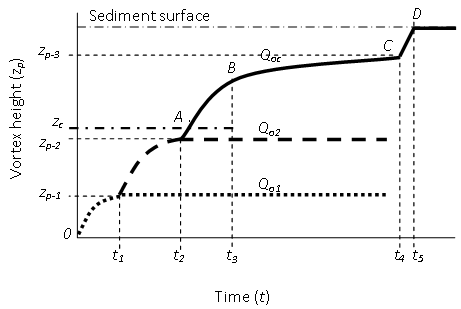 | Figure 5. The model of pre to fully fluidization mechanism using vortex characteristics in relationship of zp, t & Qoc |
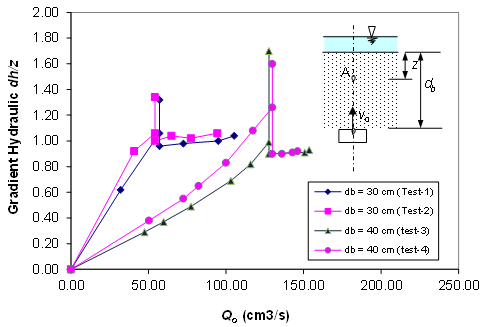 | Figure 6. Characteristics of gradient hydraulic for db = 30 cm and db = 40 cm |
4.4. Hydraulics Head Distribution
- Vertical jet fluidization experiments on 40 cm thickness of sand layer had been performed to describe the distribution of hydraulic head on three conditions, namely prefluidization conditions, incipient fluidization and fully fluidization. Figure 7 presents the contour map equipotensial in the medium sand bath.Hydraulics head were measured at 42 points using piezometer. Distribution of hydraulics pressure for the stage of prefluidization with Qoc = 0.072 l/sec are shown in Figure 7a, the incipient fluidization stages by Qoc = 0.104 l/sec are shown in Figure 7b and fully fluidization by Qoc = 0.142 l/sec are shown in Figure 7c. The equipotensial contour approaching a circle on prefluidization stage indicates that the distribution of the flow is spread fairly even. The hydraulic head contour lines on the area near the hole jet (Figure 7b) are more dense than the outer regions, showing a loss of energy in this area is greater than the outer regions.Changes in equipotensial contour lines from a circle on the prefluidization to the elliptical shape in the stages of Incipient fluidization, indicatethe mobilization of concentrated flow increase is due to rising of hydraulic works. Flow core is formed after the tube flow bursts on the surface and the fluidized sediment became separated from the unity of the deposit. Elliptical shapes in Figure 7b were changed to a boxy shape when discharge is increased from initial to full fluidization (Figure 7c), characterized by hydraulic head contour lines in the flat zone flow axis. Larger flow rates exacerbated the flow tube cross section as well as enlarged the fluidized zone diameter anyway.Figure 8 presents the results of other tests with 3 kinds of deposite thickness of 20 cm, 30 cm and 40 cm in which the hydraulic headin vertical distribution is described in the flow axis to show the hydraulic head changes from jet hole to the surface sediments.Figure 8 shows that the largest portion of energy loss during the initial fluidization between the hole to a distance of 10 cm in front of the hole with a loss of head about 90%.
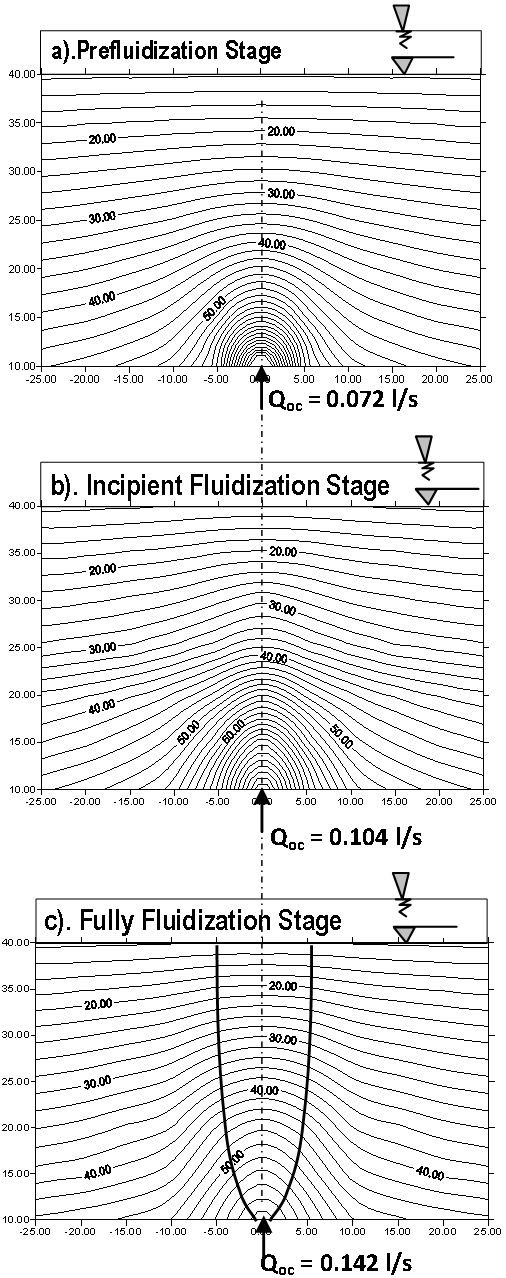 | Figure 7. Contour map of equipotential distribution in 3 stage of vertical jet fluidization |
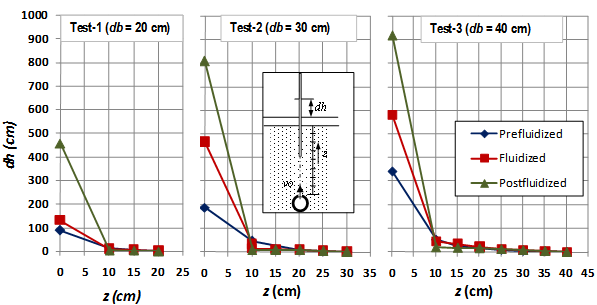 | Figure 8. Vertical distribution of hydraulic heads for sediment thickness of 20 cm; 30 cm and 40 cm |
5. Conclusions
- 1. The achievement of unbounded domain incipient fluidization can be explained by the height dimensions of internal vortex where the critical height of vortex (zc) is obtained at least half of the thickness of the sediment (db).2. Experiment results show that about 90% of high-energy loss occurs within 10 cm of the hole. There is closed sufficient to the results of Lennon and Weisman in[2].3. The shaped of equipotensial line spacing at initial and full fluidization stage can be one indication that the theory of net flows based on Darcy's law is no longer suitable in fluidization conditions.4. Linear increase in the value of the pressure gradient (dh/z) were measured in sediment deposition on Qo indicates the flow conditions at the pre fluidization stage still follows Darcy equation. At the higher value of Qo approach to critical condition, the value of dh/z values increase sharply from 1 to 1.3 for d = 30 cm and from 1.2 to 1.7 for the value of d = 40 cm shows that the fluidization is in critical condition. Increased dh/z takes place in a few seconds with the increase in the culmination of work scouring internal vortex flow eventually sprayed on the surface and the value of dh/z dropped dramatically to a value ranging from 1 indicating fluidization has occurred. At this stage there is a change of flow type Darcy flow to non-Darcy flow. The results also correspond well with the results obtained by Weisman et al. in[10] and the theoretical value dh/z = 1.
ACKNOWLEDGEMENTS
- With the completion of the research and this paper, the authors express thanks and appreciation to Prof. Nur Yuwono, Prof. Radianta and Prof. Nizam as the supervisor for research, until research can be done well.