-
Paper Information
- Previous Paper
- Paper Submission
-
Journal Information
- About This Journal
- Editorial Board
- Current Issue
- Archive
- Author Guidelines
- Contact Us
International Journal of Hydraulic Engineering
p-ISSN: 2169-9771 e-ISSN: 2169-9801
2013; 2(2): 28-33
doi:10.5923/j.ijhe.20130202.02
Simulation of Event Based Runoff Using HEC-HMS Model for an Experimental Watershed
 Abstract
 Reference
 Full-Text PDF
 Full-text HTML
Reshma T, Venkata Reddy K, Deva Pratap
National Institute of Technology, Warangal, India
Correspondence to: Reshma T, National Institute of Technology, Warangal, India.
| Email: |  |
Copyright © 2012 Scientific & Academic Publishing. All Rights Reserved.
Estimation of accurate runoff for a given rainfall event is a difficult task due to various influencing factors. Several computer based hydrological model have been developed for simulation of runoff in watershed and water resource studies. In this study, Hydrologic Engineering Center –Hydrologic Modeling System (HEC-HMS) hydrological model has been used to simulate runoff process in Walnut Gulch watershed located in Arizona, USA. To compute infiltration, rainfall excess conversion to runoff and flow routing, methods like Green-Ampt, Clark’s Unit hydrograph and Kinematic wave routing were chosen. The model has been calibrated and validated for the seven rainfall events. From the results, it is observed that HEC-HMS model has performed satisfactorily for the simulation runoff for the different rainfall events.
Keywords: GIS, HEC-HMS, Runoff, Experimental Watershed
Cite this paper: Reshma T, Venkata Reddy K, Deva Pratap, Simulation of Event Based Runoff Using HEC-HMS Model for an Experimental Watershed, International Journal of Hydraulic Engineering, Vol. 2 No. 2, 2013, pp. 28-33. doi: 10.5923/j.ijhe.20130202.02.
Article Outline
1. Introduction
- One of the common analyses in hydrology is surface runoff estimation in a watershed based on rainfall distribution. Since measurement of all parameters which effect watershed's runoff is impossible, choosing a suitable model with simple structure, minimum input data requirements and reasonable precision is essential. One of the hydrologic models that meet these criteria is Hydrologic Engineering Center-Hydrologic Modeling System (HEC-HMS) which has been used widely in different studies. Knebl et al developed a framework for regional scale flood modeling that integrates NEXRAD Level III rainfall, GIS, and a hydrological model (HEC-HMS/RAS) [1]. Masoud et al presented an overview on (HEC-HMS) hydrological model which was used to simulate the flow in the hydrological units of the area. The results indicate that sub-basins located near the output point of the area have a stronger role in flood development [2]. Majidi and Shahedi estimated the surface runoff in a watershed based on the rate received precipitation and quantifying discharge at outlet [3]. Hadi et al used HEC-HMS and Hydrologic Engineering Center-River Analysis System (HEC-RAS) models to simulate runoff in Karun River, Iran. The modelling framework presented in their study incorporates a portion of the recently develop GIS tool named map to map that was created on a local scale and extends it to a regional scale [4]. From the above studies, it indicates that HEC-HMS model can be an effective tool for accurately simulating the hydrology for watersheds. The present study describes the application of HEC-HMS model for a well monitored experimental watershed having a good database of hydrological parameters.
2. Study Area and Methodology
2.1. Study Area
- Walnut Gulch Experimental watershed is located in Arizona State of United State of America (USA). It was established in the early 1950's to study the role of watershed treatments on downstream water yield [2]. Rainfall and runoff instrumentation on Walnut Gulch Experimental Watershed was installed in 1954-55. Initially 20 number of rain gauges has been installed but, later around 88 rain gauges have been installed (www.tucson.ars.ag.gov).Soils of the Walnut Gulch Experimental Watershed are dominantly sandy, gravely loams that vary from deep, relatively mature, and well drained soils to thin, immature soils. Major watershed vegetation includes the grass species and shrub species. The climate is classified as semi-arid, with mean annual temperature of 17.7°C and mean annual precipitation of 350 mm. Elevation of the watershed ranges from 1250 m to 1585 m. The Walnut Gulch consists of 42 major sub watersheds [5]. The sub watershed which is selected in the present study for the application of HEC-HMS model has an area of 7.8 sq.km. The location map of study sub watershed is shown in Figure 1.
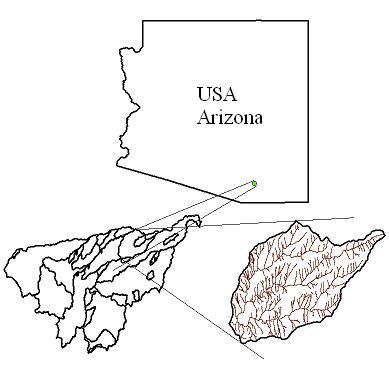 | Figure 1. Location map of Study Sub watershed of Walnut Gulch watershed |
2.2. HEC-HMS Application
- HEC-HMS model with different modeling tools for hydrological processing have been applied for the sub watershed of Walnut Gulch Experimental Watershed.The selected sub watershed has an area of 7.8 sq km. Digital Elevation Model (DEM), Land Use/Land Cover (LU/LC), soil and rainfall data have been downloaded from the website (http://www.tucson.ars.ag.gov/dap//). The DEM of sub watershed is shown in Figure 2. The input data required for the HMS model has been prepared using HEC-GeoHMS model as shown in Figure 3. HEC-GeoHMS creates background map files, basin model files, meteorologic model files, and a grid cell parameter file which can be used by HEC-HMS to simulate runoff [6].
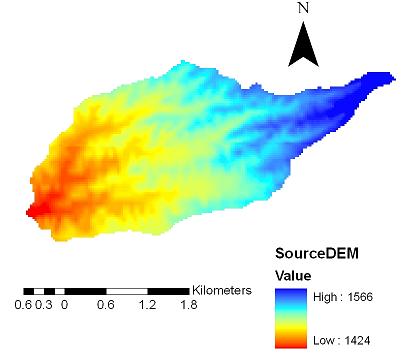 | Figure 2. Digital Elevation Model of Sub watershed of Walnut Gulch Watershed |
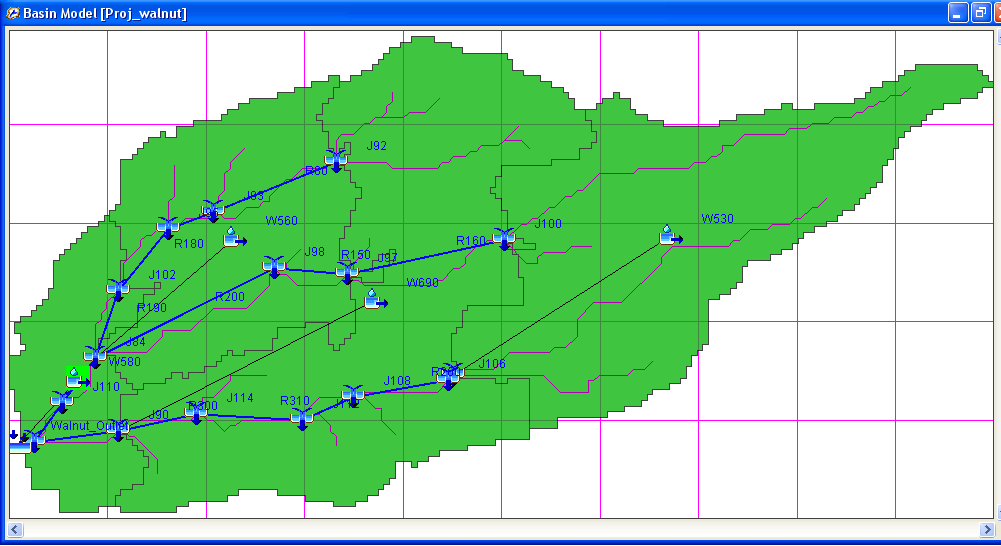 | Figure 3. Delineation of Small watersheds for the Sub watershed of Walnut Gulch using HEC-GeoHMS |
2.2.1. HEC-HMS Description
- Hydrologic Engineering Center-Hydrologic Modelling System (HEC-HMS) is developed to simulate the rainfall-runoff processes of watershed. Model includes seven methods for transforming excess precipitation into surface runoff and six hydrologic routing methods. Hydrographs produced by this model can be used to solve various water resources engineering problems. The model can also be applied for watershed of different geographic regions[6].
3. Results and Discussions
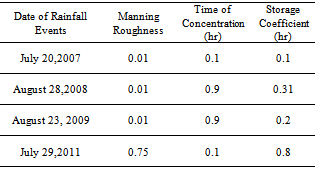
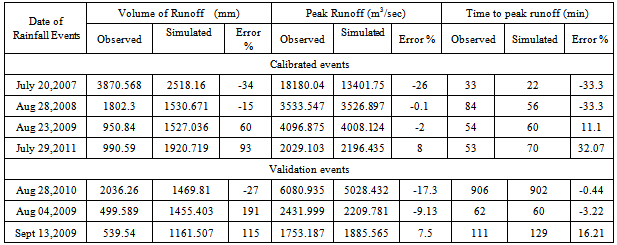
- The HEC-HMS model has been applied for 7 rainfall events of sub watershed of Walnut Gulch watershed. The model has been calibrated for four rainfall events and validated for three rainfall events. The calibration parameters for rainfall events are given in Table 1. The observed and simulated hydrographs for four calibrated rainfall events are shown in Figure 4. The observed and simulated hydrographs for three validation events are shown in Figure 5. The observed and simulated values viz. volume of runoff, peak runoff and time to peak runoff for the calibration and validation events are given in Table 2.
|
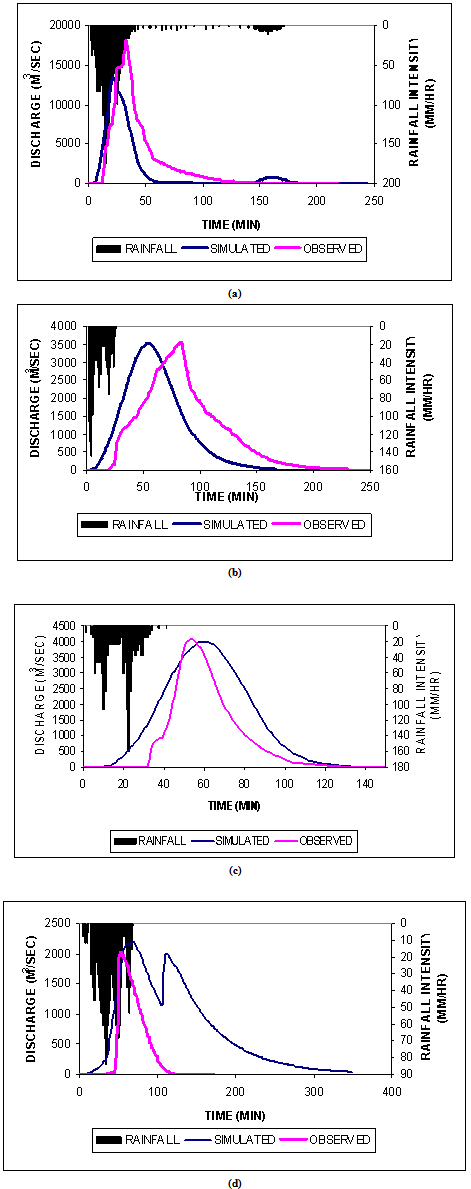 | Figure 4. Observed and simulated hydrographs for the Walnut Gulch watershed (a) July 20, 2007 (b) August 28, 2008 (c) August 23, 2009(d) July 29, 2011 |
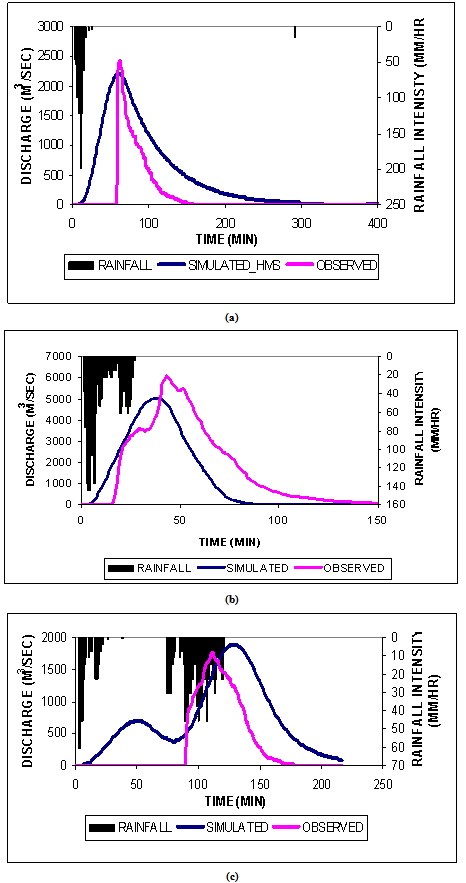 | Figure 5. Observed and Simulated hydrographs for validation events of Walnut Gulch watershed (a) August 04, 2009 (b) August 28, 2010 (c) September 13, 2009 |
|
4. Conclusions
- The present paper describes the application of HEC-HMS model for Walnut Gulch experimental watershed which is located in Arizona, USA. The HEC-HMS model has been applied for the seven rainfall events. The model does not require detail information about the parameters and gives reasonable results. The model has been calibrated for four rainfall events and validated for three rainfall events. The simulated results have been compared with the observed hydrographs. From the simulation of calibration events, it is seen that volume of runoff and time to peak has simulated more variation, when compared to the observed hydrographs. But the peak runoff has been simulated with less variation. From the model simulations, the performance of HEC-HMS model for event based runoff simulation seems to be satisfactory.
ACKNOWLEDGEMENTS
- Our sincere thanks to Mr.Jeffry J. Stone, Hydrologist, USDA-ARS Southwest Watershed Research Center, for giving valuable suggestions in downloading the hydro-meteorological database of the Walnut Gulch watershed from the online data access website of USDA-ARS Southwest Watershed Research Center.