-
Paper Information
- Next Paper
- Previous Paper
- Paper Submission
-
Journal Information
- About This Journal
- Editorial Board
- Current Issue
- Archive
- Author Guidelines
- Contact Us
International Journal of Hydraulic Engineering
p-ISSN: 2169-9771 e-ISSN: 2169-9801
2012; 1(6): 68-74
doi: 10.5923/j.ijhe.20120106.02
Lee Angle Effects in Near Bed Turbulence: An Experimental Study on Low and Sharp Angle Dunes
 Abstract
 Reference
 Full-Text PDF
 Full-Text HTML
Artemis Motamedi1, Hossein Afzalimehr1, Jacques Gallichand2, Elham Fazel Najaf Abadi1
1Deptartment of Water Engineering, Isfahan Univ. of Technology, Isfahan, 84156, Iran,
2Département des sols et de génie agroalimentaire, Pavillon Paul-Comtois, Université Laval, St-Foy, QC, Canada
Correspondence to: Artemis Motamedi, Deptartment of Water Engineering, Isfahan Univ. of Technology, Isfahan, 84156, Iran,.
| Email: |  |
Copyright © 2012 Scientific & Academic Publishing. All Rights Reserved.
This research presents recent advances on morphodynamic modeling over gravel dunes. Boundary-layer separation over gravel fixed dunes is investigated by Acoustic Doppler Velocimetry (ADV). Using the measurements of flow over dunes at laboratory scale, examined the influence of dune lee sides on the separation of flow. Experiments were conducted in a horizontal flume. A train of 2D fixed dunes were installed on the bottom of the flume starting just downstream of the entrance on the flume. Experiments were carried out using 2 types of dunes with different lee slopes, (38 and 8 degree). The results of quadrant analyses base on the stress fraction SHf versus the hole size at two elevations near the bed and near water surface for two angles of lee side, ,at the central axis of the flume also investigated. Both experimental observations and quadrant results were in agreement about the influence of dune characteristics on the flow separation in different dune lee angles.
Keywords: Quadrant analysis, Lee Angle, ADV, Separation Zone
Cite this paper: Artemis Motamedi, Hossein Afzalimehr, Jacques Gallichand, Elham Fazel Najaf Abadi, "Lee Angle Effects in Near Bed Turbulence: An Experimental Study on Low and Sharp Angle Dunes", International Journal of Hydraulic Engineering, Vol. 1 No. 6, 2012, pp. 68-74. doi: 10.5923/j.ijhe.20120106.02.
Article Outline
1. Introduction
- In rivers, complex interactions between turbulent flow, sediment transport and bed morphology give rise to various types of river bed configurations. Based on flow regimes, the river bed can be either plane or covered by ripples, dunes, or anti-dunes or combinations thereof. In sandy or gravel-bed rivers, with subcritical turbulent flow, typically river dunes are formed (e.g.[1-6]). The flow over dunes has been studied widely to understand the effect of bed shape on the flow and the mechanisms of bed and suspended load transport of sand bed rivers. However, compared to flow over smooth beds, mean flow characteristics, distributions of turbulent velocities, bed shear-stresses, and turbulence intensities differ significantly due to the bed deformation (e.g.[7],[8]). Many researches have been conducted in laboratory flumes to understand the effect of dune size on velocity distribution and separation zone (e.g.[9-12]). A general dune shape is depicted in Fig. (1).In order to clarify the flow field near the bed, velocity profiles are presented by ADV near the bed and the objective of this study is to investigate the influence of the dune lee sides on flow separation. Moreover in this research the results of normalized quadrant magnitudes of the momentum flux are presented at the center of flume of two different dune lee sides.
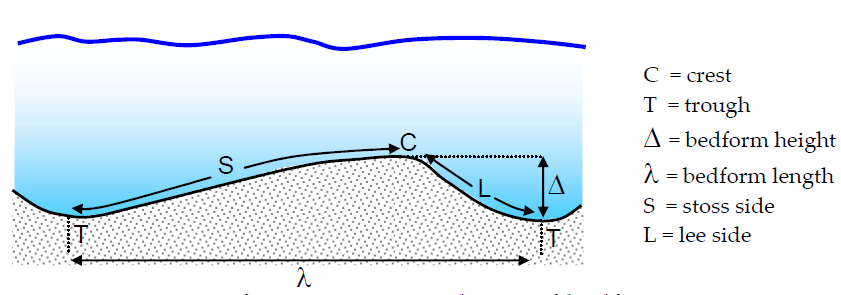 | Figure 1. Longitudinal schematic of dune |
2. Experimental Set-up
2.1. Physical Model
- Experiments were carried out in a rectangular flume at Institute of Hydraulic Engineering and Water Resource Management of Technical University of Graz, Austria. The horizontal flume was 12 m long, 0.76 m wide and 0.95 m deep. A train of 2D fixed dunes were installed on the bottom of the flume starting just downstream of the entrance of the flume and extending 8 times over the entire length of the flume. The 2D dunes had fairly regular spacing, heights, and lengths. Dunes were prepared with well-sorted gravel particles with a d50=5.8 mm Experiments were carried out by using 2 types of dunes of 1m length, with an angle of lee slope (α) of 38°and dune height (Δ= 4cm) for Dune 1, also with an angle of lee slope (α) of 8°and (Δ= 4cm) for Dune 2. The schematic views of the dunes for this study are shown in Fig. (2).
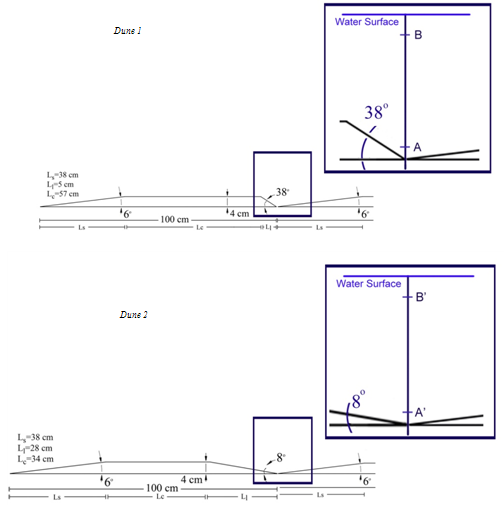 | Figure 2. Sketches of dunes , sharp angle (Dune 1) and low angle (Dune 2) |
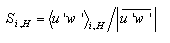
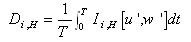
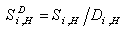
2.2. Quadrant Analysis
- Three conditional sampling techniques include wavelet analysis, quadrant analysis, and variable interval time averaging (VITA) technique are well established tools for identifying structures that allow specific flow features to be extracted from experimental data. One of most frequently used conditional sampling techniques is the quadrant analysis of the Reynolds shear stress (e.g.[17-20]). In quadrant analysis, the shear stress is decomposed into four quadrant events[17]. The events in quadrant i=2 and i=4 contribute positively to the downward momentum flux, and are involved in turbulence near-bed bursting[21]. These two events are usually called ejections and sweeps, respectively.At any point in a steady flow, the contribution to the total Reynolds stress from quadrant i, excluding a hyperbolic hole region of size H, is given by
 | (1) |
 | (2) |
 | (3) |
 | (4) |
 | (5) |
3. Results
3.1. Contour maps
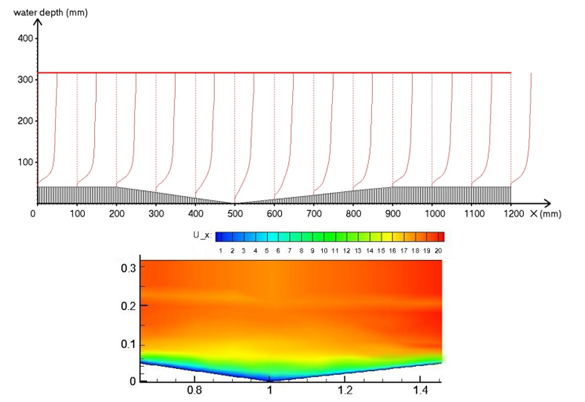
- In this section ADV results are studied. To achieve a better graphical scheme, new graphical software was developed. Fig. (3) shows the measured velocity profiles over sharp angle dunes and (=4cm), collected by ADV for a flow rate of 30 lit/s and water depth of 32 cm. The negative velocity profiles which cause the separation region is created downstream of the crest. The measured velocity profiles using ADV for the same hydraulic situation over low lee angle dunes with flat crest are presented in Fig. 4.
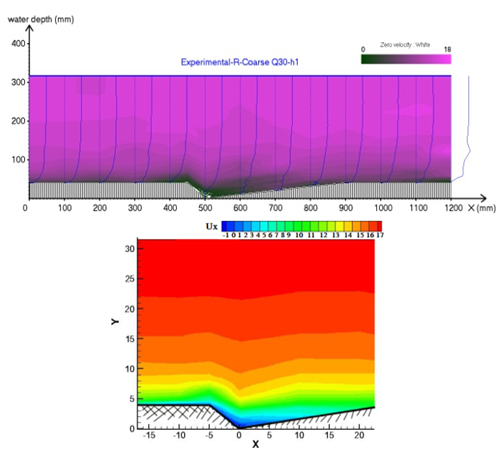 | Figure 3. (Left) Measured velocity profiles with ADV over sharp angle dunes (=4 cm, α=38°), (Right) Contour map of negative velocities in the interaction of two dunes |
 | Figure 4. (Left) Measured velocity profiles over low lee angle dunes (=4 cm, α=8°), (Right) Contour map of positive velocities in the interaction of two dunes |
|
3.2. Quadrant analysis (Q= 30 lit/s & Water Depth= 31.7 cm)
- The relative importance of short-lived events of large magnitude is demonstrated by performing a quadrant analysis with an excluded hole regions of various sizes (Shaw et al 1983). Fig. (5-a) shows the stress fraction SHf (sum of the four quadrant fractions) versus the hole size at two elevations y/h = 0.01 (Points A and A′in Fig. 2) and y/h = 0.7 (Point B and B′ in Fig. 2) for two angles of lee side, low angle 8˚ and sharp angle 38˚,at the central axis of the flume. The changes of hole size from zero to 2.5 has no effect on the stress fraction (SHf) and as expected, increasing the hole size decreases the sum of the four quadrant fractions (SHf) expect for the point at near the bed in low angle (for point A′ with y/h=0.016). This can also be attributed to negative sign Reynolds stress at y/h =0.13 in Fig.5. The stress fraction decreases more quickly near the bed than near the water surface with the change of hole size for sharp angle. For point A with y/h = 0.009, near the bed for sharp angle, about 50% of the stress is from large magnitude events (H =5), and for other values of y/h, the same percentage of the stress is from stronger events (H ≥ 8). Also we can see a slow decrease or increase for those point that stream wise velocity is positive in them, but for one point that sign stream wise velocity is negative, its change is sharp.
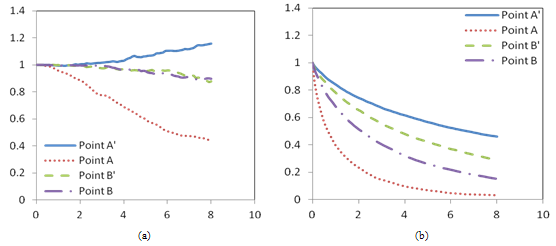 | Figure 5. The sum of all four quadrant fractions with an excluded varying hole size. (a) Stress, (b) Duration |
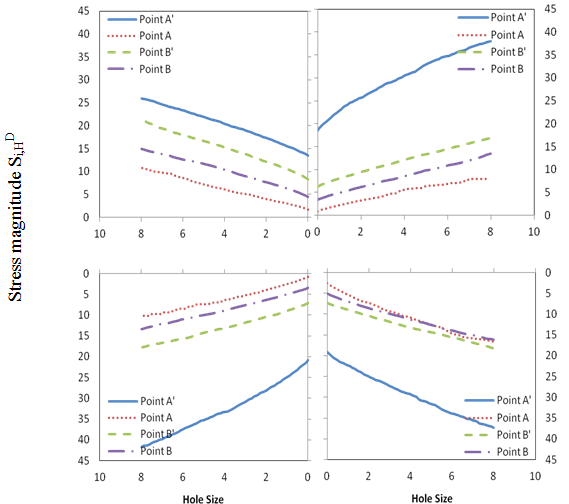 | Figure 6. Stress magnitudes Si,HD |
- Fig. (5-b) shows the duration DH versus the hole size at the two elevations for two angles of lee side. As showed in Fig (5-b), for low angle shape, duration change rate is slower at near the bed than that point near the water surface. Reversely for sharp angle shape, this rate is slower for the point at near the water surface. In all at the same of stress fraction profiles, for point A with y/h=0.009 that negative velocity and thus flow separation is occurred, duration rate with variation H is sharp. It means the 78 percent of momentum flux is occurred with a sharp slope until H=2. Fig. (5-b) shows that a relatively large fraction of the total stress occurs in small durations (fractions of total time). For example, in Fig. (5-b) at H = 5, one half of the stress fraction is due to the events occurring 8% of the duration for sharp angle at near the bed (point A with y/h< 0.009). Similar results were reported by Shaw et al. (1983) and Yue et al. (2007), demonstrating that much of the momentum flux is transported during periods of strong turbulence activity occurring over short durations. This result was not observed for relative depth values for low angle shape, (A′ and B′ points, e.g. y/h=0.016 & 0.74). The normalized quadrant magnitudes of the momentum flux defined in equation (5) are presented at the center of flume in Fig. (6) where the magnitude of the momentum flux augments with the hole size because of short durations at the large hole sizes and the relatively high magnitude of the events. Fig. (6) shows that for sharp angle (38˚) the sweep interaction has the largest stress magnitude until H=5 near the water surface (Point B with y/h=0.72) and after H=5 the relationship is reversed. Whiles for other three interactions, they have larger stress magnitude near the water surface for all H values. On the other hand for low angle (8˚), all of interactions have the largest values at near the bed. Those differences are high for three of interactions (outward, inward, and sweep) that it maybe caused by negative shear stress. In all the largest stress magnitude is for inward interaction at near the bed in low angle shape where the Reynolds stress value is negative. Totally for sharp lee angle, sweep is predominant event for both near bed and near the water surface points; but for low lee angle near the bed, where there is not any separation phenomenon, outward and inward events have large contribution to shear stress values.
4. Discussion
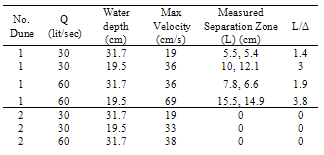
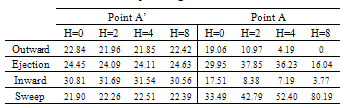
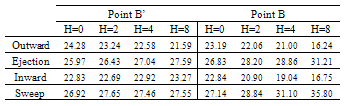
- This study reveals that flow over low-angle models shows no separated permanent flow on the leeside of dunes (the same as the results in[25], since sharp angle dunes over the bed have a considerable effect on the flow structure and they cause the flow to or not to separate in different flow regimes.With regard to the length of the measured separation zone, the average ratio of L/Δ is different from 1.4 to 3.8 in Dune (1) which are less than the values reported in the literature (5.8 in[26] and 6 in[11]) and close to other studies[24]. On the basis of the laboratory experiments, this research also presents the effect of water depth and roughness on the flow structure over dunes. Comparing the separation lengths of the same two dunes (the same dimensions and particle) with the same water velocity shows that if the water depths are not the same in these two mentioned situation, the larger separation zone belongs to the lower water depth conditions.The quadrant analyses of normalized quadrant magnitudes of the momentum flux show that for sharp lee angle dunes which have a separation zone, the sweep interaction has the largest stress magnitude and for low lee angle dunes without separation, the inward interaction has the largest stress magnitude near the bed. The result of the percentage of each quadrant in different zones near beds (A & A’) and water surfaces (B & B’) are presented in tables 2 and 3.
|
|
ACKNOWLEDGEMENTS
- I would like to express my gratitude to all those who gave me the possibility to complete this research. I want to give my special thanks to Prof. Gerald Zenz, head of the Institute of Hydraulic Engineering and Water Resource Management, Graz university of Technology, Austria for his kind cooperation with the Isfahan Technical University, Iran for the support of my PhD project.