-
Paper Information
- Paper Submission
-
Journal Information
- About This Journal
- Editorial Board
- Current Issue
- Archive
- Author Guidelines
- Contact Us
International Journal of Hydraulic Engineering
p-ISSN: 2169-9771 e-ISSN: 2169-9801
2012; 1(1): 5-9
doi:10.5923/j.ijhe.20120101.02
Simulation of Rainfall-Runoff Process Using Green - Ampt Method and HEC-HMS Model (Case Study: Abnama Watershed, Iran)
 Abstract
 Reference
 Full-Text PDF
 Full-text HTML
1Graduate Watershed management, Natural Resources Faculty, Hormozgan University, Iran
2Natural Resources Faculty, Sari Agricultural Sciences & Natural Resources University, Iran
Correspondence to: A. Majidi, Graduate Watershed management, Natural Resources Faculty, Hormozgan University, Iran.
| Email: |  |
Copyright © 2012 Scientific & Academic Publishing. All Rights Reserved.
Estimation of surface runoff in a watershed based on the rate of received precipitation and quantifying discharge at outlet is important in hydrologic studies. In this study, HEC-HMS hydrological model version 3.4 was used to simulate rainfall-runoff process in Abnama watershed located in south of Iran. To compute infiltration, rainfall excess conversion to runoff and flow routing, methods like Green-Ampt, SCS Unit hydrograph and Muskingum routing were chosen, respectively. Rainfall-runoff simulation has been conducted using five rainstorm events. Initial results showed that there is clear difference between observed and simulated peak flows. Therefore model calibration with optimization method and sensitivity analysis has been done. The results showed that lag time is sensitive parameter. Model validation using optimized lag time parameter showed reasonable difference in peak flow. Finally it can be concluded that model can be used with reasonable approximation in hydrologic simulation in Abnama watershed.
Keywords: Rainfall-Runoff simulation, HEC-HMS, Green-Ampt, Abnama watershed, Iran
Cite this paper: A. Majidi, K. Shahedi, Simulation of Rainfall-Runoff Process Using Green - Ampt Method and HEC-HMS Model (Case Study: Abnama Watershed, Iran), International Journal of Hydraulic Engineering, Vol. 1 No. 1, 2012, pp. 5-9. doi: 10.5923/j.ijhe.20120101.02.
Article Outline
1. Introduction
- One of the common analyses in hydrology is surface runoff estimation in a watershed based on rainfall distribution. Regarding watersheds real situation due to lack of sufficient data in one hand and complexity of hydrological systems on the other hand causes inevitable use of rainfall-runoff simulation models. Since measurement of all parameters affect watershed's runoff is impossible, choosing a suitable model whit simple structure, minimum input data requirements and reasonable precision is essential[18]. One of the hydrologic models that meet these criteria is HEC-HMS which has been used widely in different studies[5,19,11,8,4]. Shaghaeghi fallah applied HEC-HMS model to simulate river flow in Mohammadabad watershed (located in north of Iran). The results indicated that the model calibration needs accurate information. Simulation results were reliable and valid in compare to observational data[17]. Al-ahmadi has done rainfall-runoff modeling using HEC-HMS, GIS and RS in three subbasins in southwestern Saudi Arabia. He performed the model run with automatic calibration method and obtained credible results[2]. McColl and Aggett used HEC-HMS model to predict land use patterns. They extracted watershed characteristics by HEC- GeoHMS and GIS technique and also used SCS unit hydrograph method for runoff estimation. Considering initial loss as sensitive parameter and choosing mean squares error method for model calibration, the results showed that HEC-HMS model has high predictability[13]. Radmanesh et al calibrated and validated the HEC-HMS model in Yellow River watershed in southwestern Iran. The results showed good fit between the peak discharge of observed and simulated hydrographs[15]. Momcilo et al applied HEC-HMS model in northeastern Illinois to study changes in peak flow due to precipitation increase at 12 stations using daily rainfall data[14]. Kafle et al have studied the effect of rainfall on runoff generation in Bagmaty basin (Vietnam) with HEC-HMS model. The results showed that simulated peak flow is very close to the observational ones[9]. Yusop et al have studied runoff characteristics using HEC-HMS model in Oil Palm catchment in Malaysia and obtained satisfactory results[20]. Sabzevari et al studied rainfall-runoff simulation with HEC-HMS model and GIS technique in Kasilian watershed in north of Iran. The results showed that the simulation results have mean error of 10 – 15% which seems acceptable[16]. Khodaparast et al have studied the comparison between SCS and Snyder unit hydrograph methods in runoff rate estimation by HEC-HMS model in Torogh dam watershed, Iran. The results demonstrated that SCS unit hydrograph method is more reliable in calculating the rate of runoff[10]. Regarding the importance of peak flows in the design of watershed structures, dams and in planning related to soil and water conservation measures, in this study HEC-HMS model, Green-Ampt method and GIS technique were applied to estimate streamflow in Abnama watershed.
2. Data and Methodology
2.1. Study Area
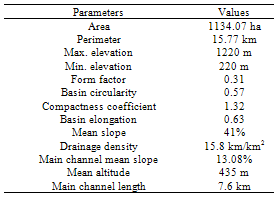
- Abnama watershed is located in Hormozgan province, between 57° 12' 57" to 57° 15' 32" E and 27° 28' 41" to 27° 31' 13" N. Its area is 1134.07 hectares and it has been divided to 7 hydrological units based on drainage pattern. Its maximum elevation is 1220 m and its minimum elevation is 220 m in the watershed outlet. The mean annual rainfall is 185 mm, total area covered with sandy loam and silt-loam soil textures and its land use included rangeland and bare land. About 51% of the watershed is mountainous area. Watershed soils based on SCS classification and FAO methods divided to three groups (B, C and D). Figure (1) and table (1) show Abnama watershed location and its physiographic characteristics.
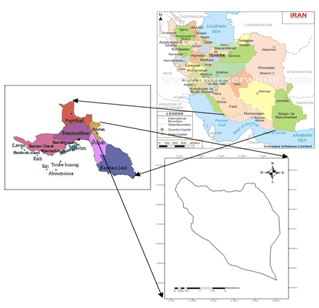 | Figure 1. Abnama watershed location |
|
2.2. Study Method
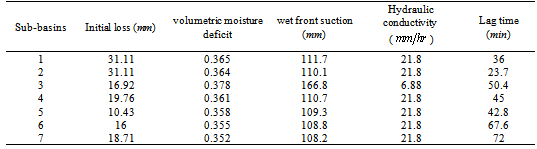
- Abnama watershed's boundary was defined in ArcGIS 9.3 software using topography map in 1:25000 scale. For rainfall-runoff simulation HEC-HMS model, version 3.4 was used. To run the model it is necessary to complete sub- models which one of them is watershed loss. For this sub-model, Green-Ampt infiltration method was selected. Green-Ampt model is a conceptual model to calculate rainfall loss in permeable surfaces in a specific period. Initial loss, hydraulic conductivity, wet front suction, volumetric moisture deficit and percentage of impervious surfaces are input parameters in loss sub-model. Values of curve number (CN) obtained for each sub-basin using raster maps prepared from soil hydrologic groups and land use layer in ArcGIS 9.3 software. Then initial loss values for each sub-basin were determined from CN values. The hydraulic conductivity, wet front suction and volumetric moisture deficit parameters obtained from soil profiles at 0-30 cm depth. Percentage of impervious surface for each sub-basin determined using topography map with 1:25000 scale in ArcGIS. To convert excess rainfall to runoff, SCS unit hydrograph method was selected and values of lag time were introduced to the model for each sub-basin. The base flow was deducted from observed hydrographs and the model was run without base flow. To run the model in event base, observed hourly hydrographs and their corresponding hourly hyetographs were used. These data obtained from Abnama hydrometric station and Roodan synoptic station. Selected events divided by 4 and one for calibration and validation stages, respectively. Sensitivity analysis revealed sensitive parameters. Then model validation was performed with optimum values and simulated and observed hydrographs was compared.
2.2.1. HEC-HMS Model
- The HEC-HMS model is developed version of HEC-1 under windows for surface runoff simulation in a watershed. In this model, watershed is shown as an interconnected system with hydrologic and hydraulic components. Several components are combined to simulate the basin processes and each component is representative of the factors to convert precipitation to runoff within a part of the basin which is usually considered as the sub-basin[7]. In this study, five methods including Kirpich, California, Bransby-Williams, Kerbay and SCS were used to calculate time of concentration. The model run's results indicate that using Bransby-Williams method leads to more harmony between observed and simulated hydrographs. Bransby- Williams's formula is as equation (1). Lag time (in minute) from Bransby-Williams method, based on Soil Conservation Service (SCS) suggestion is defined using equation (2).
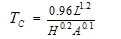 | (1) |
 | (2) |
2.2.2. Flood routing in channels
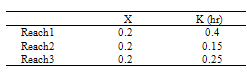
- To model flow regime in streams of Abnama watershed, Muskingum method was chosen. In this method X and K parameters must be evaluated. Theoretically, K parameter is time of passing of a wave in reach length and X parameter is constant coefficient that its value varies between 0 - 0.5. In this study X=0.2. K and X parameters are given by equations (3) and (4), respectively.
 | (3) |

 | (4) |
3. Results and Discussion
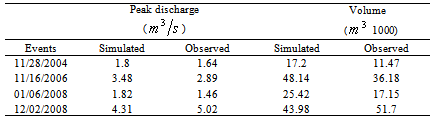
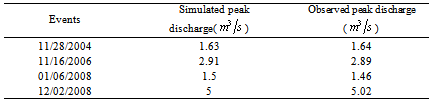
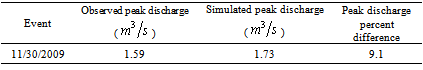
- Basin model is the most important input to run the model and simulate rainfall-runoff based over entire watershed. To create basin model in Abnama watershed, 7 Sub-basins and 3 routing reaches were chosen. The schematic drawing of Abnama watershed and its sub-basins are shown in Figure (2). The results of loss and rainfall conversion to runoff in sub-basins are presented in Table (2). Routing x and k parameters are shown in Table (3). The model was run for events 11/28/2004, 11/16/2006, 01/06/2008, 12/02/2008 and 11/30/2009. Considering calculation of rainfall amounts during five days before the event, all the events have occurred in dry antecedent moisture condition. Therefore, the model was run in dry antecedent moisture condition. From chosen events, the first four events are used for the model calibration and the last one is used for the model validation. Figure (3) shows results of the model run for event 11/16/2006 as example. The results of the model calibration are shown in Table (4).
3.1. The Model Calibration and Validation
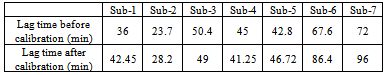
- After the simulation, first sensitivity analysis has been conducted on the parameters. Therefore lag time, initial loss, hydraulic conductivity and wet. Front suction parameters in each sub-basin changed in the range of ±%30 with %5 intervals and their effect on peak discharge were determined. The results showed that lag time is the most sensitive parameter. After determination of sensitive parameter, the model calibration was performed using optimization method and lag time parameter. Objective functions are used to compare the simulated and observed hydrographs. In this study, the objective function of Peak-Weighted Root Mean Square Error is used. To minimize the objective function and finding the optimum values, Nelder and Mead search method is used. In this method, all of the parameters are simultaneously evaluated and corrected.
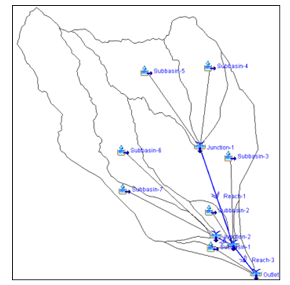 | Figure 2. Schematic view of Abnama watershed and its sub-basins |
|
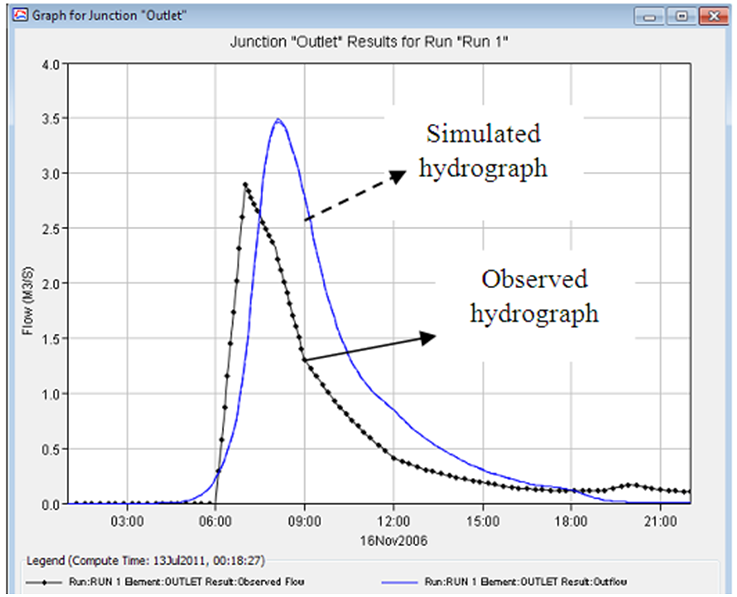 | Figure 3. Result of the model run for event 11/16/2006 |
|
|
|
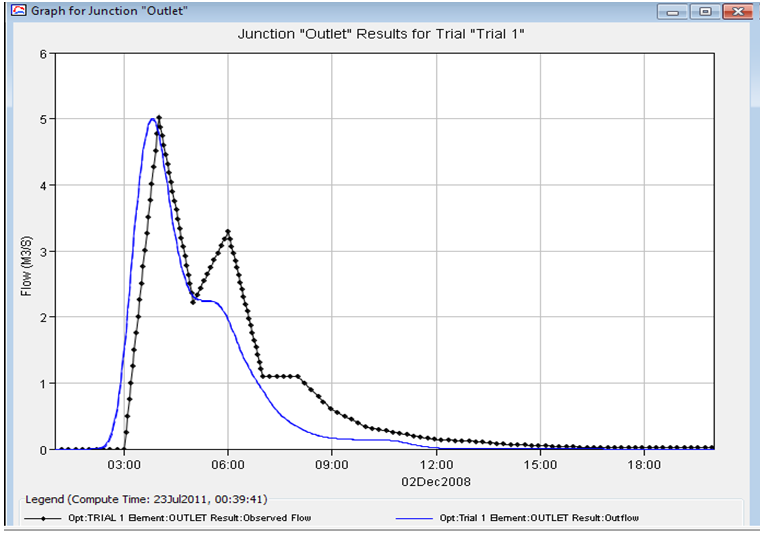 | Figure 4. The comparison of simulated and observed hydrographs for 12/02/2008 event |
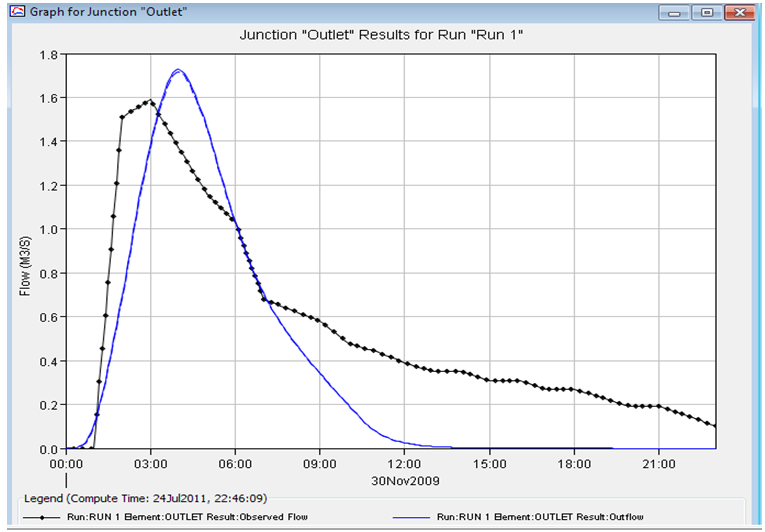 | Figure 5. Comparison of simulated and observed hydrographs for 11/30/2009 event |
|
|
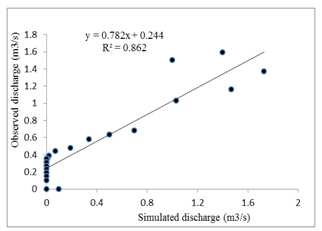 | Figure 6. Correlation between observed and simulated discharge values after the validation |
4. Conclusions
- Simulation of rainfall-runoff processes in Abnama watershed is main objective of this research. For this reason HEC-HMS model and Green-Ampt method were applied. Regarding difficulties to provide data requirements of Green-Ampt method, its application is less than other loss calculation methods. Rainfall-runoff simulation was conducted with five events, and initial results for the first four events show differences between simulated and observed discharges. Therefore the model calibration conducted to optimize the parameters. The model validation with optimized lag time values showed 9.1% difference between observed and simulated discharges. This difference is in range of 20% acceptable error[1]. The comparison of observed and simulated hydrographs and their correlation (=0.86) showed capability of the model to be used in hydrologic simulation in Abnama watershed. This result corresponds with results of studies such as Azari[6] and Amit Karaki[3].