
-
Paper Information
- Paper Submission
-
Journal Information
- About This Journal
- Editorial Board
- Current Issue
- Archive
- Author Guidelines
- Contact Us
International Journal of Genetic Engineering
p-ISSN: 2167-7239 e-ISSN: 2167-7220
2026; 14(11): 340-346
doi:10.5923/j.ijge.20261411.02
Received: Oct. 9; Accepted: Oct. 27, 2026; Published: Nov. 7, 2026

Morphometric Variability, Trait Associations and Multivariate Grouping of Mungbean [Vigna radiata (L.) R. Wilczek] Genotypes from the World Collection Evaluated in Uzbekistan
 Abstract
 Reference
 Full-Text PDF
 Full-text HTML
Elmurod A. Ubaydullayev1, Bakhtiyar Kh. Amanov1, Raykhona P. Bozorova2, Farrukh B. Abdukholikov3, 4
1Department of Genetics and Evolutionary Biology, Chirchik State Pedagogical University, Chirchik, Uzbekistan
2Samarkand State University named after Sharof Rashidov, Samarkand, Uzbekistan
3Department of Medicinal Plants and Botany, Gulistan State University, Gulistan, Uzbekistan
4International Agriculture University, Tashkent, Uzbekistan
Correspondence to: Elmurod A. Ubaydullayev, Department of Genetics and Evolutionary Biology, Chirchik State Pedagogical University, Chirchik, Uzbekistan.
| Email: |  |
Copyright © 2026 The Author(s). Published by Scientific & Academic Publishing.
This work is licensed under the Creative Commons Attribution International License (CC BY).
http://creativecommons.org/licenses/by/4.0/

Mungbean is a short-duration, protein-rich pulse that is increasingly grown as a second crop after winter wheat in Uzbekistan, but the national breeding programme relies on a narrow genetic base. Ten accessions from the world collection, originating from seven countries, and two released Uzbek cultivars (Turon and Durdona, standards) were evaluated in a field trial at maturity. Stem length (SL), root length (RL), number of leaves (LN), branches (BN) and pods per plant (PN) were recorded on five plants per genotype. Data were analysed by one-way ANOVA with Tukey’s HSD test, variability parameters, Pearson correlation, principal component analysis (PCA) and Ward’s hierarchical clustering. Genotypes differed significantly for all traits (p < 0.01). PN ranged from 31.2 (Durdona) to 115.0 (NC-17338), SL from 38.8 to 104.2 cm and LN from 21.4 to 90.4. SL, LN and PN combined high genotypic coefficients of variation (29.4–45.0%), high broad-sense heritability (> 92%) and high genetic advance as percent of mean (58.5–89.4%), whereas BN showed low heritability (30.8%). The first three principal components explained 86.5% of the total variation. Cluster analysis separated the genotypes into three groups: tall, leafy accessions (NC-32061, NC-17376, NC-33641, NC-17397, NC-17393), a high-podding group (NC-17338 and Turon), and compact genotypes with medium-to-low pod numbers (including Durdona). NC-17338 (pods per plant +55% over Turon) and NC-32061 (high pods, leaves and stem length) are the most promising donors for yield-component improvement and are recommended for multi-season and multi-location testing.
Keywords: Vigna radiata, Germplasm, Morphometric traits, Heritability, Principal component analysis, Cluster analysis, Uzbekistan
Cite this paper: Elmurod A. Ubaydullayev, Bakhtiyar Kh. Amanov, Raykhona P. Bozorova, Farrukh B. Abdukholikov, Morphometric Variability, Trait Associations and Multivariate Grouping of Mungbean [Vigna radiata (L.) R. Wilczek] Genotypes from the World Collection Evaluated in Uzbekistan, International Journal of Genetic Engineering, Vol. 14 No. 11, 2026, pp. 340-346. doi: 10.5923/j.ijge.20261411.02.
Article Outline
1. Introduction
- Mungbean [Vigna radiata (L.) R. Wilczek] is one of the most important grain legumes of Asia. It is valued for its short growing period, high nutritional quality and ability to adapt to a wide range of agro-ecological conditions. The seeds contain about 20–24% protein, dominated by globulins and albumins, as well as carbohydrates, minerals and biologically active compounds [1]. Because of its short life cycle, mungbean fits well into crop rotations as a catch crop after cereals, and it improves soil fertility through biological nitrogen fixation [2]. In Uzbekistan it is traditionally grown as a second crop after winter wheat, and its importance for diversifying irrigated cropping systems and for household nutrition is increasing.Long cultivation and selection in different ecological regions have created considerable genetic and phenotypic diversity in mungbean. Cultivated mungbean was domesticated in South Asia and later spread to East and Southeast Asia, Africa and other regions [2,3]. This diversity, conserved in world germplasm collections, is the main source of starting material for developing new cultivars.Morphological and morphometric traits remain the first step in characterising germplasm. Plant height, leaf size, number of branches, pod length, pods per plant, seeds per pod, seed weight and maturity are standard descriptors for mungbean [4] and are used for distinctness, uniformity and stability (DUS) testing [5]. Significant phenotypic variation for these traits has been reported among mungbean genotypes in India [6,7], Myanmar [8], Ethiopia [9] and Kenya [10]. Multivariate methods such as principal component and cluster analysis help to reveal relationships among genotypes and to choose divergent parents. Combining morphological and molecular markers further increases the precision of diversity assessment [11]. Genome-wide studies have shown that many agronomic traits of mungbean are highly heritable [12].In Uzbekistan, only a limited number of mungbean cultivars are registered, and information on how introduced germplasm performs under local conditions is scarce. In our previous study, the contents of chlorophyll a, chlorophyll b and carotenoids were quantified in the same set of genotypes [13], but their morphometric traits have not yet been characterised. The aim of this study was therefore to (i) evaluate the variability of the main morphometric traits in ten accessions from the world collection and two standard cultivars; (ii) estimate the genetic parameters of these traits; (iii) analyse the relationships among traits; and (iv) group the genotypes by multivariate methods in order to identify promising donors for breeding.
2. Materials and Methods
2.1. Plant Material
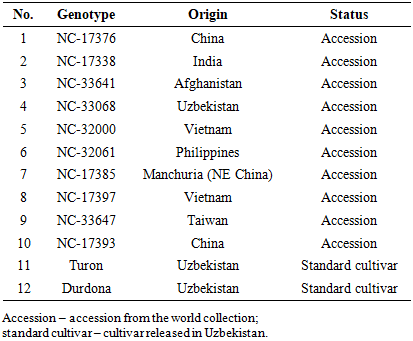
- Twelve genotypes were studied (Table 1). They comprised ten accessions from the world collection, originating from China, India, Afghanistan, Uzbekistan, Vietnam, the Philippines and Taiwan, and two cultivars registered in Uzbekistan, Turon and Durdona, which served as standards. The accessions were introduced into the Research Institute of Plant Genetic Resources in 2013 and 2019 and were maintained under the catalogue numbers presented in Table 1.
|
2.2. Experimental Site and Design
- Field experiments were conducted at the experimental site of the Faculty of Natural Sciences, Gulistan State University, Gulistan, Syrdarya Region, Uzbekistan (40.4851° N, 68.7842° E; 271 m above sea level). The area has a sharply continental climate with hot and dry summers. The experimental soil was irrigated meadow-gray soil with 0.5% humus content and moderate salinity. The trial was carried out during the 2025 growing season. Genotypes were arranged in three replications using a randomized block design. Irrigation, fertilization and weed control were carried out according to the recommended agronomic practices for mungbean cultivation in the region.
2.3. Trait Measurement
- Measurements were made at physiological maturity on five randomly selected plants per genotype, following the IBPGR descriptors [4] and the approaches of Win et al. [8] and Rahangdale et al. [7]. The following traits were recorded: stem length (SL, cm, from the cotyledon node to the apex of the main stem); root length (RL, cm, length of the tap root after careful excavation and washing); number of leaves per plant (LN); number of primary branches per plant (BN); and number of pods per plant (PN). The workflow of the study is shown in Figure 1.
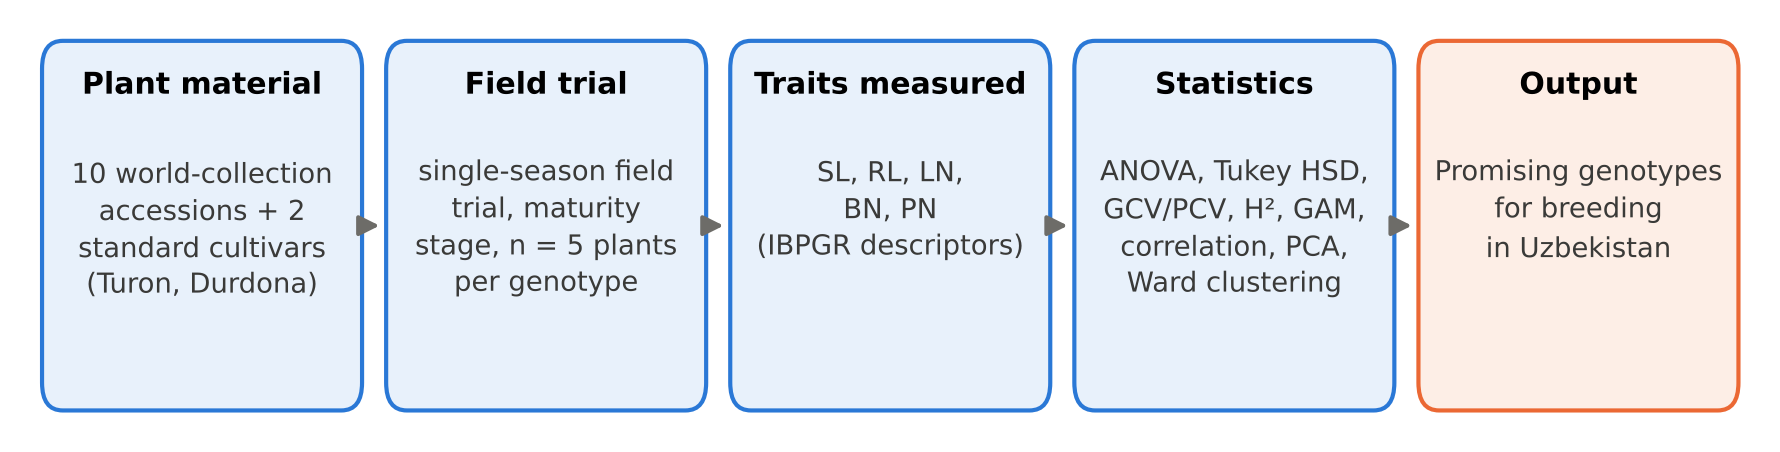 | Figure 1. Workflow of the study. SL – stem length; RL – root length; LN – leaves per plant; BN – branches per plant; PN – pods per plant |
2.4. Statistical Analysis
- Data were analysed by one-way analysis of variance (ANOVA), with plants as replicates (n = 5). Mean separation was performed using Tukey’s honestly significant difference (HSD) test at p < 0.05, and the least significant difference (LSD0.05) is also reported. Genotypic (σ²g = (MSg − MSe)/n) and phenotypic (σ²p = σ²g + σ²e) variances were used to calculate the genotypic (GCV) and phenotypic (PCV) coefficients of variation, the broad-sense heritability (H² = σ²g/σ²p × 100) and the genetic advance as a percentage of the mean (GAM = 2.06 × H² × σp/mean × 100) [14,15].Relationships among traits were assessed with Pearson correlation coefficients calculated on genotype means. Principal component analysis (PCA) was performed on the correlation matrix of standardised means, and hierarchical clustering used Ward’s minimum-variance method on Euclidean distances [16]. All analyses were carried out in Python 3 (NumPy, SciPy, Matplotlib).
3. Results
3.1. Analysis of Variance and Genetic Variability
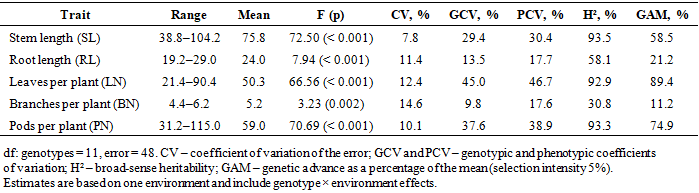
- ANOVA revealed highly significant differences among genotypes for all five traits (Table 3). SL, LN and PN showed the largest F values (72.5, 66.6 and 70.7, respectively; p < 0.001), RL was also highly significant (F = 7.94; p < 0.001), and BN was significant (F = 3.23; p = 0.002). The coefficients of variation of the experimental error were low to moderate (7.8–14.6%), which indicates acceptable precision of the measurements.Mean values and Tukey groupings are presented in Table 2 and Figure 2. Stem length ranged from 38.8 cm (NC-33647) to 104.2 cm (NC-32061). The tallest group (Tukey group “a”) included NC-32061, NC-17393 and NC-17397, while NC-33647, NC-17385 and NC-17338 were the shortest (< 46 cm). Root length varied less, from 19.2 cm (Turon) to 29.0 cm (NC-17393). NC-17393, NC-17385 and NC-17397 had the longest roots (28.0–29.0 cm). Leaves per plant showed the widest relative range, from 21.4 (Durdona) to 90.4 (NC-32061); NC-32061 and NC-17376 (89.0) formed a separate top group. Branches per plant ranged narrowly, from 4.4 to 6.2; the highest value was in Durdona, and only Durdona differed significantly from the genotypes with 4.4 branches. Pods per plant, the most important yield component, ranged from 31.2 (Durdona) to 115.0 (NC-17338). NC-17338 was significantly superior to all other genotypes, followed by NC-32061 (75.2) and Turon (74.2).
|
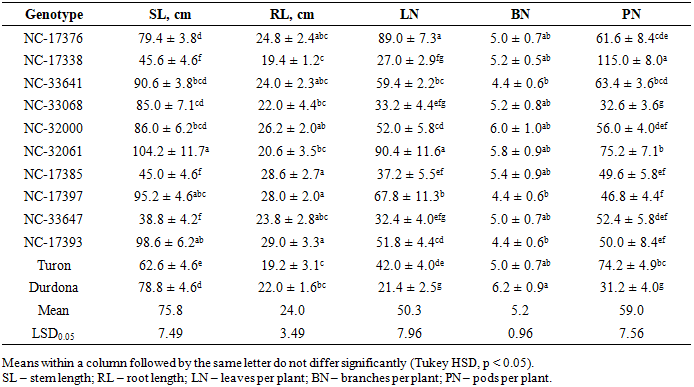
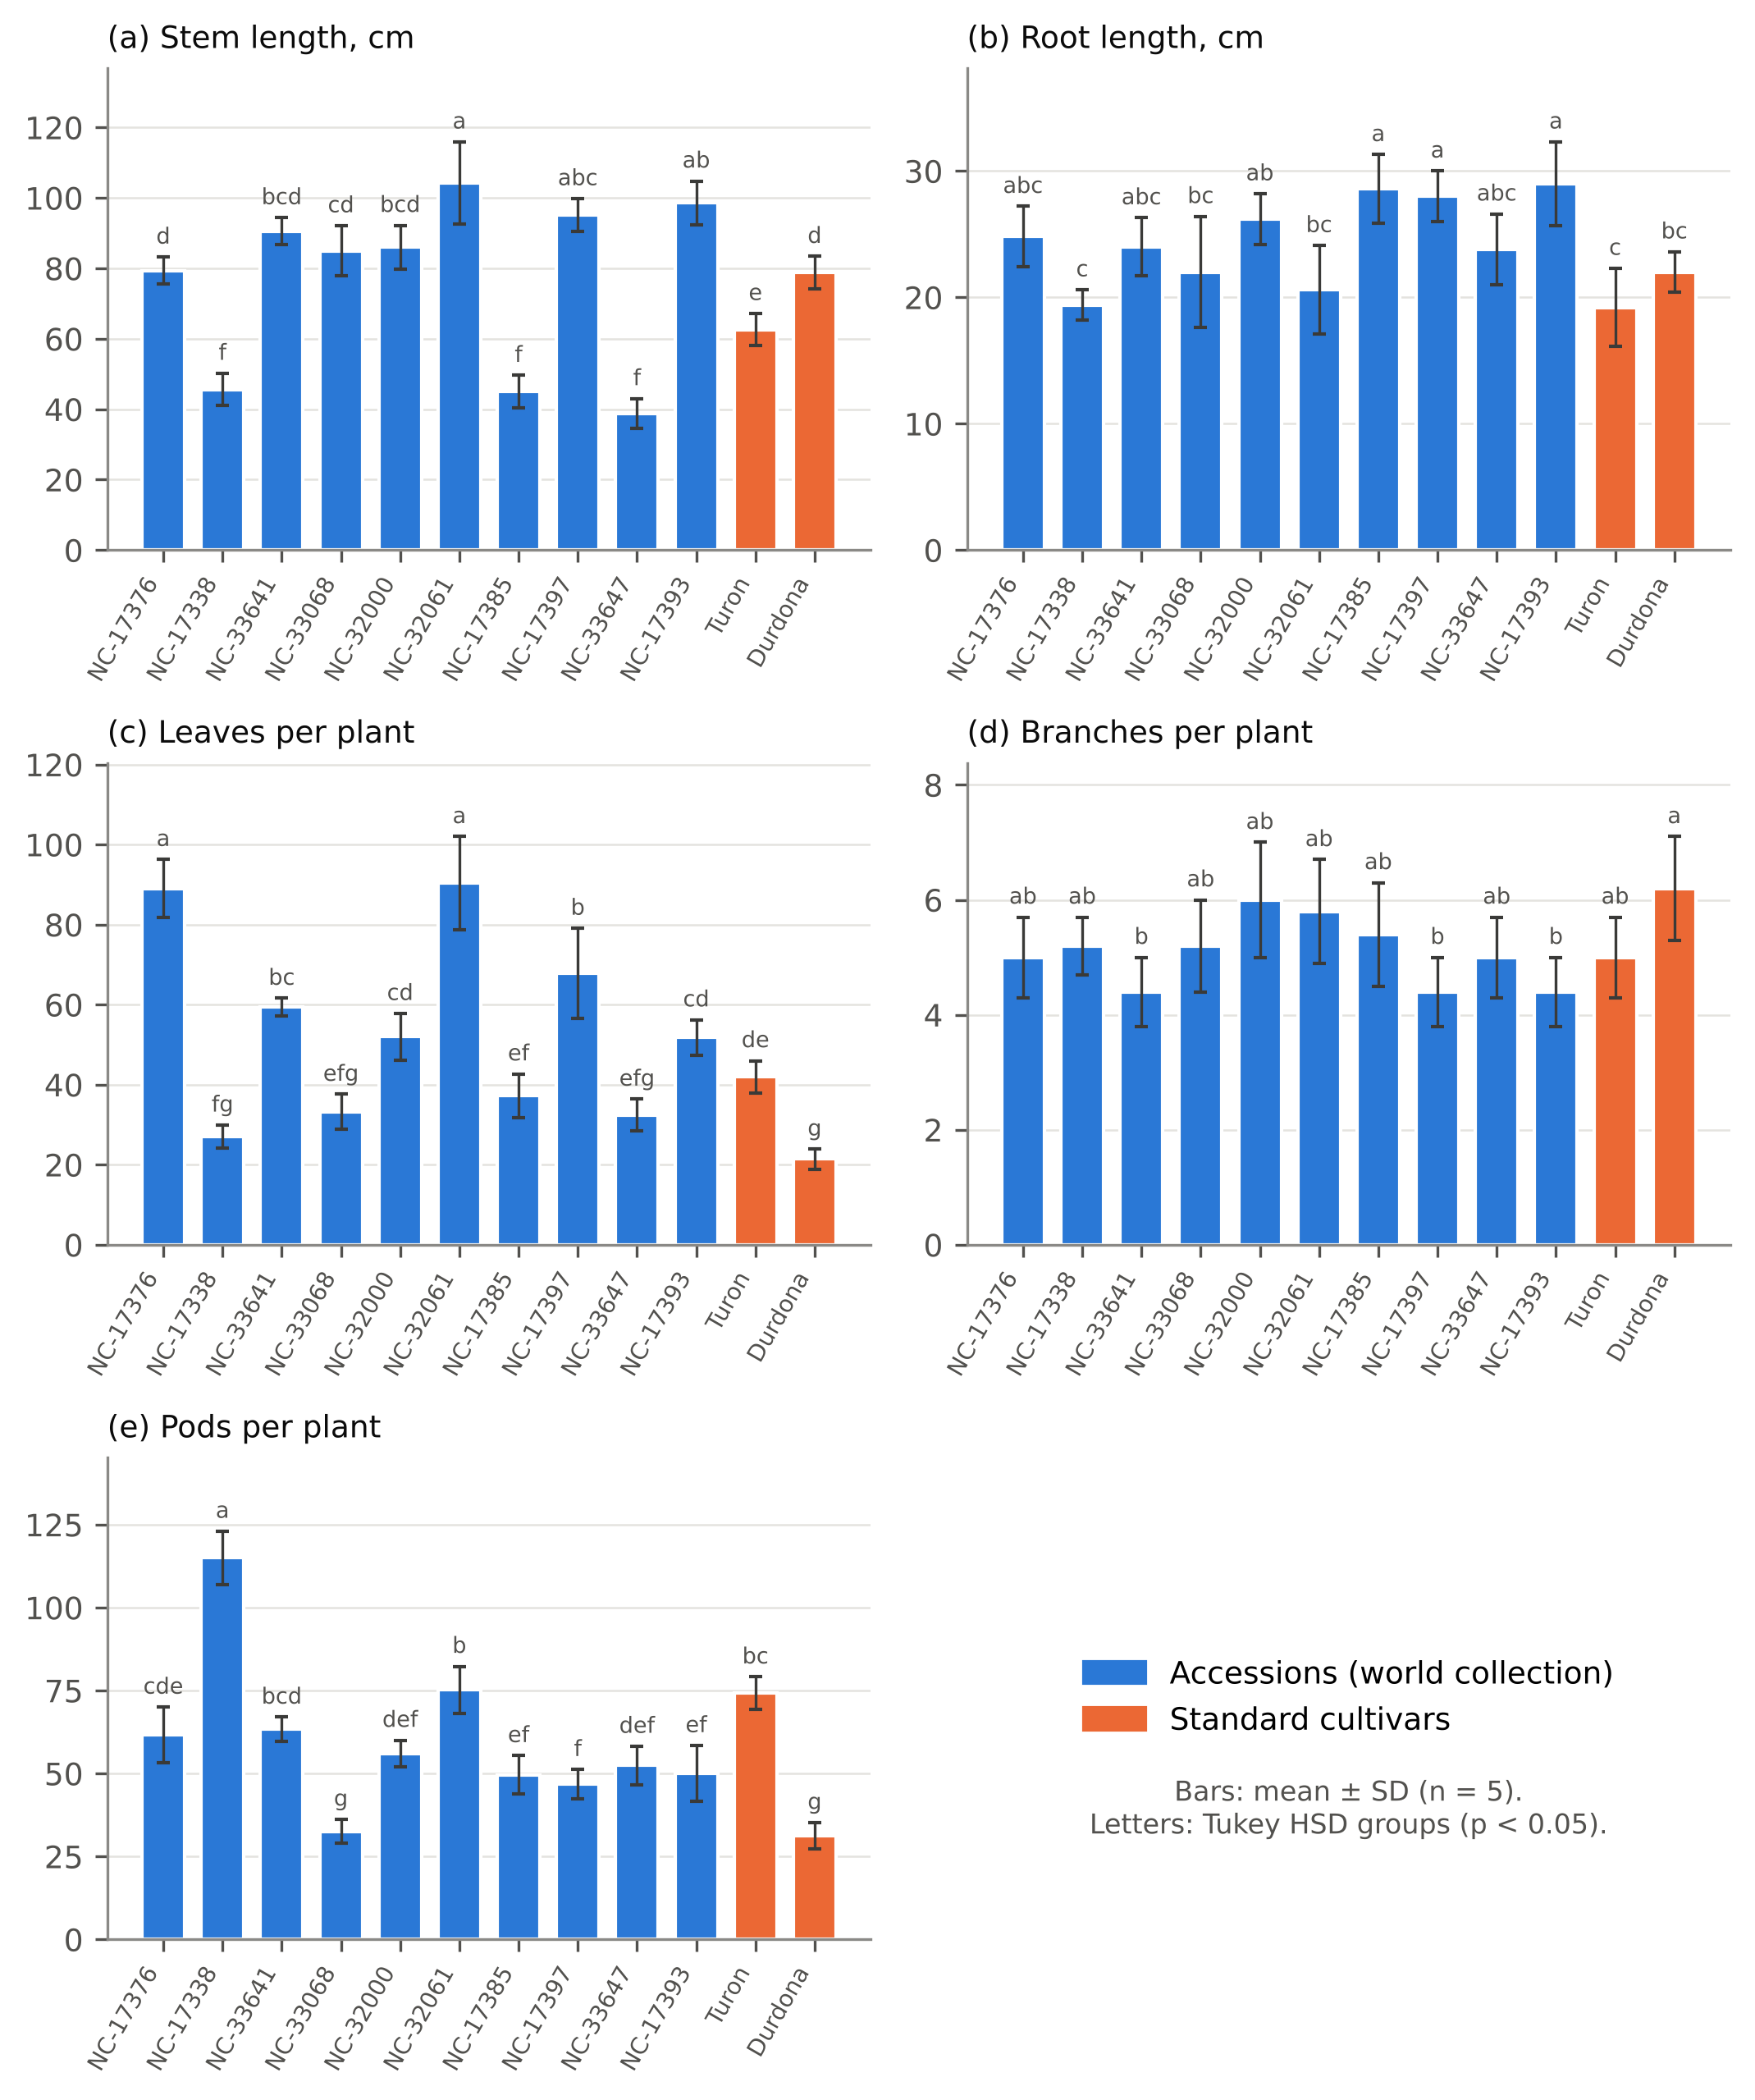 | Figure 2. Mean values (± SD, n = 5) of (a) stem length, (b) root length, (c) leaves per plant, (d) branches per plant and (e) pods per plant in 12 mungbean genotypes. Letters above the bars indicate Tukey HSD groups (p < 0.05); standard cultivars are shown in orange |
|
3.2. Performance Relative to the Standard Cultivars
- Compared with the standard cultivar Turon, NC-17338 produced 55.0% more pods per plant, and NC-32061 produced a similar number of pods (+1.3%) while being 66.5% taller and having 115.2% more leaves. All accessions except NC-17338, NC-33647 and NC-17385 were taller than Turon (+26.8 to +66.5%), and all exceeded Turon in root length (+1.0 to +51.0%). Compared with Durdona, which had the fewest pods, eleven genotypes formed more pods (+4.5 to +268.6%) and more leaves (+26.2 to +322.4%). However, Durdona had the highest number of branches (6.2).
3.3. Correlations among Traits
- Correlations among genotype means are shown in Figure 3. The only significant association was a positive correlation between SL and LN (r = 0.61, p = 0.035), which reflects the larger number of nodes and leaves in taller plants. PN was not significantly correlated with any vegetative trait. Its correlation with RL was negative but not significant (r = −0.49, p = 0.10), and its correlations with SL (r = −0.29) and LN (r = 0.11) were weak. BN was not associated with other traits (|r| ≤ 0.33).
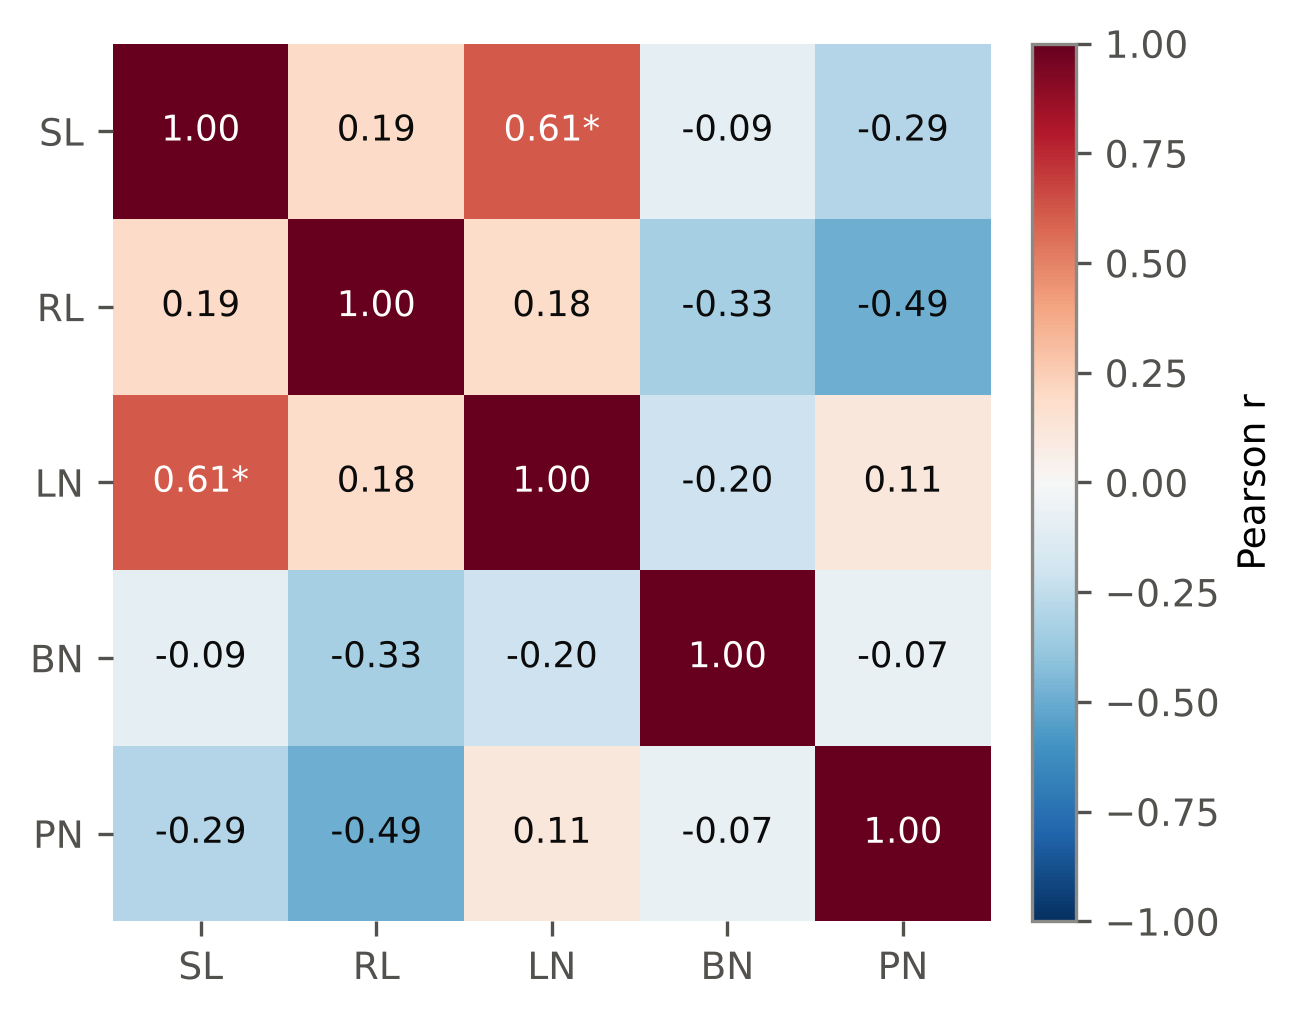 | Figure 3. Pearson correlation coefficients among morphometric traits calculated on genotype means (n = 12). * p < 0.05. SL – stem length; RL – root length; LN – leaves per plant; BN – branches per plant; PN – pods per plant |
3.4. Principal Component Analysis
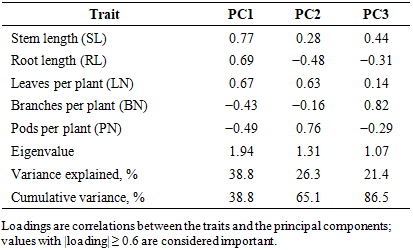
- The first three principal components had eigenvalues greater than 1 and together explained 86.5% of the total variation (Table 4). PC1 (38.8%) had high positive loadings for SL (0.77), RL (0.69) and LN (0.67), and negative loadings for PN (−0.49) and BN (−0.43); it can therefore be interpreted as a “vegetative vigour” component. PC2 (26.3%) was dominated by PN (0.76) and LN (0.63) and contrasted with RL (−0.48); it represents the “productivity” component. PC3 (21.4%) was associated mainly with BN (0.82).
|
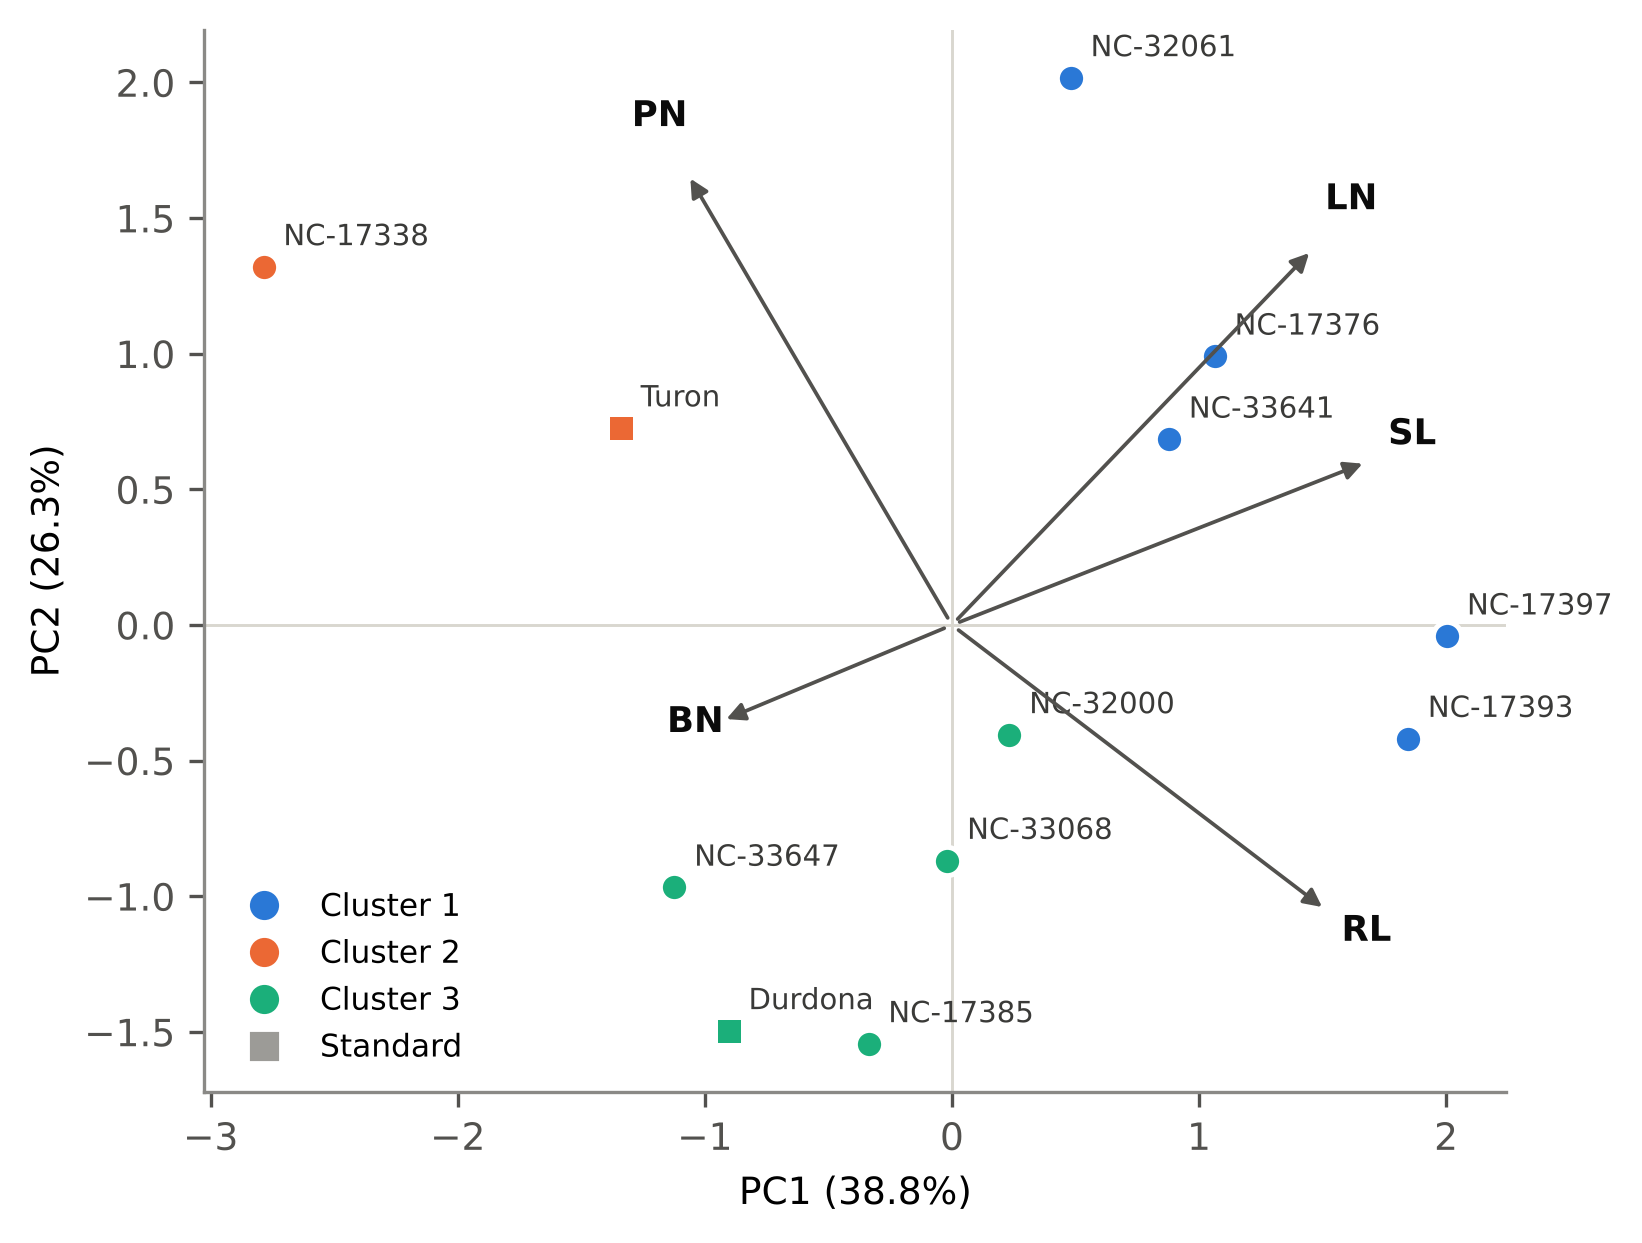 | Figure 4. PCA biplot of 12 mungbean genotypes based on five morphometric traits. Points are coloured by Ward cluster; squares indicate the standard cultivars. Arrows show trait loadings (scaled) |
3.5. Cluster Analysis
- Ward’s clustering divided the 12 genotypes into three groups (Figure 5, Table 5). Cluster 1 (NC-32061, NC-17376, NC-33641, NC-17397 and NC-17393) comprised tall (mean SL 93.6 cm), leafy (71.7 leaves) genotypes with long roots and a medium number of pods (59.4). Cluster 2 (NC-17338 and Turon) had the highest number of pods (94.6), short stems (54.1 cm) and short roots. Cluster 3 (NC-33068, NC-32000, NC-17385, NC-33647 and Durdona) included genotypes of medium height with few leaves (35.2) and the lowest number of pods (44.4).
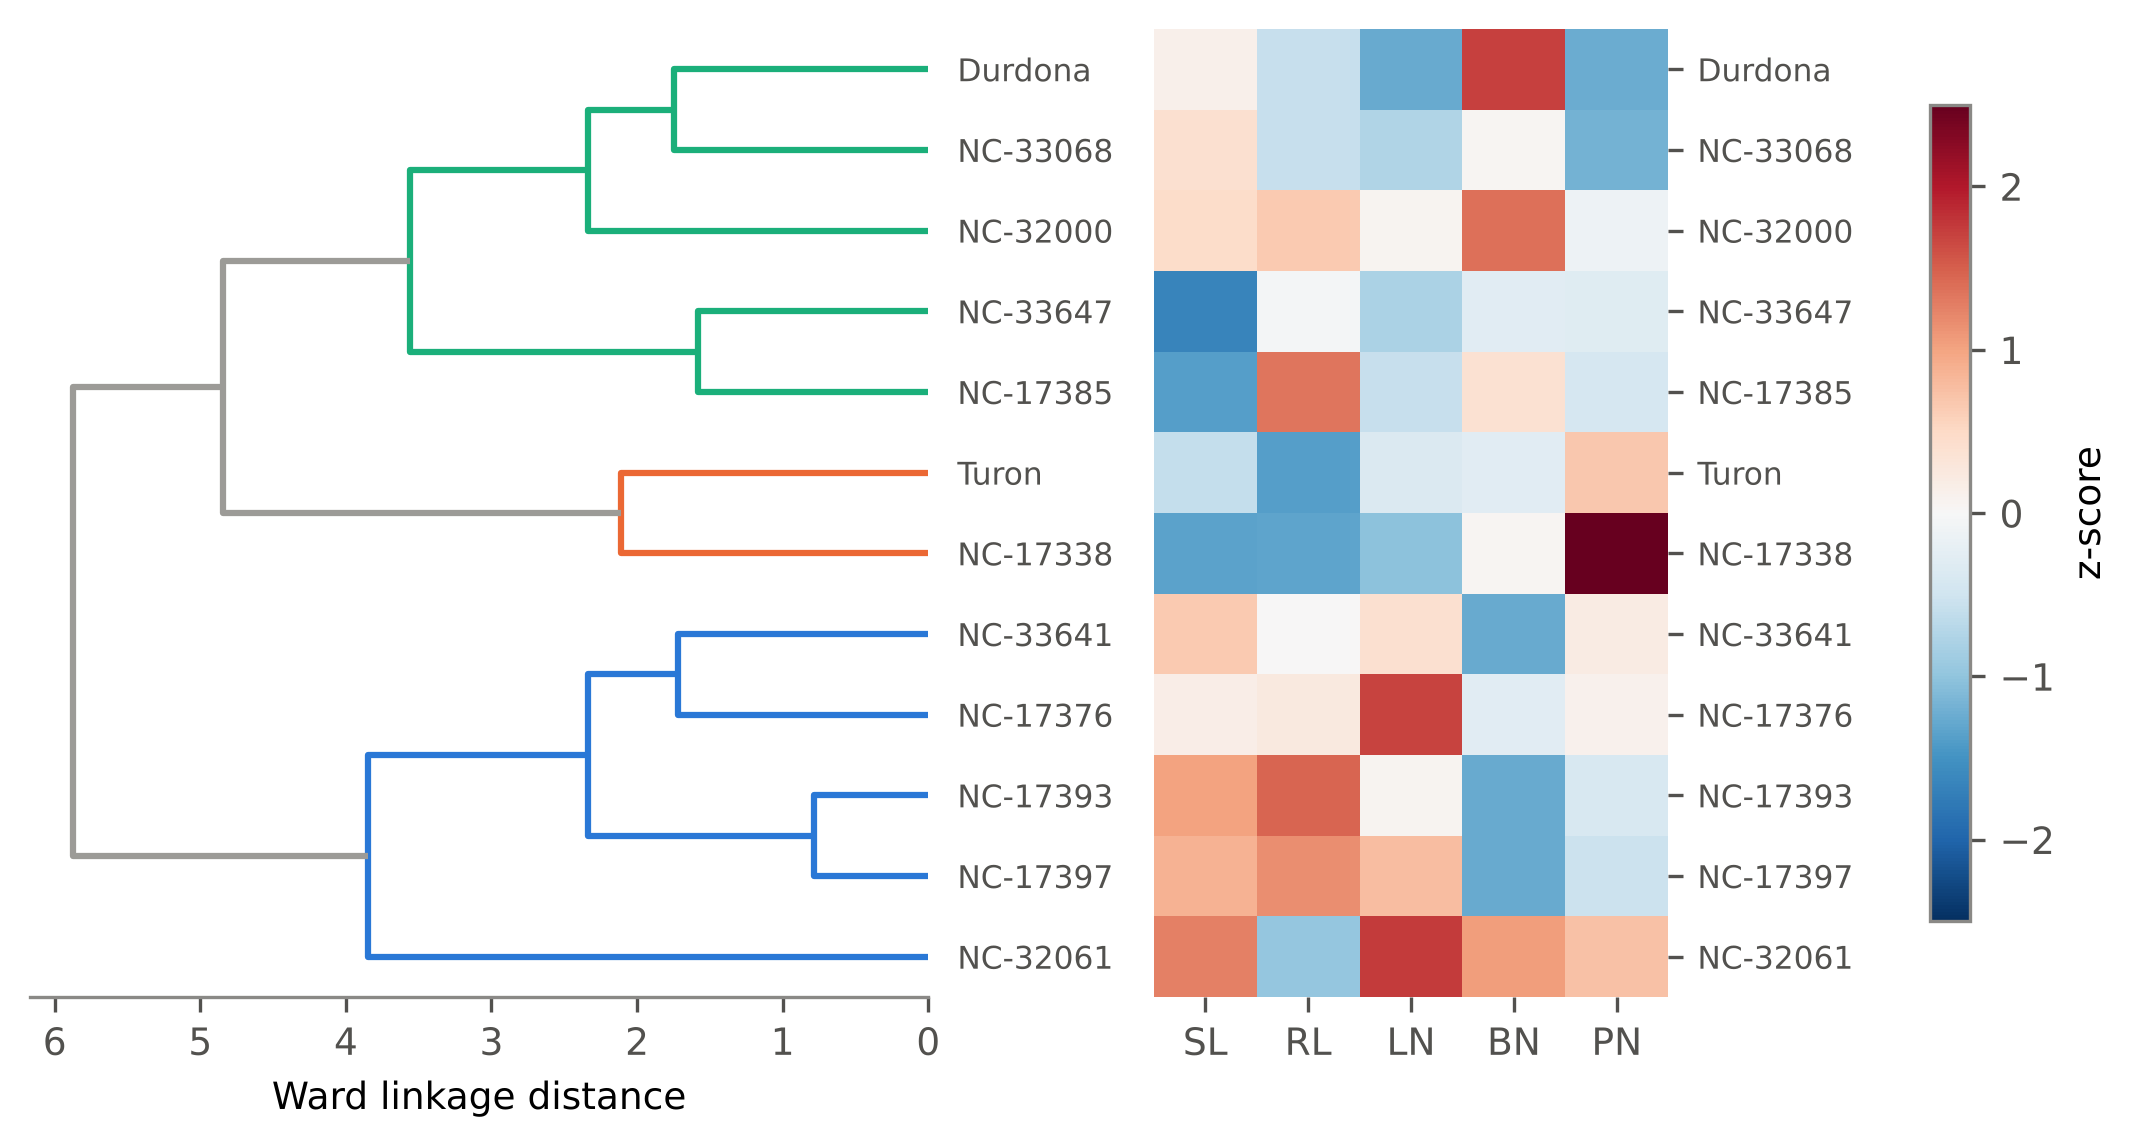 | Figure 5. Dendrogram of 12 mungbean genotypes (Ward’s method, Euclidean distance on standardised means) and heat map of standardised trait values (z-scores). Colours of the branches correspond to the three clusters |
|

4. Discussion
- The significant differences among genotypes for all traits confirm that the world-collection accessions are a valuable source of variability for mungbean breeding in Uzbekistan. The ranges observed here are comparable to those reported in other germplasm studies. Root length in our material (19.2–29.0 cm) fell within the 8–34.5 cm range reported by Kindeya et al. [9] in Ethiopia, and considerable variation in plant height, leaf number, branches and pods per plant was also found by Ahmad and Belwal [6] in 112 genotypes and by Manjunatha et al. [12] in 153 genotypes.From a breeding perspective, the combination of high GCV, high heritability and high GAM for stem length, leaf number and pod number suggests that these traits are governed largely by additive gene effects and should respond well to direct phenotypic selection [15]. In contrast, the low heritability and the large difference between GCV and PCV for branch number indicate a strong environmental influence, so selection for this trait should be based on progeny or multi-environment data. It should be noted, however, that our estimates come from a single environment, and genotype × environment interaction can inflate heritability estimates. Multi-location testing is therefore required to confirm the stability of the selected genotypes [17].Pods per plant is widely regarded as a key yield component in mungbean and was therefore given particular attention in this study. In our study PN was practically independent of vegetative vigour. The highest-podding genotypes, NC-17338 and Turon, had short stems and short roots, whereas the tall, leafy cluster produced only medium pod numbers. This suggests that, under the conditions of the trial, excessive vegetative growth did not translate into higher reproductive output. Breeding for compact plant types with high pod numbers may therefore be more effective. NC-32061 is an exception: it combines high pod number with strong vegetative development and may be a useful parent for combining productivity with biomass, for example for fodder or green-manure purposes.PCA and cluster analysis gave consistent results and grouped the genotypes by plant architecture rather than by geographical origin. Accessions from the same country (for example, NC-32000 and NC-17397 from Vietnam, and NC-17376 and NC-17393 from China) fell into different clusters, which indicates that geographic origin is a poor predictor of phenotypic divergence in this material. Crosses between genotypes from divergent clusters, for example NC-17338 (cluster 2) × NC-17393 or NC-17397 (cluster 1), are expected to produce more transgressive segregants. Evaluating seed yield, 100-seed weight, pod length, seeds per pod and maturity, together with molecular markers [11], would help to confirm the breeding value of these combinations.
5. Conclusions
- Significant genetic variability was found among ten world-collection accessions and two standard cultivars of mungbean for stem length, root length, leaves, branches and pods per plant. Stem length, leaf number and pod number combined high heritability with high genetic advance and can be improved by direct selection, whereas branch number was strongly affected by the environment. The genotypes formed three clusters that differed mainly in vegetative vigour and productivity. Accession NC-17338 (115.0 pods per plant, +55% over Turon) and NC-32061 (75.2 pods, tallest stem and most leaves) are recommended as donors for yield-component improvement. Accessions from divergent clusters are recommended as parents for hybridisation. Multi-season and multi-location trials including seed yield and quality traits are needed to confirm these results.
ACKNOWLEDGEMENTS
- Funding. This research received no external funding.Author contributions. Elmurod A. Ubaydullayev – conceptualization, field experiment, data collection, writing of the original draft; Bakhtiyar Kh. Amanov – supervision, methodology, review and editing; Raykhona P. Bozorova – data curation, investigation; Farrukh B. Abdukholikov – formal analysis, visualization, review and editing.Conflict of interest. The authors declare no conflict of interest.Data availability. The data supporting the findings of this study are available from the corresponding author upon reasonable request.