
-
Paper Information
- Paper Submission
-
Journal Information
- About This Journal
- Editorial Board
- Current Issue
- Archive
- Author Guidelines
- Contact Us
International Journal of Genetic Engineering
p-ISSN: 2167-7239 e-ISSN: 2167-7220
2026; 14(10): 291-298
doi:10.5923/j.ijge.20261410.06
Received: Oct. 2; Accepted: Oct. 23, 2026; Published: Oct. 26, 2026

Cross-Dependent Inheritance of Stem and Leaf Pubescence in Cultivated Tetraploid Cotton: Morphometric Assessment, F₂ Segregation, and Backcross Response
 Abstract
 Reference
 Full-Text PDF
 Full-text HTML
Ma’murjon M. Tursunov1, Taner Özcan2, Normomin N. Sanayev1, Abdujalil Narimanov1, Ma’rufjon M. Ergashev3, Haydarali Ro‘ziboyev4
1Institute of Genetics and Plant Experimental Biology, Academy of Sciences of the Republic of Uzbekistan, Tashkent, Uzbekistan
2Biology Education, Necatibey Faculty of Education, Balıkesir University, Balıkesir, Türkiye
3Department of Biology, Gulistan State University, Gulistan, Uzbekistan
4Department of Biophysics, National University of Uzbekistan, Tashkent, Uzbekistan
Correspondence to: Taner Özcan, Biology Education, Necatibey Faculty of Education, Balıkesir University, Balıkesir, Türkiye.
| Email: |  |
Copyright © 2026 The Author(s). Published by Scientific & Academic Publishing.
This work is licensed under the Creative Commons Attribution International License (CC BY).
http://creativecommons.org/licenses/by/4.0/

Stem and leaf pubescence is a useful breeding trait in cotton, but its expression depends on the parental combination and the organ examined. Contrasting Gossypium hirsutum L. and G. barbadense L. genotypes and their F₁, F₂, and BC₁ progenies were evaluated during 2023–2025. A modified 0–5 visual scale was assessed against digital morphometry using ten genotype-organ means from five representative parents. Visual scores were positively associated with trichome density (r = 0.905; R² = 0.819). Across 17 F₂ populations (n = 189–270), standard deviations ranged from 0.45 to 1.29 for stems and from 0.41 to 1.28 for leaves. Reciprocal F₁ comparisons differed by cross: L-10 × A-4384 and A-4384 × L-10 showed no significant difference in either organ (P = 0.086 and 0.301), whereas Afsona × Marvarid and its reciprocal differed by 0.68 stem-score units and 0.67 leaf-score units (both P < 0.001). The L-10/A-4384 F₁ progenies showed incomplete dominance toward the more pubescent parent (hp = 0.66–0.74). Stem and leaf scores were strongly correlated in the two focal F₂ populations (r = 0.95 and 0.98). Relative to F₂, backcross means shifted toward the recurrent parent, although substantial variation remained. These findings support the morphometric basis of visual genotype ranking and show cross-dependent phenotypic segregation. Neither the reciprocal differences nor the organ-level correlations establish a specific inheritance mechanism.
Keywords: Gossypium hirsutum, Gossypium barbadense, Trichomes, Pubescence, Reciprocal crosses, F₂ segregation, Backcrossing
Cite this paper: Ma’murjon M. Tursunov, Taner Özcan, Normomin N. Sanayev, Abdujalil Narimanov, Ma’rufjon M. Ergashev, Haydarali Ro‘ziboyev, Cross-Dependent Inheritance of Stem and Leaf Pubescence in Cultivated Tetraploid Cotton: Morphometric Assessment, F₂ Segregation, and Backcross Response, International Journal of Genetic Engineering, Vol. 14 No. 10, 2026, pp. 291-298. doi: 10.5923/j.ijge.20261410.06.
Article Outline
1. Introduction
- Visual assessment of cotton pubescence offers a practical way to characterize variation on stems and leaves [1,2]. Trichomes differ in density, length, branching, and distribution, so a visually similar surface need not have the same underlying architecture [3,4,5]. These differences are relevant to breeding because cotton pubescence has been associated with insect preference and with agronomic or fiber traits [6,7,8,9]. The value of a pubescence phenotype therefore depends on its genetic background and the breeding objective, rather than on hairiness alone.Molecular studies also indicate that cotton pubescence cannot be represented by one universal genetic model. Genotyping-by-sequencing has identified quantitative trait loci associated with trichome-based defense [10], and the genetic basis of stem trichome development differs between cultivated tetraploid species [11]. Other studies have linked a hairless-stem phenotype in G. barbadense to HD1 [12], identified GoSTR as a regulator of stem trichome formation [13], and demonstrated multilocus control of leaf-hair development in upland cotton [14]. Transcriptomic work further illustrates the regulatory complexity of trichome initiation [15].These advances do not remove the need for efficient field phenotyping. Visual systems remain useful for screening large segregating populations [1,2], but image-based analyses reveal quantitative variation within visual classes [16]. Here, we assessed the morphometric basis of a modified field scale, compared pubescence variation across F₂ populations, examined selected reciprocal F₁ combinations, and characterized the backcross response of the strongly contrasting L-10/A-4384 pair.
2. Materials and Methods
2.1. Plant Material and Field Evaluation
- The study was conducted during 2023–2025 at the Do‘rmon experimental station and the Plant Immunity Laboratory of the Institute of Genetics and Plant Experimental Biology, Academy of Sciences of the Republic of Uzbekistan, in Qibray District, Tashkent Region. Plants were grown in 5-m plots. Field trials comprised two replications in 2023, two in 2024, and three in 2025.The parental material included four G. hirsutum genotypes: L-10 (pilose), Afsona and A-3638 (moderately pubescent), and A-6140 (sparsely pubescent). The two G. barbadense parents were Marvarid (densely pubescent) and A-4384 (very sparsely pubescent or nearly smooth). In 2023, 50 plants of each parent were phenotyped. Parents and F₁ combinations were evaluated using 50 plants per genotype in 2024. Parents, F₁, F₂, and BC₁ materials were reassessed within the same field setting in 2025. Approximately 9,000 images were collected over the three years; these were photographic records, not 9,000 independent experimental units.The cross-population comparison was restricted to 17 F₂ populations for which sample counts and descriptive summaries were internally consistent. Sample sizes ranged from 189 to 270 plants. The focal L-10 × A-4384 and A-4384 × L-10 F₂ populations contained 244 and 224 plants, respectively; their BC₁ populations contained 18–30 plants. Each F₁ group comprised 50 plants. Preliminary F₁ observations were reported previously [17]. The present analysis extends that work through parental morphometry, F₂ segregation, and BC₁ phenotypes.
2.2. Visual Scoring of Stem and Leaf Pubescence
- Stem and leaf pubescence were scored separately using a modified scale informed by the approaches of Bourland et al. [1] and Hornbeck and Bourland [2]. The categories were 0, glabrous; 1, very sparsely pubescent or nearly smooth; 2, sparsely pubescent; 3, moderately pubescent; 4, densely pubescent; and 5, pilose. Half-point intermediate classes were used. Repeated observations of the same plant at different developmental stages were averaged, so final plant-level values could include increments smaller than 0.5.Observations extended from budding and flowering to the end of the growing season. To reduce variation attributable to developmental position, the stem was divided into vertical tiers defined by fruiting-branch position. The abaxial leaf surface and its corresponding stem region were examined at comparable positions.
2.3. Digital Morphometry
- Trichomes were documented using a Levenhuk DTX500 digital microscope, mobile macro-imaging equipment, and Apexel optical accessories. Calibrated images were analyzed in Fiji (ImageJ). Regions of interest (ROIs) were delineated, individual trichomes were marked with the Point Tool, and density was expressed as trichomes cm⁻². Trichome length, width, and branching were also examined in the parents. The photographic panel was used only to illustrate morphology; all quantitative density measurements came from separate calibrated ROI images.Agreement between visual scores and trichome density was explored using Pearson correlation and ordinary least-squares regression across ten genotype-organ means: five representative parental genotypes, each contributing a stem and a leaf mean. The fit was descriptive; the paired organ means do not constitute ten independent genotypes, and the analysis was not an individual-plant validation or a calibration model. Differences in density among vertical tiers were evaluated by one-way analysis of variance followed by Tukey’s honestly significant difference test.
2.4. Genetic and Statistical Analyses
- Population summaries are presented as mean ± standard deviation (SD). The coefficient of variation was calculated as CV = 100 × SD/mean and used only as a supplementary descriptor. Because scores were bounded at 0 and 5 and CV depends mathematically on the mean, biological comparisons were based primarily on means, SDs, and the reported frequency classes.The F₁ dominance coefficient was calculated as hp = (F₁ − MP)/(HP − MP), where MP is the midparent mean and HP is the mean of the more pubescent parent. Values between 0 and 1 indicate incomplete dominance toward that parent; negative values indicate displacement toward the less pubescent parent. The coefficient describes the position of the F₁ mean on the scoring scale and is not a locus-specific genetic estimate.Pearson correlations summarized the relationship between stem and leaf scores, treating plant-level averages of repeated ratings as quasi-continuous variables. Selected reciprocal F₁ means were compared using Welch’s independent-samples t-test, with 50 plants per direction and 95% confidence intervals (CIs) for the mean difference. P < 0.05 was the significance threshold. Values above this threshold are reported as non-significant, including P = 0.086. These comparisons assess phenotypic differences between cross directions; they do not distinguish maternal, cytoplasmic, or parent-of-origin mechanisms. Backcross shifts were interpreted descriptively.
3. Results
3.1. Parental Contrast and the Morphometric Basis of Visual Scores
- The six parents spanned a broad range of pubescence (Table 1). L-10 was close to the maximum visual score in both organs, whereas A-4384 had the lowest scores. Afsona and A-3638 occupied the intermediate class, A-6140 was sparsely pubescent, and Marvarid was densely pubescent. The representative micrographs illustrate these contrasts and the diversity of trichome architecture (Figure 1).
|
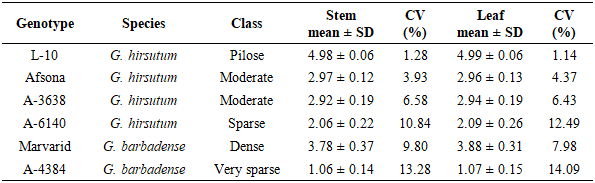
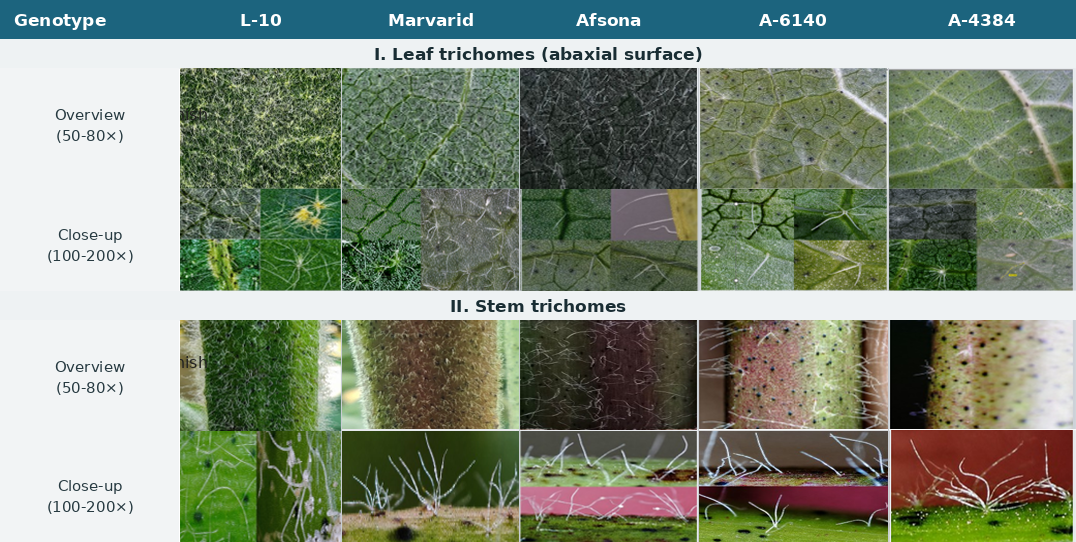 | Figure 1. Representative micrographs of the abaxial leaf surface and stem trichomes in five parental genotypes. Overview and close-up labels give the acquisition magnification ranges reported for the images, not calibrated dimensions in this resized panel. The images illustrate qualitative morphology only. Quantitative morphometry used separate calibrated ROI images in Fiji (ImageJ) |
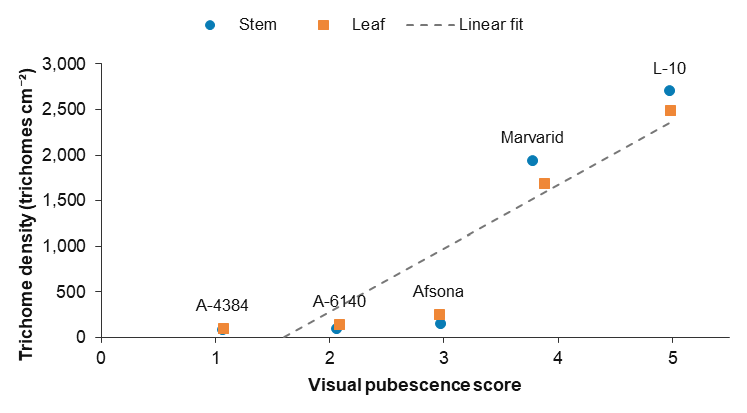 | Figure 2. Visual pubescence scores and trichome density in five parental genotypes. Circles denote stems and squares denote leaves; each point is a genotype-organ mean. The dashed line is the descriptive least-squares fit to all ten means (r = 0.905; R² = 0.819), displayed within the non-negative density range. Paired organ means share a genotype and are not ten independent biological replicates. This comparison is not an individual-plant validation of the scale |
3.2. Cross-Dependent Variation in F₂ Populations
- The 17 F₂ populations differed in both mean score and spread (Table 2; Figure 3). Stem SD ranged from 0.45 to 1.29 and leaf SD from 0.41 to 1.28. Afsona × A-3638 had the narrowest distributions. Wider variation occurred in contrasting combinations, including L-10 × A-6140, A-6140 × L-10, and the reciprocal L-10/A-4384 pair. CV ranged from 14.99% to 46.05% across organs and populations, but was not treated as an independent measure of genetic variation.
|
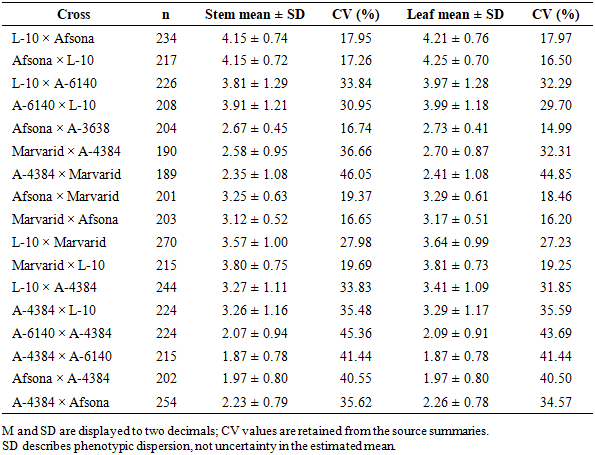
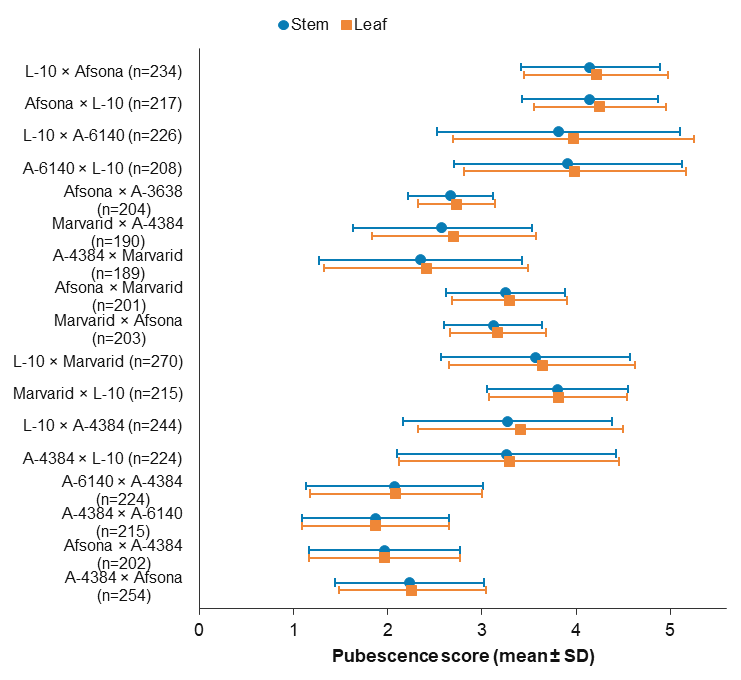 | Figure 3. Mean stem and leaf pubescence in 17 F₂ populations. Every error bar represents the corresponding population’s SD, and labels give the number of plants. The scoring scale is 0–5; a mean ± SD interval is not the observed range and may extend beyond the scale limits |
3.3. F₁ Dominance and Reciprocal Cross Direction
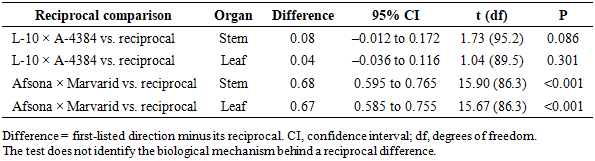
- In the L-10/A-4384 pair, both reciprocal F₁ progenies were closer to the more pubescent L-10 parent than to the midparent value. Dominance coefficients were 0.70 for stems and 0.74 for leaves in L-10 × A-4384, and 0.66 and 0.72, respectively, in A-4384 × L-10. Thus, both directions showed incomplete dominance toward the more pubescent parent.The reciprocal comparison depended on the parental combination (Table 3). For L-10/A-4384, differences of 0.08 stem-score units and 0.04 leaf-score units were non-significant, and both CIs included zero. In contrast, Afsona × Marvarid exceeded Marvarid × Afsona by 0.68 stem-score units and 0.67 leaf-score units (both P < 0.001). These results show a cross-direction association in the latter pair, not a general directional effect across all crosses.
|
3.4. F₂ Segregation and Backcross Response in the L-10/A-4384 Pair
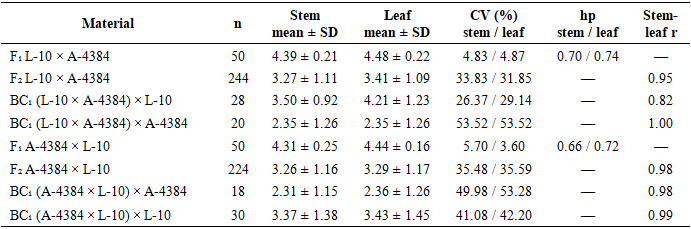
- L-10 and A-4384 differed by 3.92 visual-score units in both organs. Stem pubescence in the two reciprocal F₂ populations averaged 3.27 ± 1.11 and 3.26 ± 1.16 (Table 4). The reported modal stem class was 4.00 in both populations, containing 108 plants in L-10 × A-4384 and 102 in its reciprocal. Lower and intermediate classes between 1.00 and 3.50 were also present, showing why the mean alone cannot describe the segregating population.Relative to the F₂ means, backcross means moved toward the recurrent parent in both reciprocal backgrounds (Figure 4). In the L-10 × A-4384 background, stem scores averaged 3.50 ± 0.92 after backcrossing to L-10 and 2.35 ± 1.26 after backcrossing to A-4384. The corresponding reciprocal-background means were 3.37 ± 1.38 and 2.31 ± 1.15. Variation remained substantial in several BC₁ populations; these results indicate directional shifts rather than full restoration of the recurrent-parent phenotype.
|
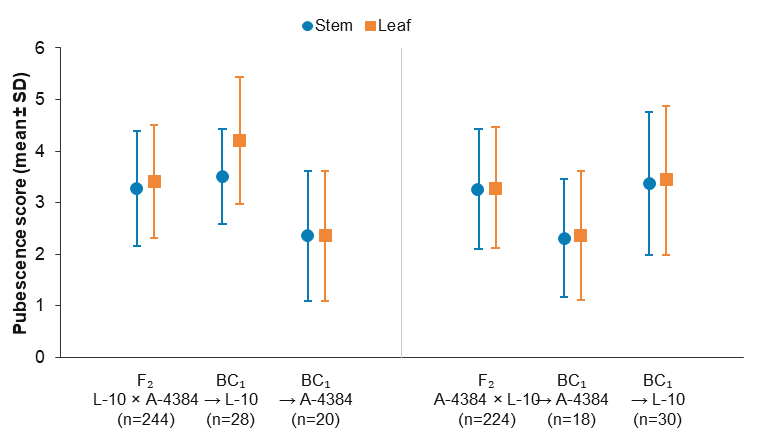 | Figure 4. Stem and leaf pubescence in the two reciprocal F₂ backgrounds and their BC₁ progenies. Points show means and error bars show SD. Arrows indicate the recurrent parent; n is the number of plants. The vertical separator distinguishes the reciprocal backgrounds. Mean ± SD intervals are not confidence intervals or observed ranges |
3.5. Joint Expression of Stem and Leaf Pubescence
- Stem and leaf scores were strongly correlated in L-10 × A-4384 F₂ (r = 0.95; n = 244) and A-4384 × L-10 F₂ (r = 0.98; n = 224). BC₁ correlations ranged from 0.82 to 1.00. The organs therefore varied together, but these associations do not establish pleiotropic control by a single gene or an identical developmental mechanism.
4. Discussion
- This study brings together field scoring, image-based morphometry, and comparisons among hybrid generations. The positive score-density relationship is consistent with the morphological basis of visual cotton pubescence ratings described by Bourland et al. [1] and Hornbeck and Bourland [2]. Its scope is nevertheless specific: ten genotype-organ means support the ranking of contrasting parents, not the precision or repeatability of individual plant scores. The two organ means from each genotype also share a genetic background and should not be treated as ten independent genotypes.A visual class summarizes more than the number of trichomes. Differences in architecture are evident in the photographic panel, while previous image-based work has documented variation within visual hairiness classes [16]. The present images illustrate this distinction, but do not quantify how much length, width, or branching contributes to a visual score. Such contributions would require a separate analysis linking these measurements to plant-level ratings.The F₂ results show that population mean and dispersion depend on the cross. The narrow spread of Afsona × A-3638 contrasts with the broader distributions of several combinations involving strongly divergent parents. This pattern is compatible with the cross- and species-dependent genetic architecture described in mapping studies [10,11,14]. It does not, by itself, reveal the number of segregating loci, distinguish genetic from environmental variance, or establish a particular Mendelian ratio. No heritability estimate is inferred here. CV is especially sensitive to lower means on a bounded scale, so comparisons should retain the accompanying mean and SD.Reciprocal F₁ comparisons provide a second distinction between combinations. The L-10/A-4384 means were similar in both directions and showed the same dominance orientation. For Afsona/Marvarid, the larger reciprocal differences were significant under the reported Welch comparisons. A directional association is therefore present in that pair, but the statistical result alone cannot identify maternal provisioning, cytoplasmic inheritance, or parent-of-origin regulation. Additional reciprocal designs, replication across environments, and appropriate genotyping would be needed to separate those explanations.Backcrossing produced a consistent directional pattern relative to F₂: means were higher with L-10 as recurrent parent and lower with A-4384. This is relevant to the development of breeding populations with different target pubescence levels. However, the BC₁ groups were smaller than the F₂ groups and often remained variable. The shifts were described rather than tested in a model accounting for field structure, and should not be interpreted as a demonstrated selection gain or complete genetic recovery. Strong stem-leaf correlations similarly suggest coordinated phenotypic expression, not necessarily one shared causal locus.The earlier study described stem pubescence and other morphological characters in parental forms and F₁ hybrids [17]. The present analysis extends that work to F₂ variation, backcross phenotypes, and a quantitative assessment of parental score-density correspondence. Its contribution therefore lies in the segregating and backcross generations and their connection to field phenotyping, rather than in presenting the earlier F₁ observations as an independent discovery.
4.1. Limitations
- The principal limitations concern sampling and inference. The morphometric comparison uses aggregate means from only five genotypes, and the photographic panel is qualitative. Field observations span three years at one location; the population summaries do not separate year and block effects, and the Welch tests do not account for potential field-level clustering. The 17-population comparison is conditional on the stated data-consistency criterion. Smaller BC₁ samples also limit the precision of backcross comparisons. These constraints favor a descriptive, cross-specific interpretation rather than a universal model of cotton pubescence inheritance.
5. Conclusions
- The modified 0–5 visual scale ranked contrasting cotton parents in agreement with aggregate trichome density (r = 0.905; R² = 0.819). Across 17 F₂ populations, stem and leaf pubescence showed cross-dependent variation. Reciprocal F₁ differences were small and non-significant in L-10/A-4384 but pronounced in Afsona/Marvarid. In the focal interspecific pair, both F₁ directions showed incomplete dominance toward the more pubescent parent, while backcross means shifted toward the recurrent parent and retained residual variation. These findings support the use of coordinated field and morphometric phenotyping to characterize breeding populations, without assigning the observed patterns to an untested molecular or cytoplasmic mechanism.
Data Availability
- The underlying raw data are retained by the authors and may be made available upon reasonable request.
Funding
- No specific project or grant funding was declared for this study.
Conflicts of Interest
- The authors declare no conflicts of interest related to the content of this article.