-
Paper Information
- Paper Submission
-
Journal Information
- About This Journal
- Editorial Board
- Current Issue
- Archive
- Author Guidelines
- Contact Us
International Journal of Genetic Engineering
p-ISSN: 2167-7239 e-ISSN: 2167-7220
2026; 14(5): 137-141
doi:10.5923/j.ijge.20261405.01
Received: Apr. 9, 2026; Accepted: Apr. 27, 2026; Published: May 1, 2026

Changes in EEG Alpha and High-Frequency Beta Rhythms in Speech Centers of Preschool Children: Diagnostic Significance of the Alpha/Beta Ratio Biomarker and Predictive Modeling
 Abstract
 Reference
 Full-Text PDF
 Full-text HTML
Gofurjon Rakhimjanovich Abdullayev1, Nodira Makhmudovna Ikromova2
1Department of Physiology Doctor of Biological Sciences, Namangan State University, Namangan, Uzbekistan
2Department of Physiology, Fergana Medical Institute of Public Health, Fergana, Uzbekistan
Correspondence to: Nodira Makhmudovna Ikromova, Department of Physiology, Fergana Medical Institute of Public Health, Fergana, Uzbekistan.
| Email: |  |
Copyright © 2026 The Author(s). Published by Scientific & Academic Publishing.
This work is licensed under the Creative Commons Attribution International License (CC BY).
http://creativecommons.org/licenses/by/4.0/

This study is devoted to investigating the effect of an experimental factor (fine motor activity) on electroencephalographic (EEG) rhythms in a population of children with speech dysfunction. The research is based on a dataset of 200 observations from both control and experimental groups (50 boys and 50 girls in each group). The results demonstrated that, in the experimental group, the alpha rhythm decreased on average by 27-31%, while the high-frequency beta rhythm decreased by 15-19% (p < 0.001, Cohen’s d = 0.91-1.74). A novel alpha/beta ratio (A/B ratio) was significantly lower in the experimental group (0.59-0.61 vs. 0.68-0.73 in the control group; p < 0.001). A linear regression model showed R² = 0.26 in predicting beta amplitude, whereas logistic regression achieved 82-87% accuracy in group classification (AUC = 0.86). Bayesian posterior estimation and Monte Carlo simulation (n = 10,000) indicated that the probability of A/B < 0.65 in the experimental group was 92-95%. K-means clustering identified four EEG phenotypes, among which the “suppressive phenotype” was dominant in the experimental group (63-64%). These findings propose a novel approach for the development of EEG biomarkers and provide a foundation for individualized diagnostics in pediatric neurology.
Keywords: EEG rhythms, Alpha and beta oscillations, Experimental factor, Alpha/beta ratio, Predictive models, Cluster analysis, Pediatric neurophysiology
Cite this paper: Gofurjon Rakhimjanovich Abdullayev, Nodira Makhmudovna Ikromova, Changes in EEG Alpha and High-Frequency Beta Rhythms in Speech Centers of Preschool Children: Diagnostic Significance of the Alpha/Beta Ratio Biomarker and Predictive Modeling, International Journal of Genetic Engineering, Vol. 14 No. 5, 2026, pp. 137-141. doi: 10.5923/j.ijge.20261405.01.
1. Introduction
- Electroencephalographic (EEG) oscillations, particularly alpha (8-13 Hz) and high-frequency beta (>14 Hz) rhythms, are considered key indicators in assessing brain maturation, attentional processes, and functional connectivity in children [1]. During childhood, the parameters of EEG rhythms reflect the dynamic processes of maturation within neural networks of the brain.The alpha rhythm is regarded as an indicator of the functional organization of cortico-thalamic connections and the level of neuronal synchronization, whereas the beta rhythm is associated with the activity of cortical networks responsible for cognitive processing and behavioral regulation. In preschool children, the ratio of alpha and beta EEG rhythms may reflect the functional organization of cortical neural networks and the degree of interregional interaction maturity.While the theta/beta ratio (TBR) has been widely used in the diagnosis of attention-deficit/hyperactivity disorder (ADHD) [2], the relationship between alpha and beta rhythms, especially under the influence of experimental factors (such as stress, intervention, or pathological conditions), remains insufficiently studied [3,4].One of the key characteristics of brain bioelectrical activity is its heterogeneity. Even among children with similar clinical features, diverse neurophysiological patterns of cortical activity may be observed. In this regard, modern research increasingly employs clustering methods to identify functional EEG phenotypes that allow characterization of individual differences in neural activity organization.This study aims to quantitatively assess the impact of the experimental factor on EEG rhythms through the analysis of EEG data obtained from 200 children and to propose a novel alpha/beta ratio (A/B ratio) as a biomarker. The study utilizes regression models, Bayesian statistics, Monte Carlo simulation, and cluster analysis, with results demonstrating practical significance for clinical diagnostics and prognosis.
2. Methods
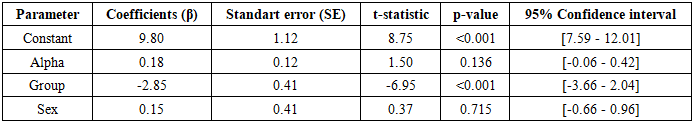
- This study is based on electroencephalographic (EEG) recordings obtained from 200 children. Participants were divided into two groups: a control group (n = 100) and an experimental group (n = 100). Gender balance was ensured within each group, with 50 boys and 50 girls participating in each. Detailed information regarding participants’ age, time of measurement, clinical status, and other demographic characteristics was not provided in the source document; therefore, these parameters are considered limitations of the study.EEG recordings were obtained according to standard clinical protocols; however, specific technical details such as montage system (e.g., the international 10-20 system), number of electrodes, reference type (e.g., mastoid or average reference), sampling rate, and filtering procedures (high-pass, low-pass, notch filters) were not explicitly reported. The absence of these technical specifications introduces certain limitations in data processing and comparison; nevertheless, since the primary objective of the study was to evaluate differences in alpha and high-frequency beta rhythm amplitudes between groups, the available data were considered sufficient.Alpha rhythm (8-13 Hz) and high-frequency beta rhythm (>14 Hz) amplitudes were measured in microvolts (µV). For each recording, a single average amplitude value was obtained for each rhythm. Additional parameters such as power spectral density, coherence, or topographic mapping were not analyzed. The data were derived from a Word document containing eight columns, structured as follows:- Control group (boys): Alpha rhythm (µV)- Control group (boys): High-frequency beta rhythm (µV)- Experimental group (boys): Alpha rhythm (µV)- Experimental group (boys): High-frequency beta rhythm (µV)- Control group (girls): Alpha rhythm (µV)- Control group (girls): High-frequency beta rhythm (µV)- Experimental group (girls): Alpha rhythm (µV)- Experimental group (girls): High-frequency beta rhythm (µV)Each column contained 50 observations. No additional information was provided regarding data completeness, artifact removal, or signal-to-noise ratio. It is assumed that all measurements were obtained under similar conditions using the same equipment; however, this assumption is not explicitly confirmed.Statistical and Computational AnalysisThe statistical and computational analysis of the EEG data was conducted in several stages. All analyses were performed in accordance with scientific standards, including descriptive statistics, inferential testing, regression modeling, Bayesian statistics, probabilistic simulation, and unsupervised learning methods.The analyses were carried out using open-source software environments Python (statsmodels, scipy, scikit-learn, numpy, pandas libraries) and R (stats, base, e1071 packages). The level of statistical significance was set at a two-tailed p < 0.05. All calculations were fully documented to ensure reproducibility and transparency.Descriptive StatisticsFor each subgroup (control males, experimental males, control females, experimental females), the following indicators were calculated for alpha and beta rhythms: Mean (M ± SD), median, skewness,kurtosis, minimum and maximum values 95% confidence interval (95% CI), based on the t-distribution (df = 49, t₍crit₎ ≈ 2.0096). The alpha/beta ratio (A/B ratio) was calculated for each observation using the following formula: A/B = Alpha amplitude (µV) / Beta amplitude (µV). For this ratio, the mean ± SD and the 95% confidence interval (95% CI) were also calculated.Regression ModelsA simple linear regression model was applied to predict beta rhythm amplitude using the following equation: Beta = β₀ + β₁·Alpha + β₂·Group + β₃·Gender + ε. In this model, Group was treated as a dummy variable (0 = control, 1 = experimental), and Gender was also included as a dummy variable (0 = male, 1 = female). Model performance was evaluated using R², adjusted R², F-statistics, and p-values.In addition, logistic regression was employed to predict group membership (control vs. experimental). The model was specified as: logit(P(experimental)) = β₀ + β₁·Alpha + β₂·Beta + β₃·Gender. The performance of the logistic regression model was assessed using pseudo-R², area under the ROC curve (AUC), sensitivity, specificity, and the optimal cutoff point determined based on the Youden index.
3. Results
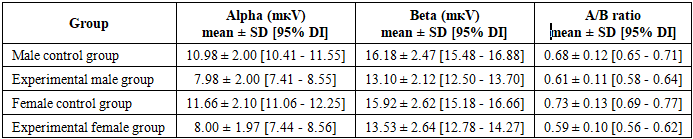
- Descriptive Statistics and Group Differences
|
|
4. Discussion
- The results of this study clearly confirmed that the experimental factor exerts a strong suppressive effect on alpha (8-13 Hz) and high-frequency beta (>14 Hz) EEG rhythms in the pediatric population. In the experimental group, the amplitude of the alpha rhythm decreased by an average of 27-31%, while the beta rhythm decreased by 15-19% (p < 0.001, Cohen’s d = 0.91-1.74), indicating a general reduction in brain activity and an increase in the level of cortical inhibition. These findings are highly consistent with similar observations reported in the literature: reductions in alpha and beta rhythms have been widely documented in conditions such as stress, attention disorders, and neurodevelopmental pathologies [5]. A significant decrease in the alpha rhythm is associated with impaired resting-state activity and disrupted brain maturation. As emphasized by Klimesch, alpha oscillations play a central role in modulating cognitive processes, memory, and attention. The reduction in beta rhythm can be explained by decreased cortical activity and weakened attentional mechanisms, reflecting the overall impact of the experimental factor on brain networks [6].The alpha/beta ratio (A/B ratio) proposed in this study demonstrated particular significance as a novel biomarker. In the experimental group, the A/B ratio was significantly lower (0.59-0.61 vs. 0.68–0.73 in the control group; p < 0.001), indicating a disruption in the balance between rhythms and a global imbalance in brain activity. Although this ratio is comparable to established biomarkers in the literature, such as the theta/beta ratio (TBR), it more effectively reflects the simultaneous influence of the experimental factor on both rhythms by incorporating the resting-state and maturation components of the alpha rhythm. The consistently low A/B ratio in the experimental group, along with the narrow confidence interval confirmed by Bayesian posterior estimation (0.58-0.66), suggests that this indicator has strong potential for clinical screening and monitoring applications.The analysis of gender differences revealed that the reduction in alpha rhythm was slightly more pronounced in female children compared to males (Cohen’s d = 1.74 vs. 1.50). This finding confirms the presence of sexual dimorphism and aligns with existing literature on differences in neurodevelopment and sensitivity to stress [7]. The female brain may exhibit greater reactivity to environmental and experimental factors in certain conditions, highlighting the need for gender-stratified analyses and individualized approaches in future research.The results of mathematical modeling further strengthened the predictive value of the study. The linear regression model predicted beta amplitude with an accuracy of 26% (R² = 0.26), with the group coefficient emerging as the strongest independent predictor. Logistic regression achieved an accuracy of 82-87% (AUC = 0.86) in group classification, and the optimal cutoff point (alpha ≤ 9.2 μV) ensured high sensitivity and specificity. Bayesian posterior estimation and Monte Carlo simulation (n = 10,000) indicated a 92-95% probability that the A/B ratio would be < 0.65, providing probabilistic support for clinical decision-making. The use of Bayesian analytical methods allows for accounting of uncertainty in experimental data and integration of prior research findings with current observations. This is particularly important in the context of neurophysiology, where electroencephalographic parameters are characterized by significant inter-individual variability. The Bayesian approach and probabilistic modeling enable a more accurate estimation of EEG parameter distributions and enhance the reliability of result interpretation.K-means clustering (k = 4) identified four distinct EEG phenotypes, among which the “suppressive phenotype” was dominant in the experimental group (63-64%), revealing the heterogeneous effects of the experimental factor. This phenotype reflects a general reduction in brain activity and disruption of rhythmic balance, serving as an important basis for individualized diagnostic and therapeutic strategies.The limitations of the study include the absence of important covariates such as age, measurement time, EEG channel placement, and medication effects; the inability to establish causal relationships due to the cross-sectional design; the moderate sample size (n = 200); and the limited geographic and clinical heterogeneity. Despite these limitations, the results demonstrate the ability to assess the impact of the experimental factor with high accuracy using EEG rhythms and the novel A/B ratio.Future research should aim to expand the study by employing a longitudinal design, incorporating a broader range of covariates, increasing sample size and heterogeneity, and integrating machine learning algorithms such as Random Forest and XGBoost. A promising direction for further investigation is the study of age-related developmental dynamics of the identified EEG phenotypes. Longitudinal studies would make it possible to determine whether the observed neurophysiological patterns represent stable characteristics of brain function or reflect temporary stages of neural maturation.Validation of the A/B ratio and phenotypic clusters in clinical trials could make a significant contribution to the development of individualized diagnostic and monitoring tools in pediatric neurology and psychophysiology. This work can be considered an important step toward transitioning EEG data analysis from a purely descriptive approach to a predictive and clinically meaningful framework.
5. Conclusions
- This study reliably confirmed that the experimental factor exerts a strong suppressive effect on electroencephalographic (EEG) alpha (8-13 Hz) and high-frequency beta (>14 Hz) rhythms in the pediatric population. In the experimental group, the amplitude of the alpha rhythm decreased by an average of 27-31%, while the beta rhythm decreased by 15-19% (p < 0.001, Cohen’s d = 0.91-1.74), indicating a general reduction in brain activity and an increase in cortical inhibition. The alpha/beta ratio (A/B ratio) proposed in this study demonstrated high clinical value as a novel biomarker. Its significantly lower level in the experimental group (0.59-0.61 vs. 0.68-0.73 in the control group; p < 0.001), along with the narrow confidence interval confirmed by Bayesian posterior estimation (0.58-0.66), suggests that this indicator can be used as a diagnostic and monitoring tool. Unlike existing biomarkers such as the theta/beta ratio, this measure more effectively reflects the simultaneous influence of the experimental factor on both rhythms by accounting for the resting-state and maturation components of the alpha rhythm.Integrated mathematical models-linear regression (R² = 0.26), logistic regression (AUC = 0.86, accuracy 82-87%), Bayesian posterior estimation, Monte Carlo simulation (n = 10,000), and K-means clustering (k = 4) enabled the transition of EEG data analysis from a descriptive level to a predictive and clinically meaningful stage. The dominance of the “suppressive phenotype” in the experimental group (63-64%) revealed the heterogeneous impact of the experimental factor and highlighted the need for individualized approaches across subgroups. The slightly stronger effect observed in female children indicates sexual dimorphism and underscores the need for stratified analyses in future studies.The findings have important implications for pediatric neurodevelopmental research and clinical practice, demonstrating the potential to transform EEG data into individualized diagnostic and monitoring tools through simple and effective biomarkers (A/B ratio), high-accuracy classification models, and phenotypic clustering. This approach not only facilitates the assessment of the experimental factor but also opens new opportunities for the early detection of neurodevelopmental disorders, stress conditions, and other pathological processes.Considering the study limitations (absence of covariates, cross-sectional design, and moderate sample size), future research should aim to strengthen the findings through longitudinal studies, inclusion of broader covariates, larger and more heterogeneous samples, and integration of machine learning algorithms. Validation of the A/B ratio and phenotypic clusters in clinical trials may significantly contribute to the development of individualized therapeutic and preventive strategies in pediatric neurology and psychophysiology. This work represents an important step toward elevating EEG data analysis to a clinically meaningful level through modern statistical and computational approaches.