Tosheva Dinara Muzrafovna1, 2, Amanturdiyev Ikrom Gulomovich3
1Laboratory Human DNA forensic biological expertise, Republican Center of Forensic Expertise named after Kh.Sulaymanova under the Ministry of Justice of the Republic of Uzbekistan, Tashkent, Uzbekistan
2PhD Candidate, National University of Uzbekistan named after Mirzo Ulugbek, Tashkent, Uzbekistan
3DSc, Department of Botany and Genetics, National University of Uzbekistan named after Mirzo Ulugbek, Tashkent, Uzbekistan
Correspondence to: Tosheva Dinara Muzrafovna, Laboratory Human DNA forensic biological expertise, Republican Center of Forensic Expertise named after Kh.Sulaymanova under the Ministry of Justice of the Republic of Uzbekistan, Tashkent, Uzbekistan.
| Email: |  |
Copyright © 2026 The Author(s). Published by Scientific & Academic Publishing.
This work is licensed under the Creative Commons Attribution International License (CC BY).
http://creativecommons.org/licenses/by/4.0/

Abstract
This study reports allele frequency data and population genetic characteristics of four autosomal short tandem repeat (STR) loci—D16S539, D18S51, Penta D, and D22S1045—in the population of Uzbekistan. Genotyping was performed on 1,538 unrelated individuals representing different geographic regions of the country. Allele frequencies, heterozygosity parameters, Hardy–Weinberg equilibrium, and key statistical indices were calculated to assess genetic variability and marker informativeness. All analyzed loci demonstrated high levels of polymorphism and discrimination power. The combined random match probability for the four loci was approximately 9.8 × 10⁻⁷, corresponding to a combined power of discrimination of ~0.999999. No significant deviations from the Hardy–Weinberg equilibrium were observed after Bonferroni correction. Comparative analysis revealed that the Uzbek population exhibits the greatest genetic similarity to Asian populations, while displaying distinct population-specific allelic features. UPGMA clustering based on Nei’s genetic distances confirmed these relationships and reflected expected geographic patterns. The obtained data provide a valuable population-specific reference for genetic engineering, population genetic analyses, and related applications.
Keywords:
Population, Comparison, Kinship, Loci, Frequency, Allele, Uzbekistan
Cite this paper: Tosheva Dinara Muzrafovna, Amanturdiyev Ikrom Gulomovich, Allele Frequency Distribution of Four STR Loci (D16S539, D18S51, Penta D and D22S1045) in Population of Uzbekistan, International Journal of Genetic Engineering, Vol. 14 No. 1, 2026, pp. 39-50. doi: 10.5923/j.ijge.20261401.07.
1. Introduction
Autosomal short tandem repeat (STR) markers are widely applied in population genetics and genetic engineering due to their high polymorphism, codominant inheritance, and genome-wide distribution. Analysis of STR allele frequencies provides essential information on genetic diversity, population structure, and interpopulation relationships.D16S539 and D18S51 are highly polymorphic tetranucleotide STR loci included in the CODIS core set, while Penta D is a pentanucleotide marker commonly used in extended STR panels. D22S1045, although less extensively studied, contributes additional discriminatory power and is included in expanded forensic and population genetic systems. Together, these loci form an informative marker set for population-level analyses.Uzbekistan, located in Central Asia, has a complex demographic history shaped by multiple migration events and cultural interactions. However, population genetic data for several widely used STR loci remain limited for this region. The present study aims to characterize allele frequency distributions of four autosomal STR loci in the Uzbek population and to compare the results with data from other continental populations, thereby contributing new reference data for Central Asian population genetics.D16S539 is a tetranucleotide short tandem repeat (STR) marker located on the short arm of chromosome 16 (16q24-qter) with the repeat motif [GATA]. It demonstrates a high degree of allelic variability, making it particularly valuable in forensic DNA profiling, population genetics, and paternity testing. D16S539 is one of the core CODIS loci used in international forensic databases for human identification.D18S51 is a tetranucleotide short tandem repeat (STR) marker located on the long arm of chromosome 18 (18q21.33). Its repeat motif is [AGAA], and it is one of the most polymorphic STR loci used in forensic practice. D18S51 exhibits a broad allelic range, making it highly informative for human identification, kinship testing, and population genetic studies. It is also one of the CODIS core loci.Penta D is a simple pentanucleotide tandem repeat marker located on the long arm of chromosome 21 (21q22.3) containing the AAAGA repeat motif. It is widely used in forensic genetics and population studies due to its high level of polymorphism and informative power. Penta D is included in several standard STR marker panels for human identification and kinship analysis.D22S1045 is a tetranucleotide STR marker located on the long arm of chromosome 22 (22q12.3) with a [ATT]ₙAAT repeat structure. It exhibits moderate allelic variability and is included in extended forensic marker panels, such as those recommended by the European Standard Set (ESS). D22S1045 is particularly valuable for increasing the discrimination power of DNA profiling in forensic and population genetics applications [1].This study aims to evaluate allele distribution for D16S539, D18S51, Penta D, and D22S1045 loci in Uzbekistan, to calculate some forensic statistical parameters, and to compare data with those of other populations.Uzbekistan is a landlocked country located in Central Asia, bordered by Kazakhstan, Kyrgyzstan, Tajikistan, Afghanistan, and Turkmenistan. It has a population of about 36 million people and covers an area of 448,978 km². Throughout history, Uzbekistan was an important center of the Silk Road, strongly influenced by Persian, Turkic, Arab, and Mongol civilizations. The region is known for its cultural diversity, reflected in the traditions, languages, and genetic background of its population.In modern history, Uzbekistan was part of the Russian Empire and later the Soviet Union until its independence in 1991. Because of its geographic position on the Silk Road and its political history, the country still preserves a rich mixture of cultures, combining ancient Persian and Turkic elements with Russian and other regional influences.D16S539 and D18S51 are among the most informative and frequently studied STR loci in forensic and population genetics worldwide. Penta D has also been widely investigated, but data concerning the Uzbek population remain limited. D22S1045, in contrast, has been less extensively analyzed and is more commonly reported in European population studies. Considering Uzbekistan’s unique historical role as a crossroads of the Silk Road and its rich mixture of Turkic, Persian, Arab, and Mongol influences, the present study is of particular importance. It not only expands knowledge on these four loci but also provides valuable insights into the genetic diversity of a population with a distinct cultural and historical background.
2. Materials and Methods
2.1. Objects of the Research
The subjects of the study were blood samples and dried saliva on sterile gauze tampons, selected from 1.538 individuals.
2.2. Samples Collection
Samples were collected from unrelated individuals from 12 geographic regions of Uzbekistan (n=1000), the Nukus region of Karakalpakistan (n=100), parental genotypes from the ‘family’ dataset generated during paternity and maternity testing (n=338), and genotypes from the forensic reference database (n=100).The collection of biological samples was carried out in strict accordance with ethical standards and the current legislation of the Republic of Uzbekistan on the protection of the rights of participants in biomedical research. All donors provided informed consent for the use of their samples for scientific purposes. National affiliation was determined based on questionnaire data voluntarily provided by participants during the collection of saliva samples. The procedures used in this study followed the ethical guidelines and the Declaration of Helsinki [2].
2.3. DNA Extraction
Genomic DNA was extracted from dried saliva and blood using the Swab SolutionTM Kit (Promega) protocol [3].
2.4. DNA Quantification
After isolation, the quantity and qualitative analysis of genomic DNA of each sample were determined by quantitative real-time polymerase chain reaction (PCR) using the Quantifiler™ Trio DNA Quantification Kit (Applied Biosystems, USA) [4], which includes an internal positive control to test for the presence of PCR inhibitors in the DNA extracts. Quantitative real-time PCR was performed on 7500 Real-Time PCR System software (Applied Biosystems, USA).
2.5. PCR Amplification and Detection
Amplification of four STR loci was performed by using the Versa Plex™ 27 PY System Kit (Applied Biosystems, USA) [5] in the Proflex 3x32 well PCR System (Thermo Fisher Scientific, Singapore) and Proflex 96 well PCR System (Thermo Fisher Scientific, Singapore) according to the manufacturer’s recommendations. The electrophoretic separation of the amplified PCR products was performed on the ABI 3500xl Genetic Analyser (Applied Biosystems, USA) [6]. GeneScan-600 LIZ was used as the internal lane standard. The data analysis and allele identification were performed using GeneMapper ID–X (Applied Biosystems, USA) (version 1.6) analysis software (Life Technologies) [7].
2.6. Statistical Analysis
The discriminatory power of four microsatellite loci was evaluated using standard forensic genetic parameters, including matching probability (MP), power of discrimination (PD), polymorphism information content (PIC), power of exclusion (PE), paternity index (PI), observed heterozygosity (Hobs), expected heterozygosity (Hexp), and the probability of deviation from Hardy–Weinberg equilibrium (p-value) [8,9]. The data were analyzed using modern statistical approaches applied in population genetics and forensic genetics. Specifically, matching probability, power of discrimination, polymorphism information content, power of exclusion, and typical paternity index were calculated using Power Stat Algorithms software, version 1.2 (Promega Corporation) [10,11].Allele frequencies, Hardy–Weinberg equilibrium, expected heterozygosity, observed heterozygosity, and population differentiation tests were carried out with the GenePop (v.4.7.5) software [12].Allelic frequencies for STRs were compared with previously published population data [13,14].
3. Results and Discussion
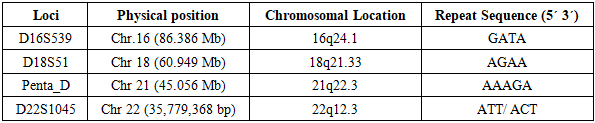
The presented data are based on the analysis of polymorphism at four STR loci in 1,538 unrelated individuals from the population of Uzbekistan. The genotyped loci are standard and are among the core 20 loci of the U.S. national CODIS database system [15]. The loci and their chromosomal position are shown in Table 1.Table 1. Genomic Position and Repeat Sequences of D16S539, D18S51, Penta D, D22S1045 STR Markers [1]
 |
| |
|
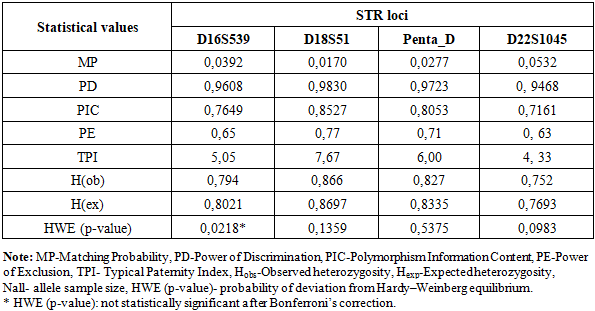
Statistical parameters characterizing the forensic efficiency and genetic variability of four autosomal STR loci (D16S539, D18S51, Penta D, and D22S1045) in the population of Uzbekistan are presented in Table 2.Table 2. Statistical population characteristics for D16S539, D18S51, Penta D, D22S1045 STR loci for population of Uzbekistan
 |
| |
|
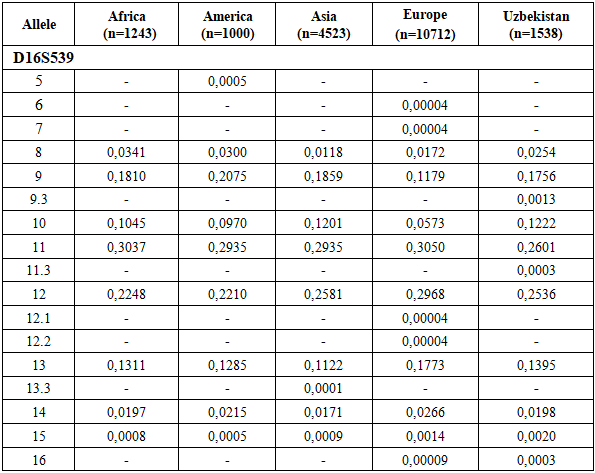
All analyzed loci demonstrated high discriminatory potential, as indicated by elevated values of the Power of Discrimination (PD), which ranged from 0.9468 (D22S1045) to 0.9830 (D18S51). Correspondingly, the Matching Probability (MP) values were low, varying between 0.0170 for D18S51 and 0.0532 for D22S1045, reflecting a low probability of random genotype matches between unrelated individuals.The Polymorphism Information Content (PIC) values exceeded 0.70 for all loci, indicating a high degree of polymorphism. The highest PIC was observed at D18S51 (0.8527), followed by Penta D (0.8053) and D16S539 (0.7649), while D22S1045 (0.7161) showed comparatively lower but still informative polymorphism.Observed heterozygosity (H_obs) values ranged from 0.752 (D22S1045) to 0.866 (D18S51) and were generally consistent with expected heterozygosity (H_exp), suggesting genetic equilibrium within the population. Slight differences between H_obs and H_exp were minimal and not systematic.The Power of Exclusion (PE) values varied from 0.63 (D22S1045) to 0.77 (D18S51), indicating moderate to high effectiveness of these loci for paternity testing. The Typical Paternity Index (TPI) values further supported this conclusion, with the highest value observed for D18S51 (7.67) and the lowest for D22S1045 (4.33).The combined random match probability (RMP) calculated for the four STR loci D16S539, D18S51, Penta D, and D22S1045 was approximately 9.8 × 10⁻⁷, resulting in a combined power of discrimination (PD) of ~0.999999. This indicates that the probability of distinguishing two unrelated individuals using this marker set exceeds 99.9999%.The combined power of exclusion (PE) reached 0.991, confirming the high efficiency of these loci for kinship and paternity testing. The combined paternity index (CPI) of approximately 10³ further demonstrates the strong forensic applicability of the analyzed STR panel. When used in combination with additional highly polymorphic markers, these loci provide robust discrimination power suitable for forensic identification in the population of Uzbekistan.Deviation from the Hardy–Weinberg equilibrium was tested by the p-value obtained by setting 100 batches with 5000 interactions per batch in the Markov chain algorithm [16]. No significant deviations from the Hardy–Weinberg equilibrium were observed, except for the D16S539 loci (p ≤ 0.05). After Bonferroni correction [17] (p = 0.05/23 = 0.0021 for the Hardy–Weinberg equilibrium test and p = 0.05/23 = 0.0021 for the linkage disequilibrium test), no locus showed a statistically significant deviation from Hardy–Weinberg equilibrium, and no pair of loci exhibited significant linkage disequilibrium [18]. This confirms the suitability of the dataset for population-genetic and forensic applications (Table 2).On this basis, the characteristics of allelic polymorphism of the molecular-genetic individualizing systems based on the STR loci D16S539, D18S51, Penta D, and D22S1045, established in the present study, can be used as reference parameters for standard probabilistic calculations in the evaluation of molecular-genetic results of personal identification and kinship analysis.The D18S51 and Penta D loci were found to be the most discriminating markers in the population of Uzbekistan in studies of genetic identification (PIC > 0.8). Taking into account the investigated geographic sample of individuals from Uzbekistan, these data allow the obtained results to be extrapolated to the general population of Uzbekistan. The identified allele frequency data for each allele of this marker set in representatives of the multi-ethnic population of Uzbekistan will ensure the highest level of reliability of forensic genetic expert examinations.Tables 3, 4, 5, and 6 present the allele frequency distributions of the D16S539, D18S51, Penta D, and D22S1045 loci in the studied population sample. For comparison, allele frequencies for African, American, Asian, and European populations are also shown [13,14]. The allele nomenclature used for the populations complies with the recommendations published by the DNA Commission of the International Society for Forensic Genetics (ISFG) [19]. The allele categories applied in STRidER are listed in Tables 3, 4, 5, and 6.Based on the obtained data, the allele frequency distribution of the D16S539 locus in the Uzbek population sample shows the greatest similarity to that observed in Asian populations. Nevertheless, the Uzbek sample demonstrates several population-specific features. In particular, genotypes containing rare alleles 5, 6, 7, 12.1, 12.2, and 13.3 are virtually absent in the Uzbek population, whereas these alleles are detected in other populations.Conversely, the presence of intermediate allelic variants 9.3 and 11.3 was observed in the Uzbek population sample; these variants are not characteristic of African, American, Asian, or European populations. This finding may be regarded as a distinctive feature of the Uzbek population and may reflect local microsatellite variation shaped by historical and demographic processes.In addition, certain alleles occur at elevated frequencies in the Uzbek population compared to other populations. For instance, allele 10 shows a higher frequency (0.1222) than in African and American populations, indicating local differences in allele spectrum structure. Allele 11 is the most prevalent allele in the Uzbek population (0.2601), consistent with its high frequency across African, American, Asian, and European populations, suggesting its universal predominance across diverse ethno-geographical groups. At the same time, the frequency of allele 12 (0.2536) in the Uzbek population is closer to values reported for Asian populations and slightly exceeds those observed in African and American populations. These findings further support the genetic affinity of the Uzbek population to Asian populations at the D16S539 locus and are consistent with general concepts of the population-genetic structure of Central Asian populations (Table 3).Allele frequency distribution of the D16S539 STR locus in different populations. The bar chart compares allele frequencies observed in African, American, Asian, European, and Uzbek populations across the detected allelic range, including microvariant alleles. The Uzbek population shows a generally similar distribution pattern to neighboring continental populations, while also exhibiting population-specific features reflected in the presence or absence of certain rare alleles and differences in allele frequencies (Figure 1).Table 3. Comparison of D16S539 loci allele frequencies in the Uzbek Population with other Populations [13,14]
 |
| |
|
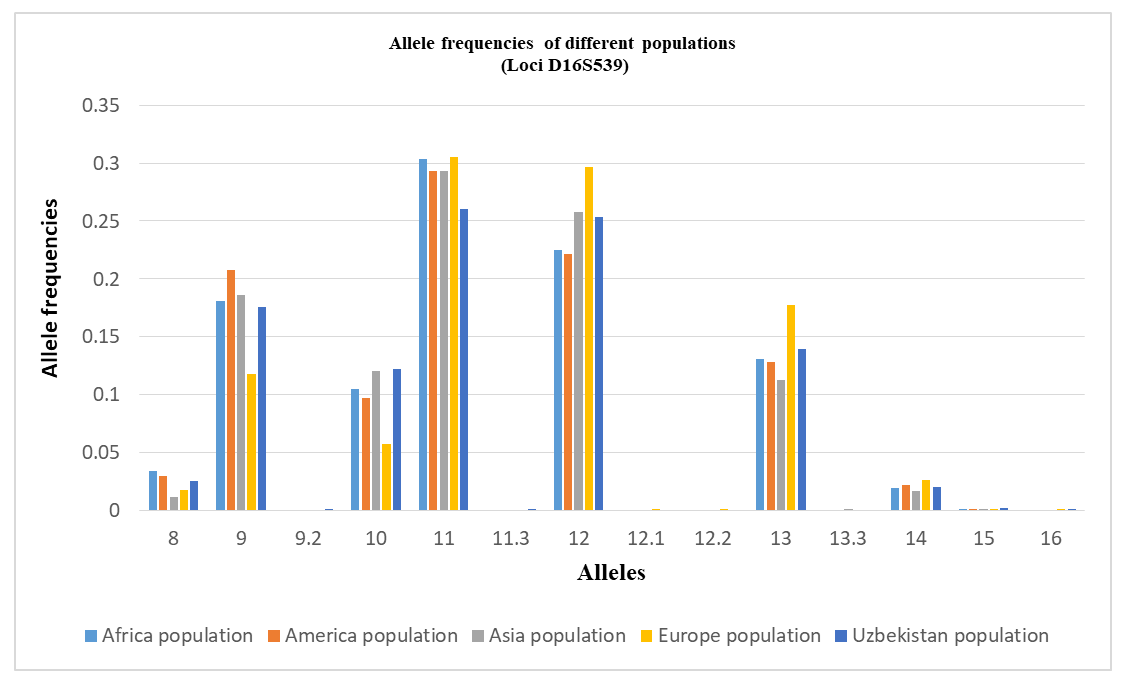 | Figure 1. Distribution diagram of allele frequencies of the D16S539 locus in populations |
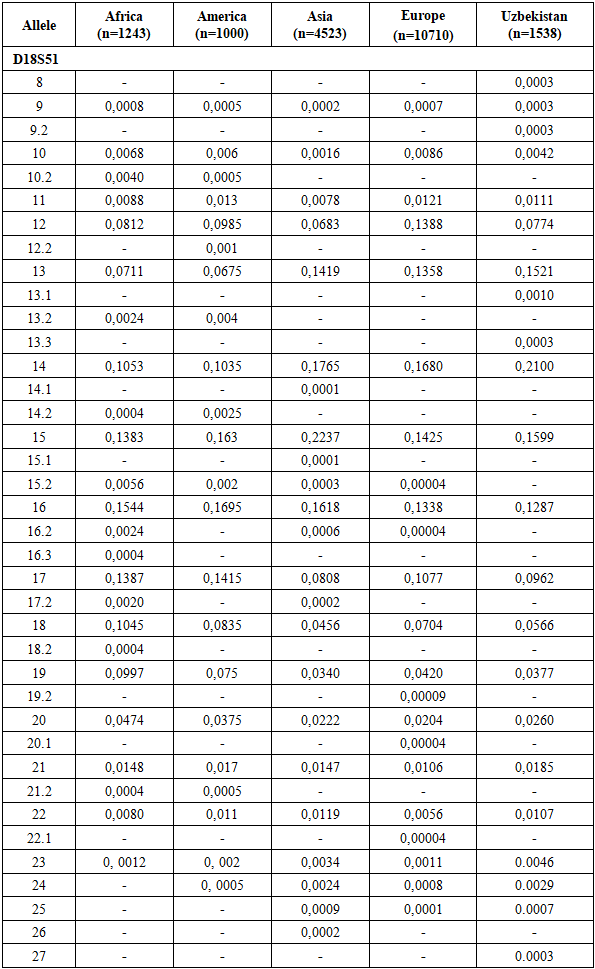
The allele frequency distribution of the D18S51 locus in the Uzbek population sample shows the greatest concordance with that of Asian populations. However, several population-specific features are evident. Genotypes containing rare alleles 10.2, 12.2, 13.2, 14.1, 14.2, 15.1, 15.2, 16.2, 16.3, 17.2, 18.2, 19.2, 20.1, 21.2, 22.1, and 26 are virtually absent in the Uzbek population, although they are reported in other populations.At the same time, allelic variants 8, 9.2, 13.1, 13.3, and 27 were detected exclusively in the Uzbek population and are not characteristic of African, American, Asian, or European populations, suggesting a specific feature of the Uzbek genetic profile.Several alleles show markedly higher frequencies in the Uzbek population. Allele 14 exhibits the highest frequency (0.2100), exceeding those reported for African (0.1053), American (0.1035), and European (0.1680) populations, and closely approximating Asian values (0.1765). A similar trend is observed for allele 15, with a frequency of 0.1599, comparable to Asian (0.2237) and American (0.1383) populations and higher than in Europeans (0.1425). Allele 13 also displays a relatively high frequency (0.1521), consistent with Asian and European populations and exceeding values reported for African and American populations.In contrast, alleles 17 and 18 show lower frequencies in the Uzbek population (0.0962 and 0.0566, respectively) compared to Asian populations but are comparable to European and American data. Alleles 19–21 demonstrate a gradual decline in frequency, with Uzbek values occupying an intermediate position between Asian and European populations. Rare alleles 22–25 and 27 occur at very low frequencies (≤ 0.0107), consistent with the general decline in frequencies of longer alleles at the D18S51 locus and reflecting its high polymorphic nature.Overall, these results indicate that the allele frequency distribution of D18S51 in the Uzbek population most closely corresponds to the Asian genetic profile while exhibiting distinct local characteristics likely shaped by historical-demographic processes and the genetic contributions of diverse ethnic components (Table 4).Allele frequency distribution of the D18S51 STR locus in African, American, Asian, European, and Uzbek populations. The diagram illustrates interpopulation differences in allele frequencies while maintaining a generally similar distribution pattern characteristic of this highly polymorphic locus (Figure 2).Table 4. Comparison of D18S51 loci allele frequencies in the Uzbek Population with other Populations [13,14]
 |
| |
|
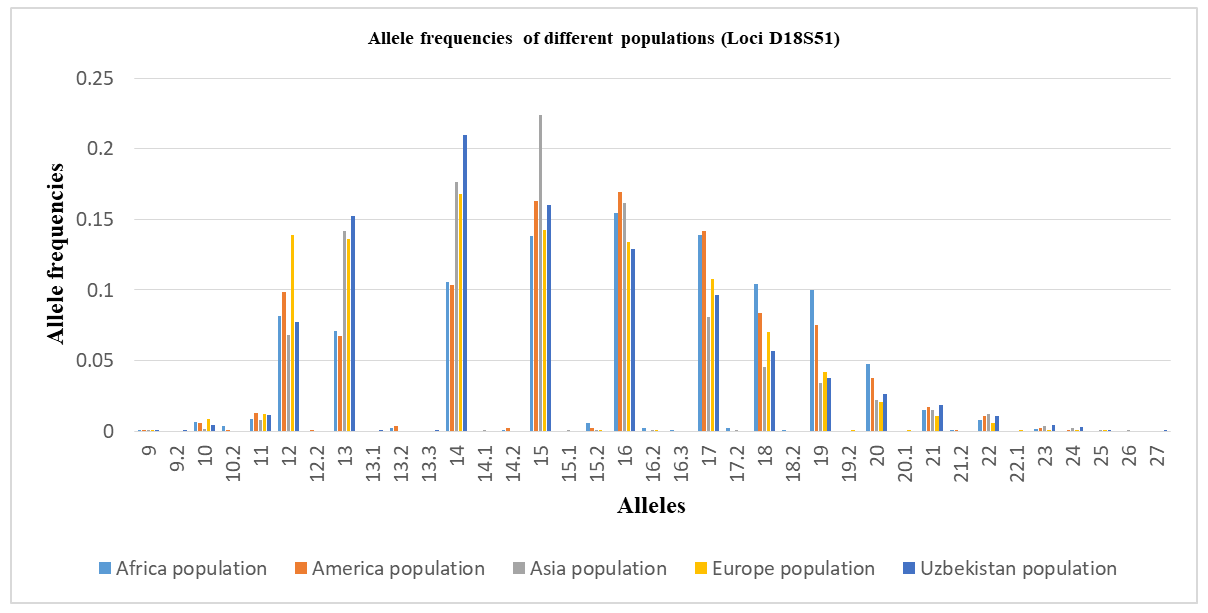 | Figure 2. Distribution diagram of allele frequencies of the D18S51 locus in populations |
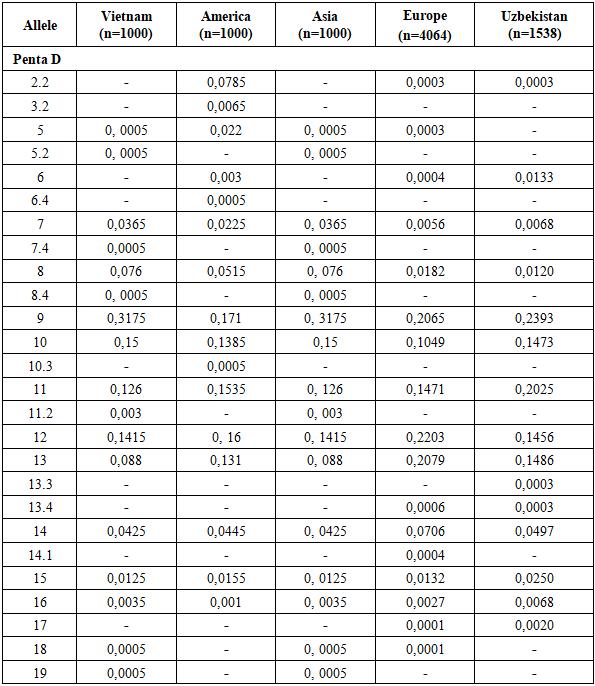
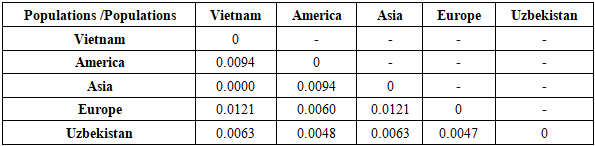
The allele frequency distribution of the Penta D locus in the Uzbek population sample shows the greatest similarity to Asian populations. Nevertheless, the Uzbek population exhibits specific features. Genotypes containing rare alleles 3.2, 5, 5.2, 6.4, 7.4, 8.4, 10.3, 11.2, 14.1, 18, and 19 are virtually absent, although they are reported in other populations.Conversely, the presence of the intermediate allele 13.3 was detected exclusively in the Uzbek population and is not characteristic of Vietnamese, American, Asian, or European populations, suggesting a population-specific feature.Relatively high frequencies of alleles 9 (0.2393), 10 (0.1473), and 11 (0.2025) were observed in the Uzbek population, distinguishing it from European and American populations, where these alleles occur at lower frequencies. In particular, allele 9 shows a higher frequency than in European (0.2065) and American (0.1710) populations, while the high prevalence of allele 11 further aligns the Uzbek population with Asian and Vietnamese populations.In contrast, allele 8 shows the lowest frequency in the Uzbek population (0.0120), whereas it occurs at higher frequencies in Asian, European, and American populations. The frequency of allele 14 (0.0497) is comparable to Asian and Vietnamese populations but exceeds that observed in European populations, indicating an intermediate position of the Uzbek population for this allele.Overall, the allele frequency profile of key Penta D alleles in the Uzbek population is most similar to Asian and Southeast Asian populations, while also exhibiting unique features such as rare intermediate alleles and variability in allele frequencies. These findings emphasize the importance of accounting for regional specificity in population-genetic and forensic genetic studies (Table 5). Allele frequency distribution of the Penta D STR locus in Vietnamese, American, Asian, European, and Uzbek populations, demonstrating population-specific differences in allele frequencies typical of a highly polymorphic locus (Figure 3).Table 5. Comparison of Penta D loci allele frequencies in the Uzbek Population with other Populations [13,14]
 |
| |
|
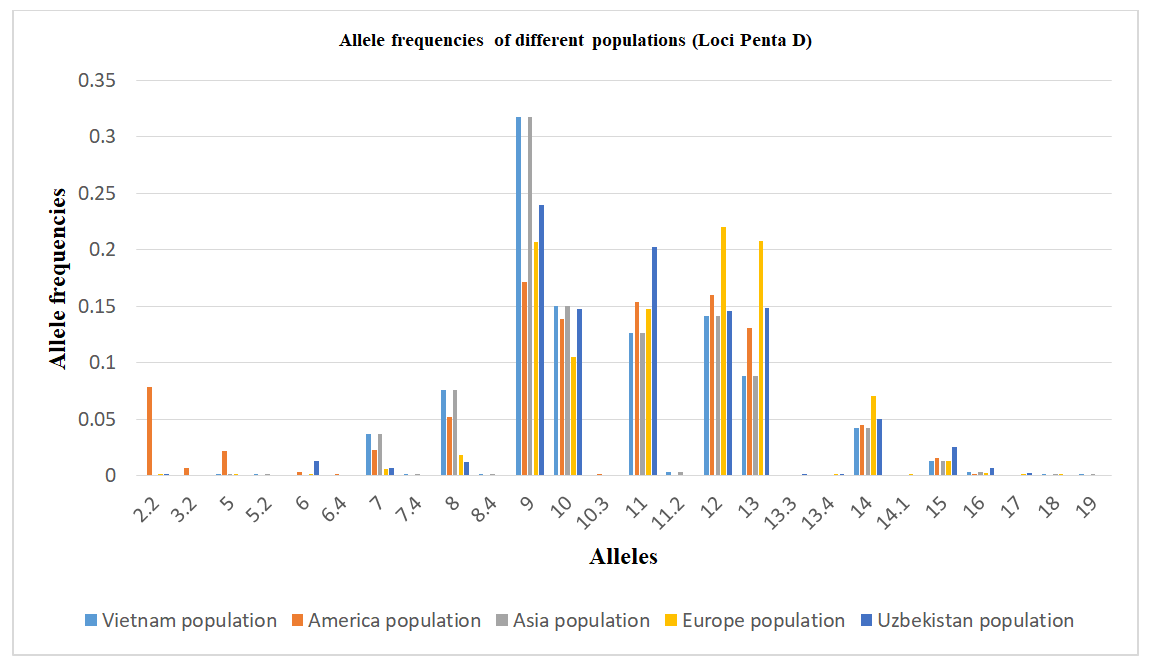 | Figure 3. Distribution diagram of allele frequencies of the Penta D locus in populations |
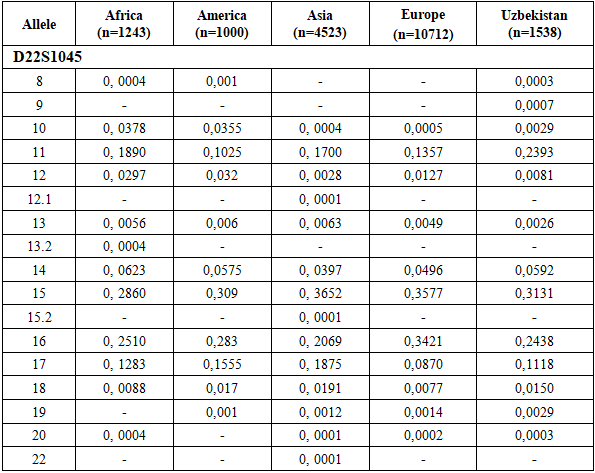
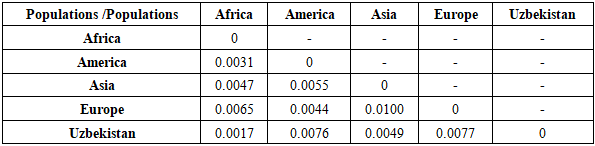
The allele frequency distribution of the D22S1045 locus in the Uzbek population sample shows the greatest similarity to Asian populations. However, several population-specific characteristics are observed. Genotypes containing rare alleles 12.1, 13.2, 15.2, and 22 are virtually absent in the Uzbek population, although they are present in other populations.Conversely, allele 9 was detected in the Uzbek population but is not characteristic of African, American, Asian, or European populations, suggesting a population-specific feature. In addition, relatively high frequencies of alleles 11 and 19 distinguish the Uzbek population from other populations, further emphasizing its population specificity. In contrast, allele 13 shows a comparatively low frequency in the Uzbek population, whereas it occurs at higher frequencies in other populations.Taken together, these results confirm the genetic affinity of the Uzbek population to Asian populations while highlighting unique features that reflect regional genetic specificity (Table 6).Allele frequency distribution of the D22S1045 STR locus in Uzbek, Asian, African, American, and European populations, illustrating interpopulation variability in allele frequencies typical of a highly polymorphic marker (Figure 4).Table 6. Comparison of D22S1045 loci allele frequencies in the Uzbek Population with other Populations [13,14]
 |
| |
|
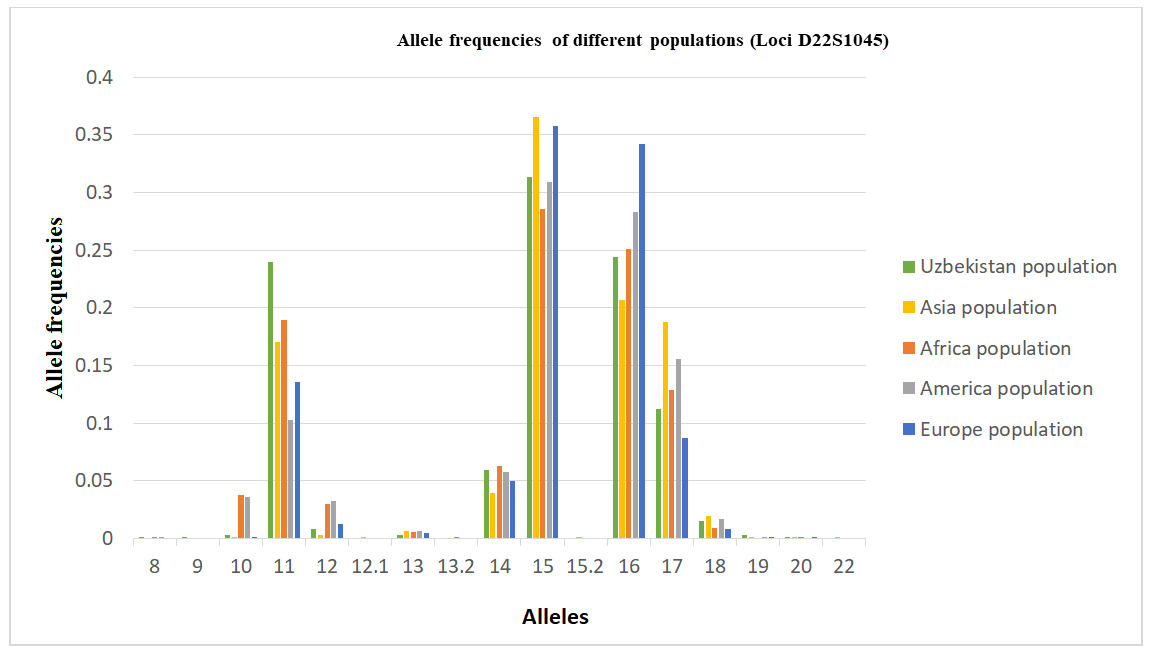 | Figure 4. Distribution diagram of allele frequencies of the D22S1045 locus in populations |
Thus, the Uzbek population occupies an intermediate position between neighboring regions while retaining its own unique allelic characteristics, reflecting historical migration processes and the genetic diversity of the region.Based on genotypic frequencies of four STRs (D16S539, D18S51, Penta D, D22S1045) for which data are available [13,14], pairwise genetic distances were calculated between populations, using Nei’s formulas implemented in PHYLIP software. The UPGMA tree was built from the Nei genetic distance matrix using the PHYLIP software package version 3.69 [20], see fig. 1. Calculated pairwise FST genetic distances between the five populations are reported in Tables 7, 8, 9, 10. Table 7. Genetic distances (FST analysis) between the studied sample and other populations for the D16S539 loci
 |
| |
|
Table 8. Genetic distances (FST analysis) between the studied sample and other populations for the D18S51 loci
 |
| |
|
Table 9. Genetic distances (FST analysis) between the studied sample and other populations for the Penta D loci
 |
| |
|
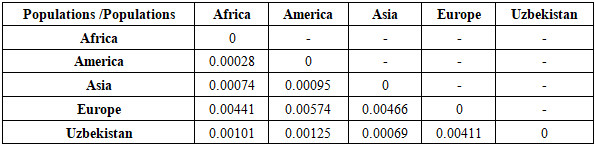
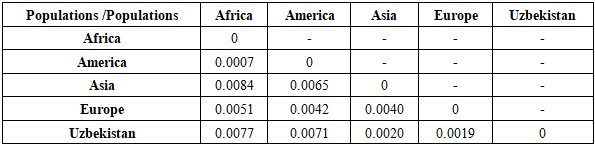
Table 10. Genetic distances (FST analysis) between the studied sample and other populations for the D22S1045 loci
 |
| |
|
A UPGMA dendrogram was constructed based on Nei’s [21] genetic distances calculated from allele frequencies of four autosomal STR loci (D16S539, D18S51, D22S1045, and Penta D). African and American populations formed a close cluster, while the Uzbek population grouped with the European population, reflecting their genetic affinity. The Asian population occupied an intermediate position between these clusters. Overall, the topology of the tree corresponds well with geographical and population-genetic expectations.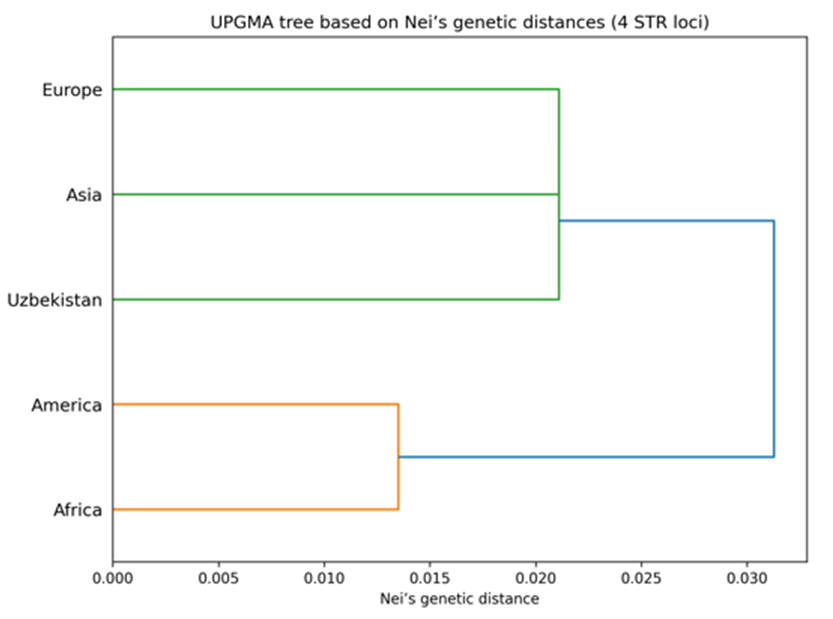 | Figure 5. UPGMA tree based on Nei’s genetic distances derived from four autosomal STR loci among five populations. African and American populations form a close cluster, while the Uzbek population clusters with the European population, with the Asian population showing an intermediate position |
4. Conclusions
The results demonstrate that the four analyzed STR loci—D16S539, D18S51, Penta D, and D22S1045—are highly informative and forensically valuable in the Uzbek population. Among them, D18S51 consistently showed the highest forensic efficiency, characterized by the lowest MP, highest PD, highest PIC, and the greatest values of heterozygosity, PE, and TPI. These findings are consistent with previous population studies reporting D18S51 as one of the most polymorphic autosomal STR loci worldwide.The locus Penta D also exhibited strong forensic performance, with high PIC (0.8053), PD (0.9723), and balanced heterozygosity values, confirming its robustness for both individual identification and kinship analysis. The intermediate TPI and PE values further support its applicability in paternity testing scenarios.D16S539 demonstrated stable and reliable parameters, with high heterozygosity and satisfactory discrimination power, reinforcing its long-standing inclusion in forensic STR panels. Although its MP value was higher than that of D18S51 and Penta D, it remains an informative marker when used in combination with other loci.In contrast, D22S1045, while still polymorphic and informative, displayed comparatively lower values of PIC, PE, and TPI. This suggests a relatively reduced individual contribution to discrimination and exclusion power. However, its PD value remained high (>0.94), indicating that the locus still contributes meaningfully to multilocus forensic systems.The close agreement between observed and expected heterozygosity values across all loci, along with conformity to Hardy–Weinberg equilibrium, suggests random mating and absence of significant population substructure for these markers in the Uzbek population. This genetic stability enhances the reliability of allele frequency estimates and supports their use as a national forensic reference database.Overall, the combined analysis confirms that the studied STR loci are genetically stable, highly polymorphic, and suitable for forensic identification and paternity testing in the population of Uzbekistan. Their inclusion in multilocus STR panels substantially increases the statistical power of forensic DNA analyses and contributes valuable data to the population genetics of Central Asia.The comparative analysis of allele frequency distributions across four autosomal STR loci (D16S539, D18S51, Penta D, and D22S1045) demonstrates that the Uzbek population consistently shows the greatest genetic similarity to Asian populations. For all loci examined, the predominant alleles and overall frequency patterns closely correspond to those reported for Asian datasets, supporting the genetic affiliation of the Uzbek population with Central Asian and broader Asian gene pools.At the same time, all loci exhibit population-specific features, including the absence of multiple rare alleles observed in other continental populations and the presence of unique or intermediate allelic variants not reported elsewhere. Such variants (e.g., 9.3 and 11.3 at D16S539; 13.3 at Penta D; and allele 9 at D22S1045) likely reflect localized microsatellite evolution influenced by historical migrations, genetic drift, founder effects, and long-term demographic processes in Central Asia.Several loci (particularly D18S51 and Penta D) show elevated frequencies of specific alleles that distinguish the Uzbek population from European and American populations while aligning it more closely with Asian and Southeast Asian populations. The Uzbek population frequently occupies an intermediate position between Asian and European populations for certain alleles, consistent with the historically documented role of Central Asia as a crossroads of human migration and admixture.The observed allele frequency profiles, together with the high level of polymorphism across all loci, confirm the suitability of these STR markers for forensic identification and population-genetic inference in Uzbekistan. Importantly, the results underscore the necessity of population-specific reference databases for accurate statistical interpretation in forensic casework and highlight the value of regional population studies for understanding the genetic structure of Central Asian populations.A UPGMA dendrogram was constructed using Nei’s genetic distances calculated from allele frequencies of four autosomal STR loci (D16S539, D18S51, D22S1045, and Penta D) to evaluate genetic relationships among the studied populations.The resulting tree shows that African and American populations form a close cluster, indicating relatively small genetic distances between them. The Uzbek population clusters with the European population, reflecting a higher level of genetic affinity between these two groups based on the analyzed STR markers. The Asian population occupies an intermediate position between the two main clusters.Overall, the topology of the UPGMA tree is consistent with geographic patterns and previously reported population-genetic data. Despite the limited number of loci analyzed, the selected STR markers demonstrate sufficient discriminatory power to reveal major interpopulation genetic relationships. These findings support the applicability of the obtained dataset for comparative population genetic and forensic studies.
Data Availability (Data Contribution)
The data obtained in this study on the distribution of allele frequencies of STR loci in the population of Uzbekistan represent a novel reference resource that can be used to expand existing databases, applied in forensic genetic examinations for probabilistic-statistical evaluation of genotype matches, and in population genetic studies.
Ethical Approval
This study was reviewed and approved by the ethics of the Collective Council of the Republican Center for Forensic Expertise (Republic of Uzbekistan).
Conflict of Interest
The authors have no relevant conflicts of interest to declare.
References
| [1] | https://strbase.nist.gov/ |
| [2] | World Medical Association 2013, World Medical Association Declaration of Helsinki: Ethical Principles for Medical Research Involving Human Subjects. JAMA, 310(20): 2191–2194. doi:10.1001/jama.2013.281053. |
| [3] | SwabSolution™ Kit, Technical Manual, Instructions for Use of Product DC8271, Revised 9/16, TMD037. |
| [4] | Quantifiler® Trio Quantification Kit User Guide, Applied Biosystems, Cat. № 4482910. |
| [5] | VersaPlex™ 27PY System for Use on the Applied Biosystems® Genetic Analyzers, Technical Manual, Instructions for Use of Product DC7020. |
| [6] | Applied Biosystems 3500/3500xl Genetic Analyzers User Guide (PN 4401689). |
| [7] | GeneMapper ® ID-X SoftwareVersion 1.6 New Features and Software Verification (PN 100073905). |
| [8] | Butler, J.M., 2005, Forensic DNA Typing. Biology, Technology, and Genetics of STR Makers. Academic Press, 2nd edition. |
| [9] | ISFG — Recommendations on biostatistics in paternity testing (Paternity Testing Commission, ISFG, 2006/2007. |
| [10] | ISFG — Materials 24th World Congress 2011, “Allele frequencies and forensic parameters were calculated with the Powerstats Version 1.2 (Promega Corp.). |
| [11] | http://www.promega.com/geneticidtools/powerstats |
| [12] | Rousset, François 2008, GENEPOP’007: a complete re-implementation of the GENEPOP software for Windows and Linux, Molecular Ecology Resources, 8(1), рр. 103–106, https://doi.org/10.1111/j.1471-8286.2007.01931.x. |
| [13] | STRs for identity ENFSI Reference database, v3/R4. |
| [14] | https://strider.online/frequencies |
| [15] | Jianye, Ge, et al. 2012, Developing criteria and data to determine best options for expanding the core CODIS loci, Investigative Genetics 3:1. |
| [16] | Guo, S., Thompson, E. (1992), Biometrics, V. 48. P. 361–372. |
| [17] | B.S., Weir, 1996, Multiple tests, in: Genetic Data Analysis II, Sinauer Associates, USA, p. 134. |
| [18] | D.E., Reich, M. Cargill et al. (2001), Linkage disequilibrium in the human genome, Nature, May 10; 411 (6834): 199-204, doi: 10.1038/35075590. |
| [19] | Bär, W., Brinkmann, B., Budowle, B., Carracedo A, Gill, P, Lincoln, P, Mayr, W, Olaisen, B, 1997, Recommendations on DNA. Supplementary report of the International Society for Forensic Genetics DNA Commission regarding the use of short tandem repeat (STR) systems; Forensic Sci Int 87(3): 179–184. |
| [20] | J., Felsenstein, 2009, PHYLIP: Phylogeny Inference Package (version 3.69), Available on http://evolution.gs.washington.edu/phylip.html. |
| [21] | Nei, M., Roychoudhury, A.K., 1974, Genetics, Vol.76, pages 379-390. |

 Abstract
 Reference
 Full-Text PDF
 Full-text HTML