Yangibayeva Nilufar Saparbay qizi1, Ro‘zmetov Rasul Sobirovich1, Matyokubov Zafar Sharipovich2, Doschanova Manzura Babajonovna1, Kurbanov Marks Matqurbonovich2, Saparboyev Zokir Yusubboyevich2, Ibragimova Sohiba Uktam qizi1, Matsopayeva Shaxnoza Alisherovna1
1Khorezm Ma’mun Academy, Khive, Uzbekistan
2Urgench State University named after Al-Beruni, Urgench, Uzbekistan
Copyright © 2025 The Author(s). Published by Scientific & Academic Publishing.
This work is licensed under the Creative Commons Attribution International License (CC BY).
http://creativecommons.org/licenses/by/4.0/

Abstract
This study investigated the composition and seasonal population dynamics of entomofauna in wheat fields located in Khiva district, Khorezm region, Uzbekistan. During the vegetation period from March to July 2024, insect monitoring was carried out regularly in two different fields with varying levels of entomophagous insects. The number of pest species belonging to the order Hemiptera peaked in June, reaching up to 500 individuals per square meter in Field 1 and 300 individuals in Field 2. Coleoptera pests also showed the highest abundance in June, with 10–12 individuals per square meter. The population of entomophagous insects such as Carabidae (up to 10), Coccinellidae (up to 8), and Chrysopidae (up to 6) also peaked in the same month. These findings highlight the practical significance of natural pest regulation by beneficial insects. Sampling was conducted using sweep nets, sticky traps, pitfall traps, and yellow Merik containers. The results provide valuable insight for planning environmentally friendly biological pest control strategies in wheat agroecosystems.
Keywords:
Phytophagous insects, Entomophagous insects, Coleoptera, Hemiptera, Population dynamics, Biological control
Cite this paper: Yangibayeva Nilufar Saparbay qizi, Ro‘zmetov Rasul Sobirovich, Matyokubov Zafar Sharipovich, Doschanova Manzura Babajonovna, Kurbanov Marks Matqurbonovich, Saparboyev Zokir Yusubboyevich, Ibragimova Sohiba Uktam qizi, Matsopayeva Shaxnoza Alisherovna, Entomofauna of Wheat Fields and Their Seasonal Variations in Population, International Journal of Genetic Engineering, Vol. 13 No. 7, 2025, pp. 139-142. doi: 10.5923/j.ijge.20251307.01.
1. Introduction
Entomofauna refers to the diversity and abundance of insect species inhabiting the wheat agroecosystem, which are in ecological interaction with one another and feed on plants, other insects, or organic matter [1,2]. The role of entomofauna in wheat fields is highly significant, as it directly influences fundamental processes such as agroecosystem stability, crop productivity, and the regulation of harmful organisms. The primary ecological contributions of entomofauna in wheat agrobiocenoses include the natural control of pest populations through predatory and parasitoid species, such as members of the families Coccinellidae, Syrphidae, and Chrysopidae, which help suppress aphids, thrips, and other harmful insects [5]. This natural regulation reduces the need for chemical pesticides and enhances ecological safety [3,4,6]. Furthermore, if nectar-producing flowers or other vegetation are present near wheat fields, pollinators such as bees and other beneficial insects play a critical role in supporting agroecosystem health. This encourages the proliferation of beneficial insect populations and contributes to greater ecological diversity.Entomofauna forms a multi-level trophic relationship: phytophages → predators → parasitoids → detritivores. This food chain ensures nutrient cycling and stability within the agroecosystem. Soil-dwelling insects (such as Collembola, Carabidae) break down organic matter, accelerating its decomposition into nutrients. This improves soil structure and the availability of nutrients [11].
2. Research Methods
This study was conducted in 2024 during the spring–summer growing season in the Khiva district of the Khorezm region, Uzbekistan. Two separate wheat fields located approximately [insert distance, 5 km] apart were selected to assess the seasonal dynamics of both pest and beneficial insect populations. The approximate geographical coordinates of Field 1 are [41.3628° N, 60.3938° E], and Field 2 are [41.3741° N, 60.3332° E].Insects were sampled monthly from March to July using a combination of standardized entomological techniques:• Sweep Net Sampling: For aerial and foliage-dwelling insects, a 38 cm diameter sweep net was used. Each sampling session consisted of 25 sweeps per plot, repeated four times per field (totaling 100 sweeps per field per sampling period). A single sweep consisted of a full arc motion (forward and back) across the upper third of wheat plants.• Pitfall Traps: To capture ground-dwelling insects, 200 ml plastic containers (diameter: 7.5 cm, depth: 9 cm) were used. Each trap was filled halfway with a 3% sodium chloride (NaCl) solution mixed with a drop of detergent to reduce surface tension. Twenty traps per hectare were placed flush with the soil surface, spaced at 20 m intervals. Samples were collected every 5 days [7,8,11].• Sticky Traps: Flying insects were also collected using sticky traps made from 20×30 cm sheets of parchment paper coated with Pestifix™ glue (manufactured by Biogents AG, Germany). These were mounted on stakes at a 1.5 m height, positioned in a 5 m row 5 m from the field edge, with trap spacing of 50–60 cm. The traps were inspected every 5 days.• Yellow Pan Traps (Merik containers): To sample pollinators and small flying insects, 25 cm diameter × 9 cm deep yellow plastic bowls were used, referred to as Merik containers (Jiangsu Xinrui Plastic Technology Co., Ltd., China). These traps were filled with soapy water and placed at 10 m intervals, active from wheat germination to maturity. Insects were collected every 5 days.Plant Inspection: For phytophagous insects such as aphids and thrips, visual inspection of plants was conducted. For aphids, 50 randomly selected plants were examined per plot with five replications, once every 7 days. For thrips, selected plants were inspected every 5 days [9,10].
3. Analysis of Research Results
Figure 1. Monthly distribution of Hemiptera insects in two wheat fields.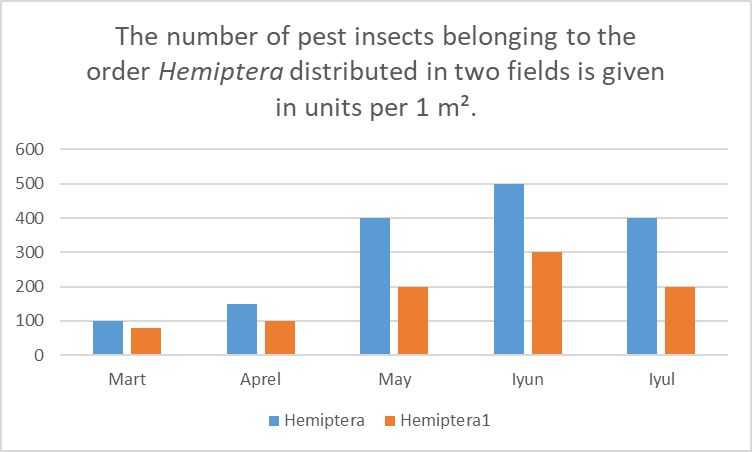 | Figure 1 |
This figure illustrates the monthly abundance of pest insects from the order Hemiptera collected in two separate wheat fields over the growing season. The blue bars represent data from Field 1, while the dark orange bars represent data from Field 2.• March: Field 1 recorded 100 specimens, while Field 2 had 70 specimens.• April: Field 1 increased to 150 specimens, and Field 2 to 100 specimens, indicating slightly increased activity in both fields.• May: A significant rise occurred, with Field 1 reaching 400 specimens, and Field 2 200 specimens — showing Field 1’s population was twice as high.• June: The peak of pest activity was observed, with Field 1 reaching 500 specimens and Field 2 approximately 300 specimens.• July: A decline followed, with Field 1 dropping to 400 specimens, and Field 2 to approximately 200 specimens.Overall, pest numbers gradually increased through the spring, peaked in June, and declined by July. Hemiptera populations remained consistently higher in Field 1 throughout the season. The critical period for pest control measures is May to June, when pest pressure is at its highest.Figure 2. This diagram shows the monthly distribution (per 1 m²) of pest insects belonging to the order Coleoptera (beetles) found in two different fields. In the graph, blue bars represent the number of Coleoptera pests in Field 1, and dark orange bars represent the number of Coleoptera pests in Field 2 (Coleoptera 1).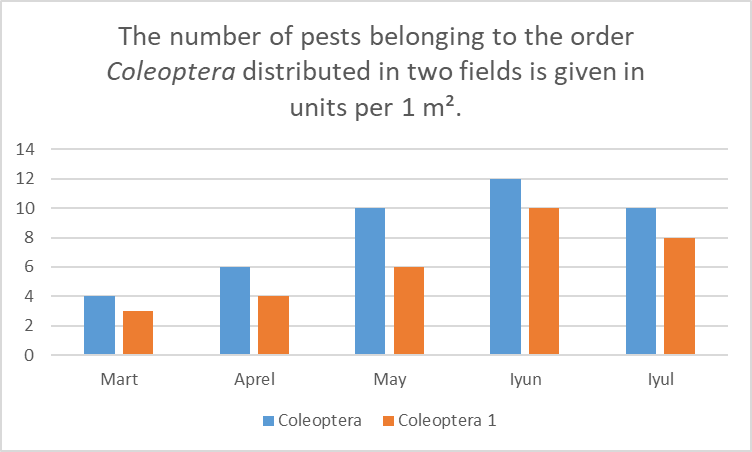 | Figure 2 |
March: 4 specimens in Field 1, 3 specimens in Field 2. Activity is low, but slightly higher in Field 1. April: 6 specimens in Field 1, 4 in Field 2. Activity is increasing, and Field 1 maintains the lead. May: 10 specimens in Field 1, 6 in Field 2. A sharp increase is observed, especially in Field 1. June: 12 specimens in Field 1, 10 in Field 2. The highest activity is recorded, with a significant rise in Field 2 as well. July: 10 specimens in Field 1, 8 in Field 2. A slight decrease is observed, but the level remains high. The number of pests increased from March to June and slightly declined in July. Throughout the entire period, pest numbers in Field 1 remained higher than in Field 2. The greatest risk of damage occurs in May and June.Figure 3. This diagram shows the monthly variation in the number of entomophagous insects (beneficial predatory insects) found in two different fields. Each bar corresponds to a specific month and represents the number of entomophagous insects found per 1 m². These insects belong to the following families: Carabidae (Field 1 and Field 2), Coccinellidae (Field 1 and Field 2), and Chrysopidae (Field 1 and Field 2).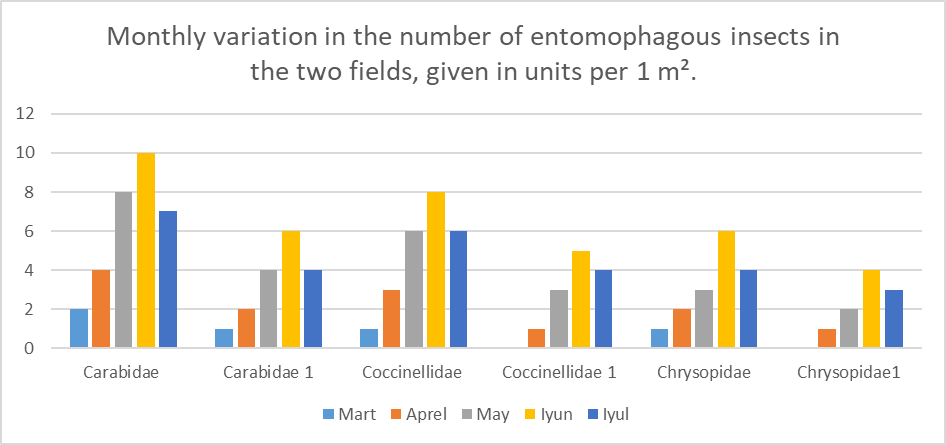 | Figure 3 |
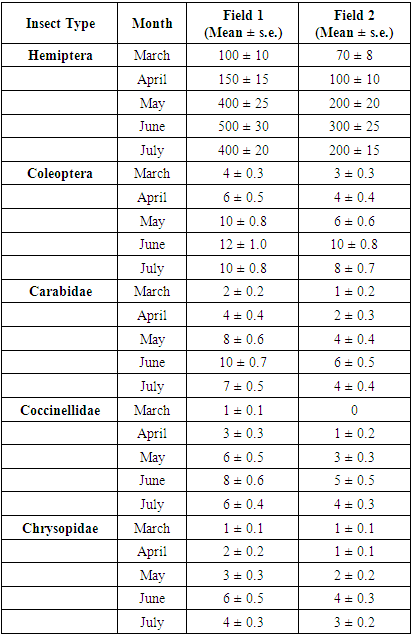
Carabidae (Field 1): In March, 2 specimens were recorded, in April – 4, in May – 8, and in June – 10, which was the highest. In July, the number slightly decreased to 7. A significant increase was observed throughout the year, reaching its maximum in June. Carabidae1 (Field 2): In March, 1 specimen was recorded, in April – 2, in May – 4, in June – 6, and in July – 4. Although the number is lower compared to Field 1, a growth trend is evident. Coccinellidae (Field 1): 1 specimen in March, 3 in April, 6 in May, and 8 in June, which was the peak. In July, the number dropped to 6. A noticeable increase was observed during the year. Coccinellidae 1 (Field 2): 0 specimens in March, 1 in April, 3 in May, 5 in June (the highest), and 4 in July. The numbers are lower than in Field 1 but show a similar dynamic.Chrysopidae (Field 1): In March, 1 specimen was recorded, in April – 2, in May – 3, and in June – 6, which was the highest. In July, the number decreased to 4. A clear increase was observed in May and June. Chrysopidae1 (Field 2): In March, 1 specimen was recorded, in April – 1, in May – 2, in June – 4, which was the peak, and in July – 3. Although the number was lower, growth was still evident. For all three entomophagous insect families, the highest activity was observed in June. Field 1 showed a consistent dominance in terms of entomophag numbers, which may indicate better ecological stability or more favorable conditions for beneficial insects in that area. The increase in the number of entomophagous insects may be related to the rise in pest populations (see previous diagrams). These data are important for evaluating the effectiveness of biological control. For pests and entomophagous insects per 1 m²: among pests belonging to the order Hemiptera, the highest number was recorded in June – 500 in Field 1 and 300 in Field 2. Activity levels were low in March, peaked in May and June, and decreased in July. Throughout the season, pest numbers in Field 1 were 1.5 to 2 times higher than in Field 2. Among pests belonging to the order Coleoptera, the highest number was observed in June – 12 in Field 1 and 10 in Field 2. In both fields, an upward trend from March to June was followed by a slight decrease in July. While Field 1 showed higher numbers throughout the entire period, the difference was relatively small (around 2 to 3 specimens). For example, Coccinellidae1 in Field 2 showed 5 specimens in June and 4 in July; Chrysopidae in Field 1 showed 6 in June and 4 in July; Chrysopidae1 in Field 2 showed 4 in June and 3 in July. The number of entomophagous insects also peaked in June, which indicates an intensification of natural control (biological control) in response to the increase in pest populations. The consistently higher number of entomophagous insects in Field 1 suggests a more stable agroecosystem or the presence of more favorable conditions for beneficial insects in that field.The relative abundance estimates presented in Table 1 represent the mean number of insects (± standard error) collected per square meter per month. The data were obtained using the following sampling methods: sweep netting, pitfall traps, sticky traps, and visual inspection of plants. Each value is based on repeated observations, which enhances the reliability and accuracy of the data.Table 1
 |
| |
|
The figures reported indicate the average number of insects per sampling unit per month, not the total counts. Replicated observations made it possible to calculate the variation (standard error) across samples, which is critical in ecological field studies. The ± s.e. values reflect the confidence in the monthly average estimates for each insect group.Table 1 has been designed to stand alone—fully interpretable without accompanying graphs or figures. This approach allows for a more concise presentation of results and enables researchers to formulate new scientific hypotheses based on observed biological trends.
4. Conclusions
The results of this study highlight the significance of understanding the composition and seasonal fluctuations of entomofauna in the wheat agroecosystem of the Khorezm region. Observations revealed that the relative abundance of pest insects—particularly Hemiptera and Coleoptera—gradually increased during the spring, reaching a peak in June. Similarly, entomophagous species such as Coccinellidae, Chrysopidae, and Carabidae were also most active during this period, confirming their important role in the natural regulation of pest populations.These findings provide a foundation for preserving biological diversity in wheat agrobiocenoses and promoting natural pest control mechanisms as alternatives to chemical pesticides. Furthermore, this entomological monitoring serves as a valuable reference for conducting systematic research, ensuring ecological safety, and developing integrated pest management (IPM) strategies.
References
| [1] | Sulaimanov, Kh. A., Akhmedova, O. Kh., & Sobirova, M. S. (2021). Parasites and predators of cicadas in Southern Uzbekistan. Oriental Renaissance: Innovative, Educational, Natural and Social Sciences, 1(Special Issue 5), 302–308. https://doi.org/10.24412/2181-1784-2021-5-302-308. |
| [2] | Zokirov, I. I., & Yusupova, Sh. Kh. (2021). Active entomofauna species and their significance. Journal of Scientific Innovations, 4(3), 105–110. |
| [3] | Turayeva, Z. R. (2024). Entomology: A Study Guide. Namangan State University. → A modern Uzbek-language textbook on entomofauna. |
| [4] | Nyffeler, M., & Benz, G. (1988). Feeding ecology and predatory importance of wolf spiders (Lycosidae) in field crops. Journal of Applied Entomology, 106(3), 123–134. https://doi.org/10.1111/j.1439-0418.1988.tb00500.x. → A key study on the feeding of Erigone atra and other spiders on pests. |
| [5] | Marc, P., Canard, A., & Ysnel, F. (1999). Spiders (Araneae) useful for pest limitation and bioindication. Agriculture, Ecosystems & Environment, 74(1–3), 229–273. https://doi.org/10.1016/S0167-8809(99)00039-1. → Spiders as beneficial predators and bioindicators in agrobiocenoses. |
| [6] | Riechert, S. E., & Lockley, T. (1984). Spiders as biological control agents. Annual Review of Entomology, 29(1), 299–320. https://doi.org/10.1146/annurev.en.29.010184.001503. → The role of spiders as tools of biological control. |
| [7] | Southwood, T. R. E., & Henderson, P. A. (2000). Ecological Methods (3rd ed.). Blackwell Science. → A comprehensive guide on ecological and entomological methods, including traps and sampling techniques. |
| [8] | Pedigo, L. P., & Rice, M. E. (2009). Entomology and Pest Management (6th ed.). Pearson Prentice Hall. → Methods for studying, monitoring, and managing agricultural pests. |
| [9] | Dent, D. (2000). Insect Pest Management (2nd ed.). CABI Publishing. → Covers entomological monitoring and both biological and ecological pest control methods. |
| [10] | Triplehorn, C. A., & Johnson, N. F. (2005). Borror and DeLong’s Introduction to the Study of Insects (7th ed.). Brooks/Cole. → Techniques for identifying, collecting, preserving, and statistically evaluating insects. |
| [11] | Gullan, P. J., & Cranston, P. S. (2014). The Insects: An Outline of Entomology (5th ed.). Wiley-Blackwell. → A broad and modern reference on insect biology and entomological studies. |

 Abstract
 Reference
 Full-Text PDF
 Full-text HTML