-
Paper Information
- Paper Submission
-
Journal Information
- About This Journal
- Editorial Board
- Current Issue
- Archive
- Author Guidelines
- Contact Us
International Journal of Genetic Engineering
p-ISSN: 2167-7239 e-ISSN: 2167-7220
2025; 13(5): 83-89
doi:10.5923/j.ijge.20251305.01
Received: Apr. 18, 2025; Accepted: May 15, 2025; Published: May 19, 2025

Analysis of SSR Markers Associated with Drought Tolerance of Bread Wheat Varities
 Abstract
 Reference
 Full-Text PDF
 Full-text HTML
Oybek A. Mukhammadiev1, 2, Gavhar F. Mamatkulova3, Doston Sh. Erjigitov3, Fakhriddin N. Kushanov4, Feruza U. Rafiyeva5, Durdona B. Sokiboyeva1
1PhD Student in Biological Sciences, Institute of Plant Genetics and Experimental Biology, Tashkent, Uzbekistan
2Teacher Assistant, Tashkent Pediatric Medical Institute, Uzbekistan
3Junior Researcher, Institute of Plant Genetics and Experimental Biology, Tashkent, Uzbekistan
4DSc in Biological Sciences, Institute of Plant Genetics and Experimental Biology, Tashkent, Uzbekistan
5Senior Researcher, Institute of Plant Genetics and Experimental Biology, Tashkent, Uzbekistan
Correspondence to: Oybek A. Mukhammadiev, PhD Student in Biological Sciences, Institute of Plant Genetics and Experimental Biology, Tashkent, Uzbekistan.
| Email: |  |
Copyright © 2025 The Author(s). Published by Scientific & Academic Publishing.
This work is licensed under the Creative Commons Attribution International License (CC BY).
http://creativecommons.org/licenses/by/4.0/

This study investigated the genetic diversity of Bread wheat cultivars by genotyping 24 SSR markers genetically linked to drought tolerance. The highest polymorphism information content values were determined for the primer pairs Wms261, Wms396, Wms148. Also, according to the results of the analysis of Ezoz and Oq Marvarid variety samples using SSR markers, the alleles formed for this trait are phylogenetically close to the Bardosh variety, which is known to have high drought tolerance, and these variety samples can also be evaluated as drought stress-tolerant genotypes.
Keywords: Bread wheat (Triticum aestivum L.), Variety, Abiotic stress, SSR, Drought, DNA, Marker
Cite this paper: Oybek A. Mukhammadiev, Gavhar F. Mamatkulova, Doston Sh. Erjigitov, Fakhriddin N. Kushanov, Feruza U. Rafiyeva, Durdona B. Sokiboyeva, Analysis of SSR Markers Associated with Drought Tolerance of Bread Wheat Varities, International Journal of Genetic Engineering, Vol. 13 No. 5, 2025, pp. 83-89. doi: 10.5923/j.ijge.20251305.01.
1. Introduction
- Wheat (Triticum aestivum L.) is one of the most important cereal crops in the world. It also provides more than 20% of the calories and protein needed to feed more than 35% of the world's population in more than 40 countries [1]. Wheat is sensitive to heat and drought stress, especially during the flowering and late embriogenesis stages of the vegetative period, which negatively affects yield and grain quality [4]. Water deficit during the vegetative growth stage has significant negative effects on plant physiology. Drought-induced stomatal closure reduces the plant's transpiration and cooling capacity, which leads to a significant increase in leaf temperature and a decrease in photosynthetic efficiency [15]. In addition, drought stress during the reproductive stage of wheat, especially during flowering and grain filling, has a serious impact on grain yield. [7] Water deficits have been shown to affect pollen viability, impair fertilization, and reduce grain size, resulting in reduced grain yield. In addition to physiological effects, drought stress also induces a variety of molecular responses in wheat. [8] The genetic diversity of Bread wheat varieties in terms of tolerance to drought was examined by phenotypic observations and simple sequence repeats (SSR) [1]. Golabadi et al. (2011) [12] used microsatellite markers to identify QTLs with yield-trait competent such as thousand grain weight and harvest index. [13] studied D genome-based genetic diversity research in terms of tolerance to drought using SSR markers. In addition, SNPs are the most abundant polymorphic markers in plant [14]. The bi-allelic nature, high level of polymorphisms, ubiquitous presence, uniform distribution across genomes, automated data acquisition, and analysis make SNPs the most suitable marker for genome-wide marker analysis [20].
2. Materials and Methods
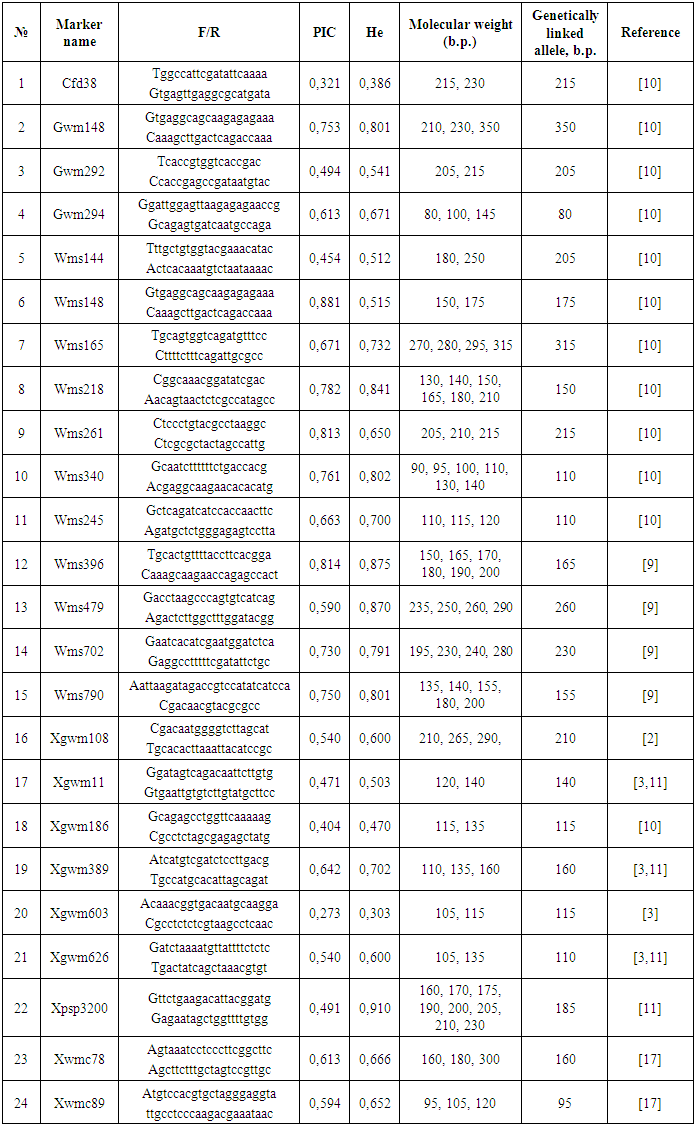
- Plant materials: 18 domestic and foreign varieties of winter Bead wheat: Asr, Bardosh, Baxmal-97, Chillaki, Do’stlik, E’zoz, KATE-1, KR12-07, KR12-5003, KR12-9023, Krasnodar 99, Mars-1, Oqmarvarid, Qayroqtosh, Shams, Surxak, Xisorak varieties were used in the research.DNA Extraction and SSR marker assay: Varieties were grown under climate control at 25°C for 14 days for isolating DNA. The CTAB method was used to isolate genomic DNA from research samples. SSR markers specific for wheat were used to determine mutual genetic polymorphism between wheat varieties. PCR (hot-start wheat program) working mixture was prepared in a volume of 10 μl. The DNA concentrations of the samples were determined by gel electrophoresis by visual comparison with lambda (λ) phage DNA at a specific concentration (25 ng/μl) on a 0.9% agarose gel. Then, PCR amplification products were subjected to horizontal electrophoresis in 2.5% agarose gel at 100 V voltage for 90 minutes. Molecular weight marker is Invitrogen 50 bp DNA ladder (Cat. No. 10416014).SSR markers panel. In order to study the level of drought tolerance of the selected variety samples for the study, a panel of DNA markers genetically linked to these traits was created. Various literature was used to compile this panel of markers, and SSR markers with a high level of polymorphism were selected.
3. Results
- It was observed that 24 out of 45 pairs of SSR microsatellite markers showed polymorphism, while the remaining 21 SSR markers were monomorphic. Bread wheat varieties showing polymorphism were involved as donors in selection for creating new varieties with high productivity and grain quality. Research samples were screened with SSR markers using the polymerase chain reaction (PCR) method.PCR screening was performed on the identified DNA samples using primers genetically associated with drought tolerance. The following data were obtained as a result of PCR analysis of the WMS261 SSR marker, which is associated to valuable economic traits, in particular, the drought tolerance. In this case, the presence of three different alleles for a specific marker trait in a study samples indicates high polymorphism. Based on the results, it was noted that samples 3-, 4-, 6-, 8-, 11-, 12-, 13-, 17-with a 215-pair nucleotide resistance allele, samples 1-, 2-, 5-, 9-, 14-, 15-, 16-, 18-with a 205-pair nucleotide allele, and samples 7-, 10-with a 210-pair nucleotide allele were similar to each other (Figure 1).
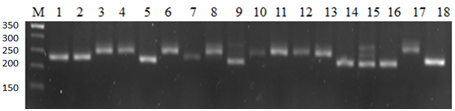 | Figure 1. Electrophoregram of the polymorphic WMS261 microsatellite marker. 1-Baxmal- 97, 2-Oqmarvarid, 3-E’zoz, 4-Asr, 5-Qayroqtosh, 6-Bardosh, 7-Surxak, 8-Yaksart, 9-Do’stlik, 10-KATE-1, 11-Mars-1, 12-Chillaki, 13-Krasnodarskaya-99, 14-Xisorak, 15-Shams, 16-KR12-07, 17-KR12-5003, 18-KR12-9023 |
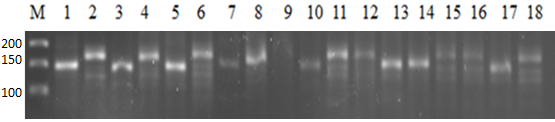 | Figure 2. Electrophorogram of the polymorphic WMS148 microsatellite marker. 1-Baxmal- 97, 2-Oqmarvarid, 3-E’zoz, 4-Asr, 5-Qayroqtosh, 6-Bardosh, 7-Surxak, 8-Yaksart, 9-Do’stlik, 10-KATE-1, 11-Mars-1, 12-Chillaki, 13-Krasnodar 99, 14-Xisorak, 15-Shams, 16-KR12-07, 17-KR12-5003, 18-KR12-9023 |
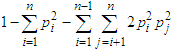 The heterozygosity value is calculated according to the following formula according to Nei, et al. [8]:
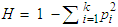 According to Botstein et al. (1980), markers with a PIC value higher than 0.5 have a high degree of polymorphism and are considered reliable for use in molecular genetic studies.
|
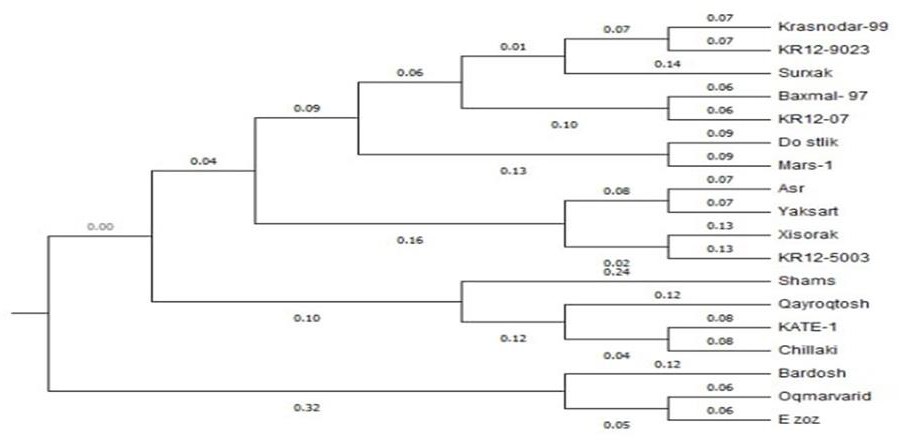 | Figure 3. Phylogenetic tree of wheat samples |
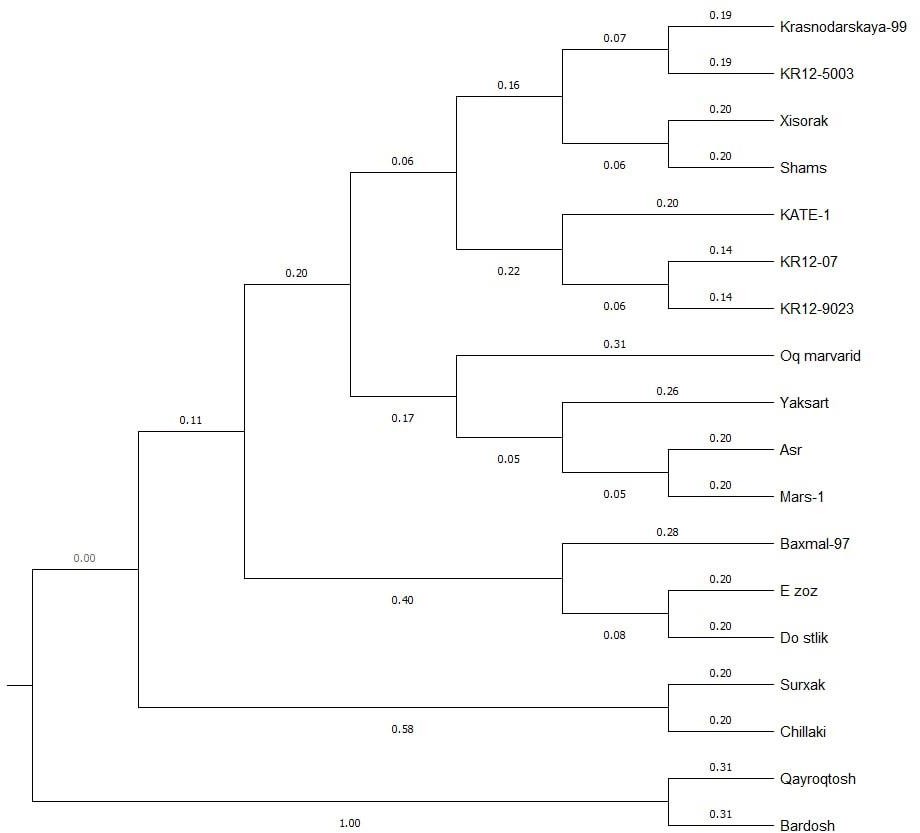 | Figure 4. Cluster analysis of drought tolerance alleles of the study samples |
|
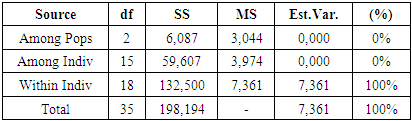
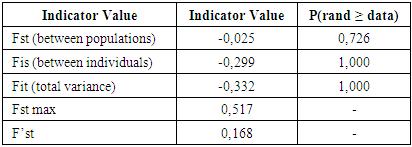
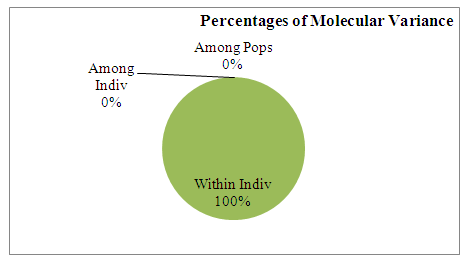 | Figure 5. Distribution of variance according to AMOVA results |
|
4. Discussion
- This research provides comprehensive molecular characterization of drought tolerance in 18 Bread wheat varieties using SSR markers, offering valuable insights for wheat improvement programs. The results show significant genetic diversity in drought-responsive alleles among the studied varieties, with important implications for MAS (marker assisted selection). The polymorphism analysis revealed that 24 out of 45 SSR markers showed polymorphism, consistent with previous reports of SSR polymorphism rates in wheat [19] Notably, SSR markers WMS261, WMS396 and WMS148 showed particularly high polymorphism (PIC > 0.8), [18] The observed allele patterns at these loci suggest distinct drought tolerance mechanisms among the cultivars, with the 215-bp allele of WMS261 and 175-bp allele of WMS148 potentially representing valuable markers for breeding. Cluster analysis revealed two major groups with distinct drought tolerance profiles. The close clustering of KR12-5003, Hisorak and Krasnodar99 (genetic distance <0.16) suggests shared genetic mechanisms for drought tolerance, possibly through common ancestral origins or convergent selection. These findings align with [12] report of co-localized QTLs for drought tolerance in similar wheat genotypes. The exceptional position of Bardosh (genetic distance = 1.00) confirms its unique drought tolerance characteristics, supporting previous phenotypic observations [5] The intermediate positions of Ezoz and Oq Marvarid near Bardosh suggest they may share some tolerance mechanisms, making them potential candidates for pyramiding drought tolerance genes. The genetic distance patterns observed (0.07-1.00) reflect the wide diversity in drought response strategies among wheat varieties, consistent with the findings of [13] The marker-trait associations identified in this study, particularly the high-PIC markers linked to drought tolerance, provide practical tools for breeding programs. The panel of polymorphic SSR markers developed here offers a cost-effective solution for marker-assisted selection in resource-limited settings, complementing newer SNP-based approaches [14]. The clear separation of varieties based on tolerance alleles supports the potential for developing molecular breeding strategies targeting specific drought response mechanisms.These findings advance our understanding of drought tolerance genetics in Bread wheat and provide a foundation for developing drought resistant varieties. Future work should validate these markers in diverse genetic backgrounds and environments, and explore their relationships with physiological drought tolerance traits. Integration of these SSR markers with high-throughput SNP genotyping could further enhance breeding efficiency for drought tolerance.
5. Conclusions
- The cluster analysis demonstrates the genetic similarity between wheat varieties and their grouping patterns based on resistance alleles. The dendrogram reveals that varieties positioned at the upper cluster (including KR12-5003, Hisorak, and Krasnodar99) show close genetic proximity, indicating shared resistance alleles. Bardosh, located at the lower cluster, exhibits significant genetic divergence from other varieties in terms of resistance alleles, while demonstrating notable drought resistance characteristics. These relults provide valuable genetic markers for developing drought-resistant wheat varieties through selective breeding programs.